A Design for a Manufacturing-Constrained Off-Axis Four-Mirror Reflective System
←
→
Page content transcription
If your browser does not render page correctly, please read the page content below
applied
           sciences
Article
A Design for a Manufacturing-Constrained Off-Axis
Four-Mirror Reflective System
Ruoxin Liu, Zexiao Li, Yiting Duan and Fengzhou Fang *
 State Key Laboratory of Precision Measuring Technology & Instruments, Centre of MicroNano Manufacturing
 Technology-MNMT, Tianjin University, Tianjin 300072, China; ruoxin_liu@tju.edu.cn (R.L.);
 zexiaoli@tju.edu.cn (Z.L.); ytduan@tju.edu.cn (Y.D.)
 * Correspondence: fzfang@tju.edu.cn

 Received: 28 June 2020; Accepted: 30 July 2020; Published: 4 August 2020

 Abstract: Off-axis reflective optical systems find wide applications in various industries, but the
 related manufacturing issues have not been well considered in the design process. This paper
 proposed a design method for cylindrical reflective systems considering manufacturing constraints to
 facilitate ultra-precision raster milling. An appropriate index to evaluate manufacturing constraints
 is established. The optimization solution is implemented for the objective function composed of
 primary aberration coefficients with weights and constraint conditions of the structural configuration
 by introducing the genetic algorithm. The four-mirror initial structure with a good imaging quality
 and a special structural configuration is then obtained. The method’s feasibility is validated by
 designing an off-axis four-mirror afocal system with an entrance pupil diameter of 170 mm, a field of
 view of 3◦ × 3◦ and a compression ratio of five times. All mirrors in the system are designed to be
 distributed along a cylinder.

 Keywords: mirror system design; optical fabrication; constrained optimization

1. Introduction
     Reflective optical systems have attracted much interest because of their extensive use in many
fields such as space optical systems [1] and infrared scanning systems [2,3]. Due to the advantages
of the reflective optical system such as being free of chromatic aberrations, a foldable optical path,
a large aperture, insensitive to temperature and pressure changes, etc., more attention has been paid to
the design of the reflective systems than to the refractive systems. In addition, making the field of
view (FOV) off-axis can also solve the obstruction problem in reflective systems [4]. Among them, the
four-mirror system can obtain a good imaging quality, a compact structure, a large FOV, and a large
aperture because of its higher design degrees of freedom.
     With the development of the ultra-precision machining system, it is possible to manufacture
reflective optical systems with complex surfaces such as aspheric surfaces and freeform surfaces [5–7].
The reflective optical systems usually go through a series of processes (e.g., design, machining,
assembling, etc.) before being put into use. However, most of the current design methods focus only
on how to improve the optical performance of these systems, while the manufacturing issues are
not well considered in the design process. The consequence is that the optical system with complex
surfaces is usually difficulty to achieve in machining and assembling, even if it may satisfy the optical
requirements in theory. This reduces the practicability of the designed optical system. Introducing
manufacturing constraints into the design process helps to simplify the machining and assembling
process. Meng et al. developed an off-axis three-mirror system with the primary mirror and tertiary
mirror integrated on a single substrate, in which the number of mirrors that need optical alignment
is reduced from three to two [8]. Li et al. proposed an alignment-free manufacturing approach to

Appl. Sci. 2020, 10, 5387; doi:10.3390/app10155387                            www.mdpi.com/journal/applsci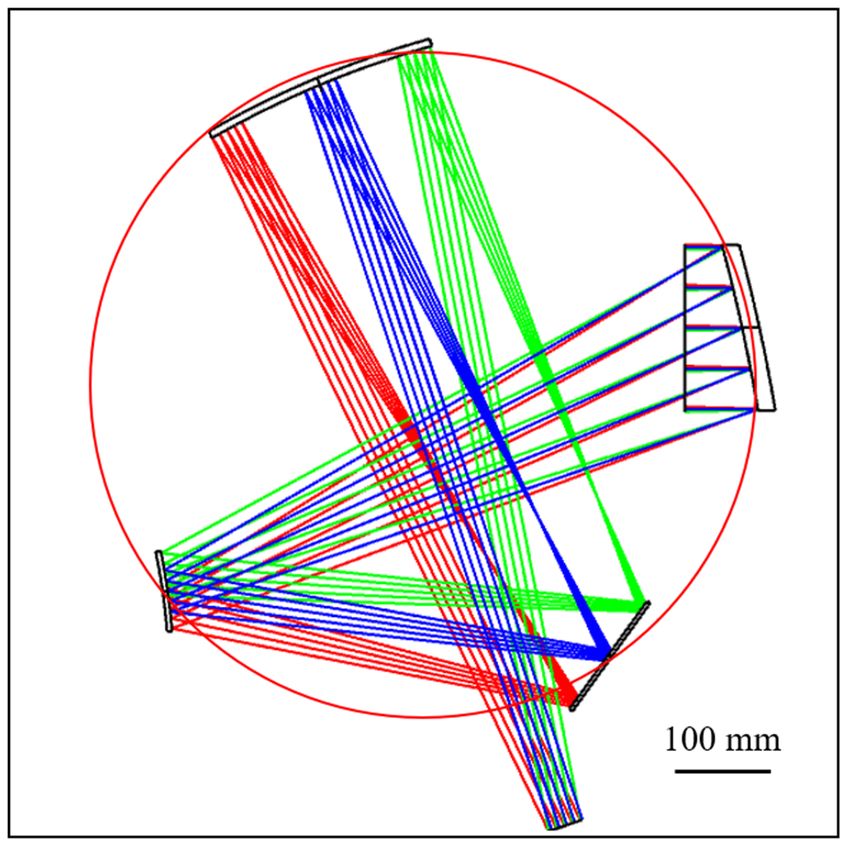
Appl. Sci. 2020, 10, 5387                                                                           2 of 17

machine the off-axis multi-reflective system, in which the measurement methods were also established
to evaluate optical performance of the integrated system [9]. Zheng et al. proposed the concept of
the reference surface to limit the position of each mirror in an off-axis three-mirror anastigmat (TMA)
optical system [10]. The reference surface theory requires that the mirror’s surface must be close enough
to the reference surface to make the machining process more accessible. The shape of the reference
surface depends on the machining method: for the turning and milling process, the reference surface
are the symmetric rotational surface and the extended surface, respectively [11–13]. A cylindrical
reference surface also helps to make the machining process more effective. When all mirror surfaces in
a reflective optical system are close to the same cylindrical surface, the milling process will be greatly
simplified, and the optical alignment caused by the asymmetry of the freeform surface can also be
avoided. Therefore, the similarity between the mirror’s surfaces and the reference surface should be
considered at the level of design.
      At present, the mainstream optical design software adopts the damped least square (DLS) method
as the optimization algorithm [14,15]. This algorithm is a local optimization algorithm, which is easy
to fall into the local minimum value in the optimization process, so the final design result is often
the local optimal solution close to the initial point rather than the global optimal solution. Therefore,
the existing optical design software depends heavily on the selection of the initial structure. In other
words, the selection of a reasonable initial structure is a critical step in the optical system design.
Generally, in order to design an optical system that meets the requirements, it is necessary to find
the initial structure parameters from the existing references and then optimize the initial structure.
However, for some optical systems with special structural configurations, this method may not be
applicable. To meet different design requirements, the structure of the optical system cannot rely on the
existing initial structure excessively. Based on the genetic algorithm (GA), this paper presents a method
to automatically calculate the initial structural parameters that satisfy the manufacturing constraints.
      GA is a highly parallel, random and adaptive global optimization algorithm proposed by Holland
in 1975, which is based on Darwin’s theory of “survival of the fittest” [16,17]. The algorithm iteratively
optimizes the objective function by relying on biologically inspired operators such as mutation,
crossover and selection. GA has been widely used in the optimization of optical systems [18–21], such as
diffractive optical elements [22], the deformable mirror in adaptive optical systems, the wavefront
coding system [23,24], and the design of the optical system with large FOV. In this paper, GA is used to
find practicable initial structures of reflective optical systems with special requirements.

2. Working Principle

2.1. Manufacturing Constraints Analysis for Four-Mirror System
     Manufacturing constraints in optical systems depend on practical manufacturing methods.
Figure 1a demonstrates a computer integrated manufacturing system for an off-axis four-mirror
reflective optical system based on raster milling.
     In order to avoid the time-consuming machining process and the tedious assembly process before
the system is put into use, all the mirror blanks can be assembled according to the design position, and
then all the mirrors can be processed synchronously by raster milling.
     In this method of processing, all mirrors are free of disassembly and assembly, in which the
position accuracy of the mirrors depends only on the machine tool. Compared with the traditional
method, there is no need to process the locating surface so that the alignment error can be avoided,
and the system can be put into use after the processing is completed. An ultra-precision machine
tool has a high motion accuracy, which ensures the excellent position accuracy between the mirrors.
Therefore, the good optical performance of the whole system is ensured.
     The curvature radii of the mirror surfaces in the system should be greater than the rotational radius
of the tools, and all the mirror surfaces should be close to a cylindrical reference surface, as shown in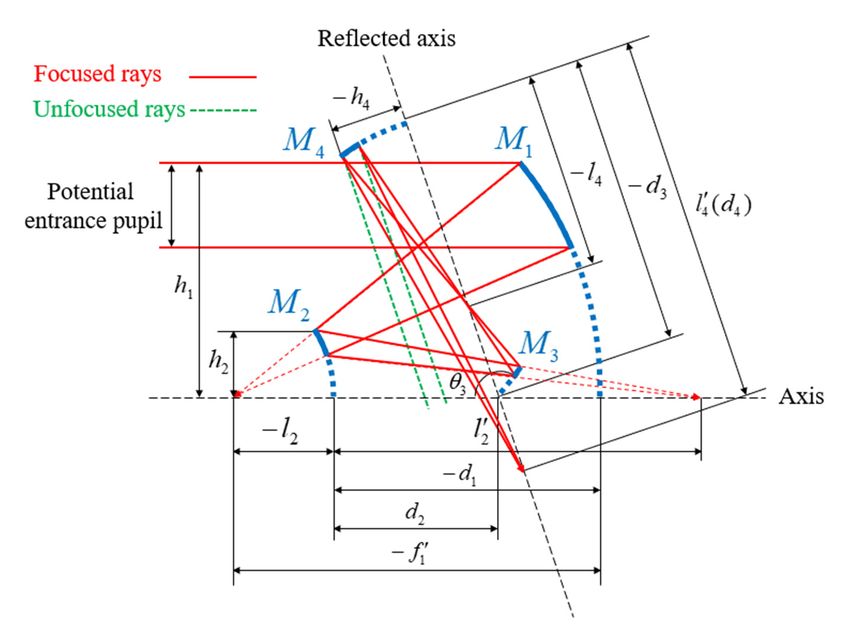
Appl. Sci. 2020, 10, 5387 3 of 17
Figure 1b. These manufacturing constraints should be reflected in the design process of the system to
ensure a smooth
Appl. Sci. 2020, 10, xmachining process.
FOR PEER REVIEW 3 of 18
Figure 1. (a) Machining configuration for the four-mirror system. (b) The geometric relationship
between the mirrors’ surfaces and the reference surface. In the figure, O is the center of the reference
surface and R is the radius of the reference surface.
In order to avoid the time-consuming machining process and the tedious assembly process
before the system is put into use, all the mirror blanks can be assembled according to the design
position, and then all the mirrors can be processed synchronously by raster milling.
In this method of processing, all mirrors are free of disassembly and assembly, in which the
position accuracy of the mirrors depends only on the machine tool. Compared with the traditional
method, there is no need to process the locating surface so that the alignment error can be avoided,
and the system can be put into use after the processing is completed. An ultra-precision machine tool
has a high motion accuracy, which ensures the excellent position accuracy between the mirrors.
Therefore, the good optical performance of the whole system is ensured.
The
Figure curvature
Figure radii of configuration
1. 1.(a)(a)Machining
Machining the mirror surfaces
configuration for the
for in the system
the four-mirror
four-mirror should
system.
system. (b)
(b)Thebe geometric
The greater than
geometric the rotational
relationship
relationship
radius of the
between tools,
the and
mirrors’ all the
surfacesmirror
and the surfaces
reference should
surface. be
In close
the to
figure, O
a cylindrical
is the center
between the mirrors’ surfaces and the reference surface. In the figure, O is the center of the reference reference
of the surface, as
reference
shown in Figure
surface
surface and R1b.
and R These
is
is the the manufacturing
of the referenceconstraints
radius
radius of the reference surface.
surface. should be reflected in the design process of the
system to ensure a smooth machining process.
InIn
In order tothere
practice,
practice, avoid
there is the
is time-consuming
always
always aa deviation machining
deviation between
between the theprocess
mirrorand
mirror andthe
and thetedious
the referenceassembly
reference surface.
surface. process
For
For one
one
before
mirror in the
thissystem
system, is put
the into
region use, all
betweenthe mirror
the
mirror in this system, the region between the mirror’s surface blanks
mirror’s can
surface be assembled
and the according to the
the reference surface is called the
reference surface is design
called the
position,
deviation and
deviation region, then
region, as all
as shownthe
shown in mirrors
in Figurecan
Figure 2. be
2. processed synchronously by raster milling.
In this method of processing, all mirrors are free of disassembly and assembly, in which the
position accuracy of the mirrors depends only on the machine tool. Compared with the traditional
method, there is no need to process the locating surface so that the alignment error can be avoided,
and the system can be put into use after the processing is completed. An ultra-precision machine tool
has a high motion accuracy, which ensures the excellent position accuracy between the mirrors.
Therefore, the good optical performance of the whole system is ensured.
The curvature radii of the mirror surfaces in the system should be greater than the rotational
radius of the tools, and all the mirror surfaces should be close to a cylindrical reference surface, as
shown in Figure 1b. These manufacturing constraints should be reflected in the design process of the
system to ensure a smooth machining process.
In practice, there is always a deviation between the mirror and the reference surface. For one
mirror in this system, the region between the mirror’s surface and the reference surface is called the
deviation region, as shown in Figure 2.
Figure 2.
Figure 2. The
The deviation
deviation region
region between
between the
the mirror’s
mirror’s surface and the reference surface. In the figure,
Ω integral region and θ
Ω is the integral region and θ is the angle formedformed
is the is the angle by the mirror’s
by the mirror’s edge andedge and the
the Z-axis Z-axis
of the of the
cylindrical
cylindrical system.
coordinate coordinate system.
To quantify this deviation, the index called the average deviation from the reference surface
(ADRS), σADRS , is defined to characterize the average deviation between the mirrors’ surface and the
reference surface in the design, Z
1
σADRS = |S − R|dΩ, (1)
Ω
Ω
Figure 2. The deviation region between the mirror’s surface and the reference surface. In the figure,
Ω is the integral region and θ is the angle formed by the mirror’s edge and the Z-axis of the
cylindrical coordinate system.
To quantify this deviation, the index called the average deviation from the reference surface
(ADRS), σ ADRS , is defined to characterize the average deviation between the mirrors’ surface and the
reference surface in the design,
Appl. Sci. 2020, 10, 5387 1 4 of 17
Ω Ω
σ ADRS = S − R d Ω, (1)
whereS Sis the
where equation
is the of the
equation mirror’s
of the surface
mirror’s in the
surface in cylindrical coordinate
the cylindrical system
coordinate and Rand
system R radius
is the is the
of the reference surface. Ω
radius of the reference surface. Ω is the integral region, which has the following differential form:
is the integral region, which has the following differential form:
d Ω = d θ dz , (2)
dΩ = dθdz, (2)
where θ is the angle formed by the mirror’s edge and the Z-axis of the cylindrical coordinate
where
system.θ is the angle formed by the mirror’s edge and the Z-axis of the cylindrical coordinate system.
In
In the
the raster
raster milling
milling process,
process, the
thedeviation
deviation region
region ofofaacross-section
cross-sectionperpendicular
perpendicular to
to the
the tool’s
tool’s
rotation direction should also be considered, as shown in Figure
rotation direction should also be considered, as shown in Figure 3a. 3a.
Figure
Figure 3. (a)The
3. (a) Thedeviation
deviation region
region between
between thethe mirror’s
mirror’s surface
surface and and the reference
the reference surface
surface in a
in a cross-
cross-section. (b) Other
section. (b) Other possible
possible positional
positional relationships
relationships of theofmirror
the mirror andreference
and the the reference surface.
surface.
In
In aacross-section
cross-sectionof
ofthis
thisstructure,
structure,Equation
Equation(1)(1)can
canbe
berewritten
rewrittenas
as
Z
11
σ ADRS== ρρ−−RRddθ,
σADRS θ, (3)
(3)
θθ
whereθ θis the
where central
is the angle
central of the
angle ofmirror, ρ is theρequation
the mirror, of the mirror’s
is the equation of thesurface
mirror’sin the polarincoordinate
surface the polar
system and R is the radius of the reference surface. Equation (3) also applies to other possible
coordinate system and R is the radius of the reference surface. Equation (3) also applies to other positional
relationships of the mirror
possible positional and theofreference
relationships the mirrorsurface,
and theas shown
referencein Figure
surface,3b.
asThis
shownindex can effectively
in Figure 3b. This
reflect
index can effectively reflect the deviation degree regardless of the different positions and sizesthe
the deviation degree regardless of the different positions and sizes of mirrors. Meanwhile, of
maximum deviation from
mirrors. Meanwhile, the reference
the maximum surfacefrom
deviation of each
the mirror alsosurface
reference needs ofto each
be considered.
mirror also needs to
In order to make this machining method easier to achieve, it is necessary to plan the tool’s radius
be considered.
of gyration and tool spindle path in the design stage. For a cross-section perpendicular to the tool’s
rotation direction in the structure, draw the equidistance lines of the mirror’s surface L1 (Rt ), L2 (Rt ),
L3 (Rt ), and L4 (Rt ) toward the center of the reference surface. The distance between the ends of the
equidistant lines of adjacent mirrors is denoted by di (Rt )(i = 1, 2, 3, 4). The equidistant line parameter
d is equal to the tool’s radius of gyration Rt , as shown in Figure 4.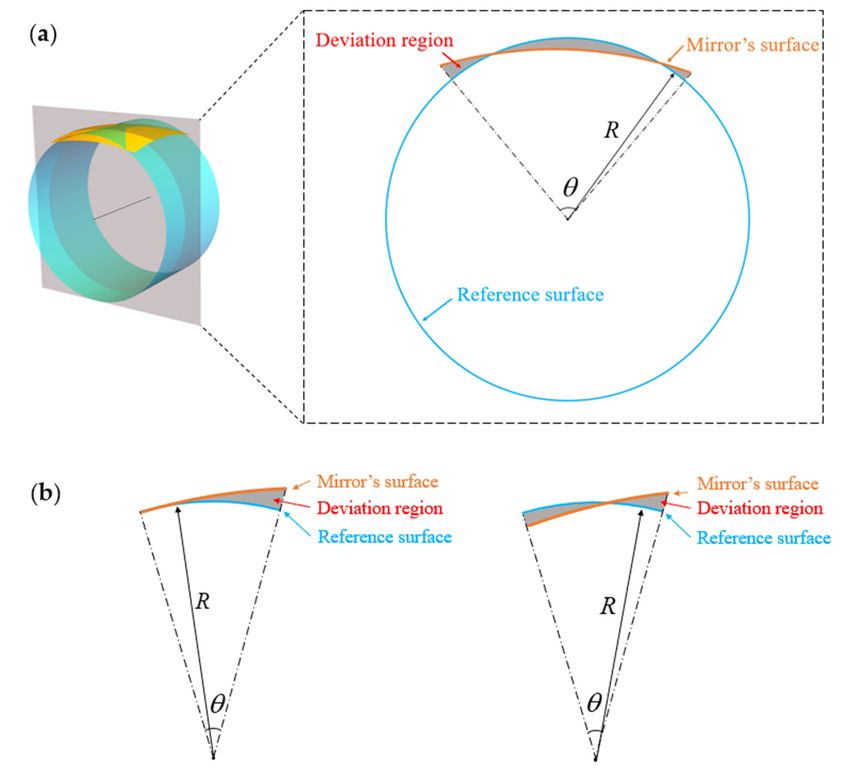
In order to make this machining method easier to achieve, it is necessary to plan the tool’s radius
of gyration and tool spindle path in the design stage. For a cross-section perpendicular to the tool’s
rotation direction in the structure, draw the equidistance lines of the mirror’s surface L1 ( Rt ) , L2 ( Rt ) ,
L3 ( Rt ) , and L4 ( Rt ) toward the center of the reference surface. The distance between the ends of the
equidistant
Appl. Sci. 2020, 10, 5387lines of adjacent mirrors is denoted by di ( Rt ) ( i = 1, 2,3, 4 ) . The equidistant 5line
of 17
parameter d is equal to the tool’s radius of gyration Rt , as shown in Figure 4.
FigureFigure
4. The 4.
toolThe tool turning
turning radius andradiustooland
pathtool path
in the in the structure.
structure. In the
In the figure, figure,
Li (R t ) is the ( Rt ) is the
Li equidistance
lines ofequidistance
the mirror’slines
surface, (Rt ) is the
of thedimirror’s surface, di ( Rbetween
distance t)
is the the endsbetween
distance of the equidistant
the ends oflines of adjacent
the equidistant
andofRadjacent
mirrorslines t is the tool’s radius
mirrors and ofRt gyration.
is the tool’s radius of gyration.
The moving rangerange
The moving of the of tool spindle
the tool in the
spindle X-Y
in the plane
X-Y planedecreases
decreasesas asthe
the tool’s radiusofofgyration
tool’s radius gyration
4 4
t )dreaches
P
Rt increases. WhenWhen
R increases.
t
di (R
i=1
( R ) reaches
i
the minimum
t
value,
the minimum the the
value, tool’s radius
tool’s radius gyrationRtRreaches
ofofgyration reachesits t
i =1
maximum Rtmax , as shown in the following equation:
its maximum Rt max , as shown in the following equation:
44
∃Rt = ∃RRtmax
t = R arg min ddi ((RRt )t.).
, R ==argmin
X
,tR
max
tmaxt max i (4) (4)
R t i =1
Rt i=1
When the maximum radius of gyration Rt max is obtained, the tool spindle path C is the closed
When the maximum radius of gyration Rtmax is obtained, the tool spindle path C is the closed
path surrounded by Li ( Rt max ) and di ( Rt max ) , which is calculated by the following formula:
path surrounded by Li (Rtmax ) and di (Rtmax ), which is calculated by the following formula:
4
C4 = ( Li ( Rt max ) + di ( Rt max ) ).
X (5)
i =1
C= (Li (Rtmax ) + di (Rtmax )). (5)
i=1
2.2. Aberration Analysis for Four-Mirror System
2.2. Aberration Analysis for Four-Mirror System
According to the particular constraints proposed by the previous section, we chose a four-mirror
According to the
structure that particular
contains constraints
a plane proposed
mirror. The by thecan
plane mirror previous
fold thesection,
beam pathwe to
chose
meeta the
four-mirror
special
manufacturing method mentioned above and also provides the degree of freedom
structure that contains a plane mirror. The plane mirror can fold the beam path to meet the special for the final
aberration correction. Figure 5 shows the layout of the four-mirror reflective system.
manufacturing method mentioned above and also provides the degree of freedom for the final
aberration correction. Figure 5 shows the layout of the four-mirror reflective system.
This system is composed of three curved mirrors and one plane mirror: a primary mirror (M1 ),
a secondary mirror (M2 ), a tertiary mirror (M3 ) and a quaternary mirror (M4 ), in which M3 is the
plane mirror tilted at an angle of θ3 . The conic coefficients of M1 , M2 , and M4 in this structure are k1 ,
k2 , and k4 . The incident ray heights of M1 , M2 , and M4 are h1 , h2 and h4 . li (i = 2, 4) and l0 i (i = 2, 4) are
the object distances and the image distances of M2 and M4 .
The obscure ratios of M2 to M1 and M4 to M2 are α1 and α2 , respectively, and the magnification
ratios of M2 and M4 are β1 and β2 , respectively. They are defined as follows:
l2 h2 l0 2 u2
α1 = ≈ h1 , β1 = l2 =
f 01 u0 2
l4 h4 l0 4 u4 . (6)
α2 =
h 2 , β 2 = l4
l0 2 ≈ = u0 4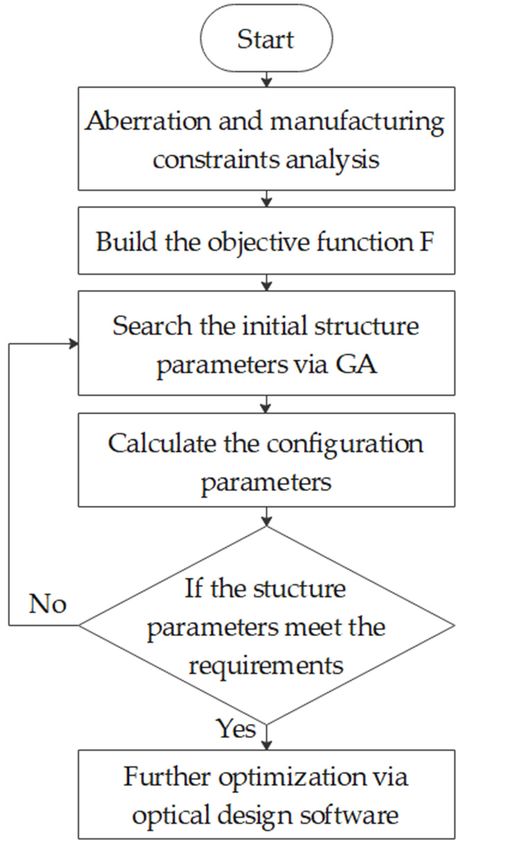
Appl. Sci. 2020, 10, 5387 6 of 17
According to the paraxial optical theory [25], the obscure ratios and magnification ratios defined
by the Equation (6), the curvature radius of the mirror and the distance between the mirror i and the
mirror i + 1 can be deduced as follows:
2f0
R1 = β1 β2
2α1 f 0
R2 = , (7)
β2 (1+β1 )
2α1 α2 f 0
R4 =
1 + β2
(1−α ) f 0
d1 = β1 β12
α (1−α ) f 0 ,
(8)
d2 + d3 = 1 β2 2
d4 = α1 α2 f 0
where f 0 is the focal length of the four-mirror optical system.
Based on the primary aberration theory [26], we can obtain the third-order aberrations expressed
in terms of the structure parameters α1 , α2 , β1 , β2 , k1 , k2 and k4 [27]. Due to space limitation, the implicit
functions are as follows:
S1 = S1 (αi , βi , ki )
S2 = S2 (αi , βi , ki )
S3 = S3 (αi , βi , ki ) .
(9)
S4 = S4 (αi , βi , ki )
S = S (α , β , k )
5 5 i i i
Appl. Sci. 2020, 10, x FOR PEER REVIEW 6 of 18
Figure
Figure 5. 5.
TheThelayout
layoutof
ofthe
the four-mirror
four-mirror system.
system.
2.3. SearchThis
for the Initial
system Structure via
is composed GA curved mirrors and one plane mirror: a primary mirror ( M1 ) ,
of three
a secondary
GA is a global mirror ( M2 ) , a tertiary
optimization mirror
algorithm ( M3does
that ) andnot
a quaternary
depend on mirror ( M4 ) , in
the initial which M 3 Itisuses
parameters. the the
plane
principle of mirror
naturetilted at an angle
to “evolve” of θan
toward 3 . The conicsolution.
optimal coefficients M1 , M
Forofhighly 2 , and Mand
nonlinear 4 inhigh-dimensional
this structure
are k1optimization
parameter , k2 , and k4 . The
problems,
incidentGA ray can often
heights M 1 , the
of find M 2 , optimal
and M 4 solution
are h1 , h2effectively ( i = 2, 4In) our
and h4 . li [28].
i ( i = 2, 4 ) are the object distances and the image distances of M 2 and M 4 .
work,and
GA lis ′ used to optimize the objective function to obtain the initial optical system parameters.
The algorithm iteratively optimizes the objective function by relying on
The obscure ratios of M 2 to M 1 and M 4 to M 2 are α1 and α2 , respectively, and biologically inspired operators
the
such as mutation, crossover and selection.
magnification ratios of M and M are β and β , respectively. They are defined as follows:
2 4 1 2
l2 h2 l2′ u2
α1 = f ′ ≈ h , β1 = l = u ′
1 1 2 2
. (6)
α = l4 ≈ h4 , β = l4′ = u4
2 l2′ h2 2 l4 u4′
According to the paraxial optical theory [25], the obscure ratios and magnification ratios defined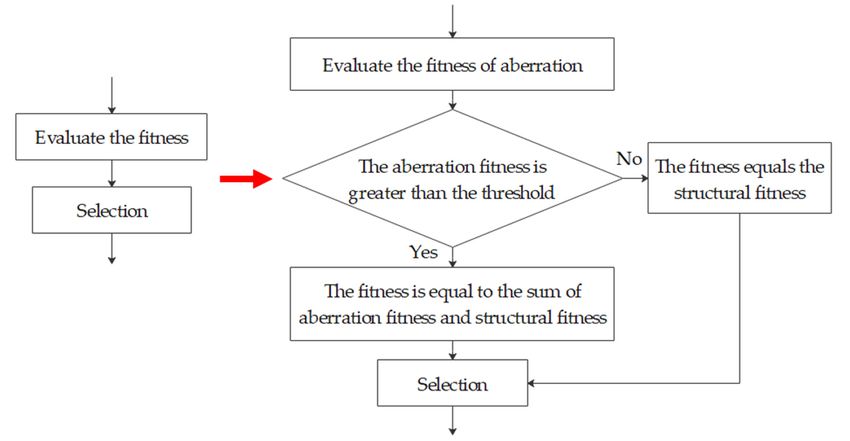
Appl. Sci. 2020, 10, 5387                                                                                                     7 of 17

       Based on the analyses of the manufacturing constraints, aberrations and the structure configuration
in the previous section, the objective function was established.
       The objective function of aberrations is composed of weighted aberrations which can be expressed
as fa ,
              fa = fa (wi , α1 , α2 , β1 , β2 , k1 , k2 , k4 ) = w1 |S1 | + w2 |S2 | + w3 |S3 | + w4 |S4 | + w5 |S5 |, (10)

where wi (i = 1, 2 . . . 5) is the weight of the corresponding term. The weight given to each term depends
on its importance in the system. The higher weight values are set to the aberration coefficients with
high requirements and vice versa.
     According to Equation (10), the objective function fa is a comprehensive reflection of the aberration
in the optical system. The smaller fa value indicates a better imaging quality of the optical system.
     The objective function of manufacturing and structural constraints fc consists of the ADRS, the tool
spindle path C and some other structural constraints O, such as the obscuration elimination and
telecentric in the image space, are as follows:

                      fc = fc (wi , α1 , α2 , β1 , β2 , k1 , k2 , k4 , d2 , θ3 ) = w6 |σADRS | + w7 |C| + wi |O|,              (11)

where d2 and θ3 are the additional variables added for structure control.
     The manufacturing and structural constraints function fc and imaging quality constraints function
fa constitute the objective function F:
                                             F = fa + fc .                                        (12)
     Appl. Sci. 2020, 10, x FOR PEER REVIEW                                                                         8 of 18
      By establishing the objective function, the problem of solving the initial structural parameters
of the four-mirror     optical
          By establishing       system
                          the objective    is transformed
                                         function, the probleminto   the optimization
                                                                of solving                  of the
                                                                           the initial structural    objectiveof function F.
                                                                                                  parameters
     the four-mirror optical system  is transformed   into the optimization  of the objective
The small value of aberration coefficients, ADRS and tool spindle path C will be obtained      function   F . by
                                                                                                              Theminimizing
     small value of aberration coefficients, ADRS and tool spindle path C will be obtained by
F. In this paper, GA is introduced to optimize the objective function, that is, GA is introduced to solve
     minimizing F . In this paper, GA is introduced to optimize the objective function, that is, GA is
the parameters    of the initial structure.
     introduced to solve the parameters of the initial structure.
      TheThe
           optimization
              optimizationprocess    ofGA
                            process of    GAisisshown
                                                  shown   in Figure
                                                       in Figure      6, which
                                                                 6, which        is briefly
                                                                          is briefly describeddescribed
                                                                                                 as follows:as follows:

                                Figure 6. Flowchart of the genetic algorithm (GA) process.
                               Figure 6. Flowchart of the genetic algorithm (GA) process.
          Step 1: Encode the parameters and initialize the population. Encoding is the basis of GA, and the
     encoding mechanism has an essential influence on the performance and efficiency of the algorithm.
     In this paper, binary is used to encode the parameters [29]. First, convert parameters α1 , α2 , β1 , β2 ,
      k1 , k2 , k4 , d 2 , and θ3 from decimal numbers to binary numbers. The sequence of 9 parameters
     represents a chromosome, which is a solution of the objective function. Each generation consists of a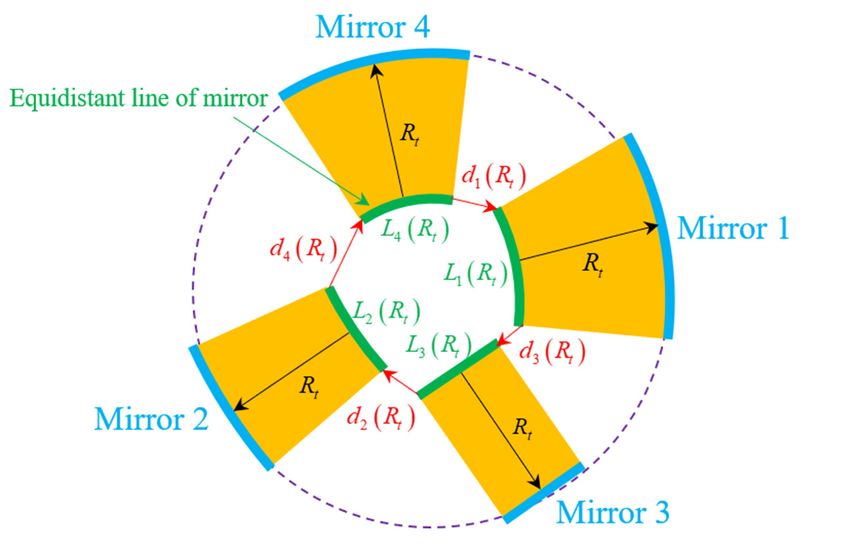
Appl. Sci. 2020, 10, 5387                                                                                                            8 of 17

       Step 1: Encode the parameters and initialize the population. Encoding is the basis of GA, and the
encoding mechanism has an essential influence on the performance and efficiency of the algorithm.
In this paper, binary is used to encode the parameters [29]. First, convert parameters α1 , α2 , β1 , β2 , k1 ,
k2 , k4 , d2 , and θ3 from decimal numbers to binary numbers. The sequence of 9 parameters represents
a chromosome, which is a solution of the objective function. Each generation consists of a certain
amount of chromosomes, and the population size is set empirically. Then, the initial population of GA
is formed by randomly generating multiple chromosomes.
       Step 2: Evaluate the fitness. The reciprocal of the objective function is used as the fitness function to
calculate the fitness of each chromosome in the population. The value of fitness is the main performance
index to describe the performance of an individual in GA. The larger fitness value indicates a good
individual’s performance and vice versa.
       Step 3: Selection. Once the fitness is calculated, several pairs of chromosomes were selected as
parents for breeding. The chromosome with a larger value of fitness has a higher selection probability.
       Step 4: Crossover. Crossover is the operator that allows selected chromosomes to exchange some
genes with the crossover probability pc , which is an important means to obtain excellent individuals
              Appl. Sci. 2020, 10, x FOR PEER REVIEW                                                                          9 of 18
in GA. The pc is set between 0.8 and 1.0. In binary coding, crossover methods include single point
                 GA. The pccrossover
crossover,intwo-point                          and 0.8
                                    is set between   multi-point
                                                         and 1.0. In crossover.
                                                                     binary coding, crossover methods include single point
       Stepcrossover,
                5: Mutation.two-point   Mutation
                                          crossover is
                                                     andthe    operation
                                                            multi-point      of changing some genes of a chromosome to
                                                                        crossover.
                    Step   5:  Mutation.    Mutation   is
form new individuals with a certain probability (mutation  the operation  of  changing   some genes ofFor
                                                                                      probability).      a chromosome
                                                                                                              the mutation to form
                                                                                                                                in binary,
              new    individuals      with  a certain probability   (mutation     probability).
the chromosomes are mutated at one point selected randomly. The mutation of bit is the inversion For the mutation   in  binary,  the     of
              chromosomes are mutated at one point selected randomly. The mutation of bit is the inversion of bit:
bit: 0 becomes 1 or 1 becomes 0. In GA, mutation is employed to avoid converging to local minima.
              0 becomes 1 or 1 becomes 0. In GA, mutation is employed to avoid converging to local minima. The
The mutation  mutationprobability
                           probability  pm pis approximately       0.01.
                                             m is approximately 0.01.
       Step 6: AfterStep 6: After finishing the process of crossoverand
                            finishing      the process     of  crossover      andmutation      operations,
                                                                                   mutation operations,    somesome
                                                                                                                 newnew     individuals
                                                                                                                       individuals
are produced          to join the
              are produced             surviving
                                 to join            individuals
                                          the surviving             so so
                                                          individuals   asastotoform
                                                                                 formaa new     generation.
                                                                                         new generation.
                    Step 7: Termination
       Step 7: Termination                      conditions.
                                       conditions.             The termination
                                                      The termination              condition
                                                                             condition         is usually
                                                                                          is usually        setthe
                                                                                                       set as   as maximum
                                                                                                                   the maximum    number
of generationsnumber   orofnogenerations
                                obvious or     no obvious
                                             changes         changes
                                                        in the   valueinof
                                                                         thethevalue of the objective
                                                                                  objective   function.function.
                    Step 8: Decode and calculate the initial structure parameters α , α , β , β , k , k , k , d 2 ,
       Step 8: Decode and calculate the initial structure parameters α11 , α22 , β11, β2 ,2 k1 ,1k2 , k2 4 , d42 , and                θ3 .
              and θ3 .
       The flow chart          of the whole design process is shown in Figure 7, which is described as follows:
                  The flow chart of the whole design process is shown in Figure 7, which is described as follows:

                                                 Figure 7. Flowchart of the design process.
                                           Figure 7. Flowchart of the design process.
                  Step 1: Establish the objective function F = f ( wi , α1 , α2 , β1 , β2 , k1 , k2 , k4 , d 2 , θ3 ) by analyzing
            the aberrations and manufacturing constraints.
                 Step 2: Set the weights and use GA to optimize the parameters ( wi , α1 , α2 , β1 , β2 , k1 , k2 , k4 , d 2 , θ3
            ) to minimize the objective function.
                 Step 3: Based on the optimized parameters in the previous step, calculate the configuration
            parameters R1 , R2 , R4 , d1 , d 3 , and d 4 .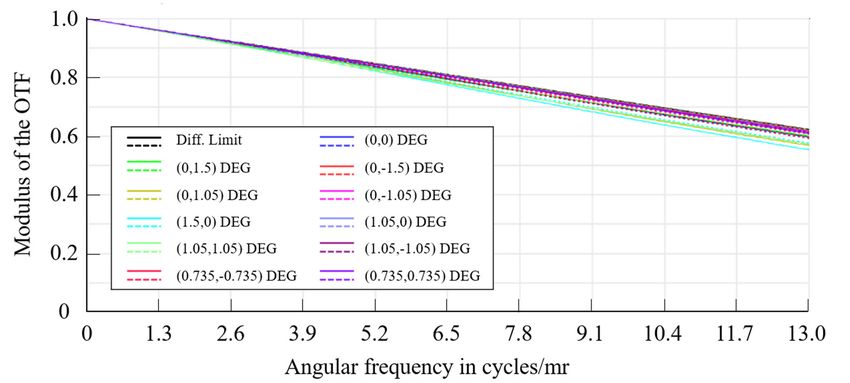
Appl. Sci. 2020, 10, 5387                                                                                                9 of 17

       Step 1: Establish the objective function F = f (wi ,α1 ,α2 ,β1 ,β2 ,k1 ,k2 ,k4 ,d2 ,θ3 ) by analyzing the
aberrations and manufacturing constraints.
       Step 2: Set the weights and use GA to optimize the parameters (wi ,α1 ,α2 ,β1 ,β2 ,k1 ,k2 ,k4 ,d2 ,θ3 ) to
minimize the objective function.
       Step 3: Based on the optimized parameters in the previous step, calculate the configuration
parameters R1 , R2 , R4 , d1 , d3 , and d4 .
       Step 4: The configuration parameters were imported for further analysis into the commercial
software, and then, the final system is obtained.
       In this study, the objective function consists of two parts: the aberration constraints and
theAppl.
      manufacturing
         Sci. 2020, 10, x FORconstraints,
                               PEER REVIEW in which the calculation of manufacturing constraints10isof very                18
time-consuming because of the ray tracing. This phenomenon is more obvious when the population
size and Intheorder   to solve
                  number      ofthis problem,
                                 iterations      here we propose a strategy to speed up the calculation. The fitness
                                              is large.
   calculation     process    of  the GA   is improved
       In order to solve this problem, here we propose      as showna in    the flow
                                                                         strategy  to chart
                                                                                      speedinupFigure 8. In this improved
                                                                                                 the calculation.   The fitness
   strategy, the aberration constraints f a is first calculated instead of the objective function F , and
calculation process of the GA is improved as shown in the flow chart in Figure 8. In this improved
   then the    value     of f a is  comparedfwith       the threshold. The inferior/poor individuals will directly use
strategy,   the   aberration     constraints     a is first calculated instead of the objective function F, and then the
            −1
   the off a fa is
value           ascompared
                     the fitnesswithto implement
                                        the threshold. the The
                                                             selection   operationindividuals
                                                                  inferior/poor      without calculating       use the fa−1 as
                                                                                                           manufacturing
                                                                                                will directly
                                                                      −1
theconstraints       f c ; As for the
     fitness to implement          the excellent
                                       selectionindividuals,        fc will
                                                    operation without        calculating  manufacturing
                                                                               be calculated  and added to    f a−1 to make
                                                                                                           constraints    fc ; As
forthem
    the excellent        individuals,   f −1  will  be  calculated   and   added   to f −1 to make  them  more     competitive,
           more competitive, which       c     is more like an incentive process.       a As the iteration goes on, the
which    is moreoflike
   proportion               an incentive
                        individuals   with process.      As the iteration
                                             small aberrations     and good   goes on, theconfigurations
                                                                                structural  proportion of will
                                                                                                           individuals
                                                                                                                 increase with
                                                                                                                           in
small   aberrations and good structural configurations will increase in the population.
   the population.

                                     Figure 8. Improvement of the fitness calculation.
                                    Figure 8. Improvement of the fitness calculation.

3. 3. DesignApproach
   Design    Approach

    InIn this
       this    section,an
             section,   anoff-axis
                           off-axisfour-mirror
                                    four-mirror afocal reflective
                                                       reflectivesystem,
                                                                   system,which
                                                                           whichisissatisfying manufacturing
                                                                                      satisfying manufacturing
  constraints,
constraints, is ispresented
                   presentedasasan
                                 anexample.
                                    example. Table
                                             Table 1 shows thethe specification
                                                                  specificationofofthe
                                                                                    thesystem.
                                                                                         system.

                             Table1.1.Specification
                            Table      Specification of the off-axis
                                                            off-axis four-mirror
                                                                     four-mirroroptical
                                                                                 opticalsystem.
                                                                                         system.

                                            Parameter
                                       Parameter               Specification
                                                                     Specification
                               Entrance pupil diameter/mm           170
                        Entrance pupil diameter/mm                        170
                                  Exitdiameter/mm
                          Exit pupil   pupil diameter/mm             34 34
                               Field ofField of◦ )view/(°)
                                        view/(                      3 × 33 × 3
                                       Wavelength/nm
                               Wavelength/nm                      650~900
                                                                        650~900
                             Compression     ratio ratio
                                     Compression                      5    5
        According to the method proposed in Section 2, the GA program is written to calculate the initial
   structural parameters of the off-axis four-mirror system. The main parameters of GA are the
   population size n = 50, pc = 0.9, pm = 0.01, and evolutionary generations are 200.
       The objective function is composed of primary aberration coefficients and structural layout
   constraints with weights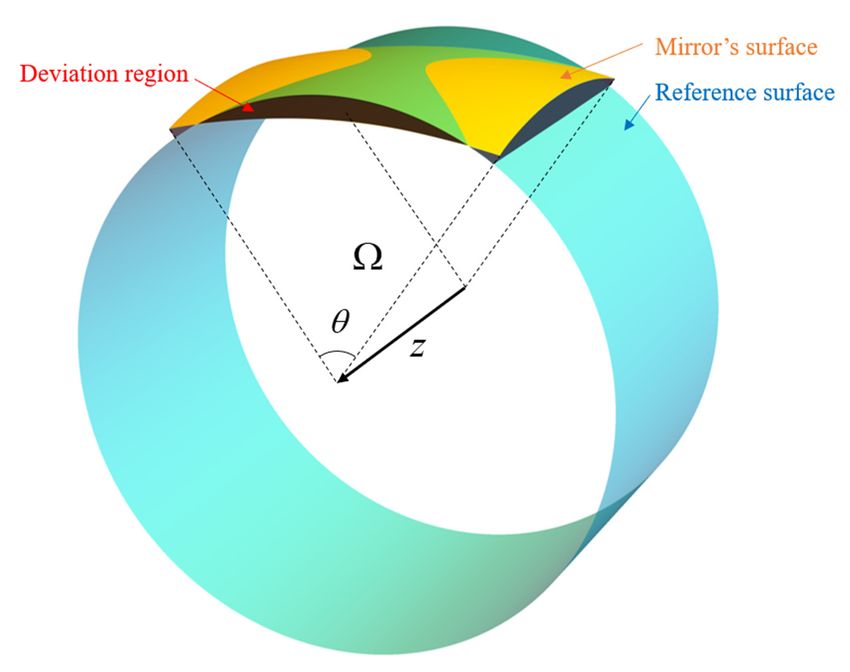
Appl. Sci. 2020, 10, 5387 10 of 17
According to the method proposed in Section 2, the GA program is written to calculate the initial
structural parameters of the off-axis four-mirror system. The main parameters of GA are the population
size n = 50, pc = 0.9, pm = 0.01, and evolutionary generations are 200.
The objective function is composed of primary aberration coefficients and structural layout
constraints with weights
F = f (wi , α1 , α2 , β1 , β2 , k1 , k2 , k4 , d2 , θ3 )
(13)
= w1 |S1 | + w2 |S2 | + w3 |S3 | + w4 |S4 | + w5 |S5 | + w6 |σADRS | + w7 |C| + wi |O|.
Appl. Sci. 2020, 10, x FOR PEER REVIEW 11 of 18
Certain conditions are set to obtain reasonable initial structural parameters: α1 > 0, α2 < 0, β1 < 0
and β2 > 0. In this case,
Certain we know
conditions that
are set tothere
obtainisreasonable
an intermediate image plane
initial structural α1 > 0, α2In 0.
toIn
satisfy some
this case, weboundary
know thatconditions, which are shown
there is an intermediate in Table
image plane 2. structure.
in this
In addition, these parameters need to satisfy some boundary conditions, which are shown in Table 2.
Table 2. Parameters range.
Table 2. Parameters range.
Parameter α1 α2 β1 β2 k1 k2 k4 d2 (×10) θ3
d2 (45)
×10) (1.6, 2)
RangeParameter
(0, 0.5) α(−1,
1
0) α2(−5, 0) β1 (0, 5) β2 (0, 5) k1 (0, 5)k
2
(0, 5)
k 4
(42, θ3
(0, 0.5) (−1, 0) (−5, 0) (0, 5) (0, 5)
Range to the 9 parameters with ranges, GA is used to optimize the objective function F (0, 5) (0, 5) (42, 45) (1.6, 2)
According
before. to the 9 parameters with ranges, GA is used to optimize the objective function F
mentioned According
mentioned before.
Figure 9 shows the convergence curve of the objective function. The data point on the curve
Figure 9 shows the convergence curve of the objective function. The data point on the curve
indicates the elitist individual of each generation. It can be seen that the value of the objective function
indicates the elitist individual of each generation. It can be seen that the value of the objective function
decreases as iteration times increase, and the objective function is convergent.
decreases as iteration times increase, and the objective function is convergent.
Figure 9. Convergence curve of the objective function.
Figure 9. Convergence curve of the objective function.
Multiple groups of initial structure parameters have been obtained by changing the weight. Five
Multiple groups of initial structure parameters have been obtained by changing the weight.
groups of data with the lowest convergent F values are listed in Table 3. The optimization results
Five groups of data with the lowest convergent F values are listed in Table 3. The optimization results
of each group are close, which proves the stability of the GA in dealing with optical optimization
of eachwith
group are close,
special which proves the stability of the GA in dealing with optical optimization with
requirements.
special requirements.
Table 3. Initial structures parameters obtained for the off-axis four-mirror system.
Table 3. Initial structures parameters obtained for the off-axis four-mirror system.
No. α1 α2 β1 β2 k1 k2 k4 d2 θ3
No. 1 α1 α2
0.300 β1 −2.360 β2 4.126 k1 0.867
−0.742 k4.127
2 k
0.780
4 d
438.27
2 θ3
1.89
1 20.300 0.270
−0.742 −0.661
−2.360 −2.881
4.126 4.354 0.963
0.867 3.849
4.127 0.800
0.780 430.26
438.27 1.90
1.89
2 30.270 0.275
−0.661 −0.900−2.881 −2.381
4.354 4.086 0.963
0.896 3.849
3.907 0.685
0.800 434.96
430.26 1.84
1.90
3 40.275 0.257
−0.900 −0.862−2.381 −2.456
4.086 4.094 0.896
0.876 3.907
3.484 0.733
0.685 434.43
434.96 1.87
1.84
4 50.257 −0.862 −0.856
0.293 −2.456 −2.269
4.094 4.315 0.876
0.790 3.484
2.804 0.733
0.742 434.43
436.24 1.87
1.83
5 0.293 −0.856 −2.269 4.315 0.790 2.804 0.742 436.24 1.83
According to the Equation (7), the structural parameters are calculated and listed in Table 4.
Table 4. Configuration parameters of the initial off-axis four-mirror system.
R2 ( mm) R4 ( mm)
No. R1 ( mm)
1 −1817.14 −946.21 768.66Appl. Sci. 2020, 10, 5387 11 of 17
According to the Equation (7), the structural parameters are calculated and listed in Table 4.
Table 4. Configuration parameters of the initial off-axis four-mirror system.
No. R1 (mm) R2 (mm) R4 (mm)
1 −1817.14 −946.21 768.66
2 −1742.47 −720.60 728.13
Appl. Sci. 2020, 10, x FOR PEER REVIEW
3 −1764.08 −810.99 810.15 12 of 18
4 −1711.21 −740.85 747.52
5 4 −1791.55
−1711.21 −928.71
−740.85 819.44
747.52
5 −1791.55 −928.71 819.44
A larger α1 value can make the optical system structure more compact, so the first structure in
A larger α1 value can make the optical system structure more compact, so the first structure in
Table 3 is selected as the initial structure for further optimization in software. The ADRS and the
Tablemaximum
3 is selected as the
deviation initial
from structuresurface
the reference for further optimization
of each mirror in theininitial
software. Theare
structure ADRS
listedand
in the
maximum deviation
Table 5. from the reference surface of each mirror in the initial structure are listed in Table 5.
Table
Table 5. The
5. The averagedeviation
average deviation from
fromthe
thereference surface
reference (ADRS)
surface and the
(ADRS) andmaximum deviationdeviation
the maximum of each of
mirror in the initial structure.
each mirror in the initial structure.
No. M1 M2 M3 M4
No. M1 M2 M3 M4
ADRS (mm) 4.23
ADRS (mm) 4.23 5.71 5.71 8.49
8.49 3.88
3.88
Maximum deviation (mm) 13.74 11.40 15.54 4.11
Maximum deviation (mm) 13.74 11.40 15.54 4.11
Figure 10 shows
Figure thethe
10 shows layouts
layoutsof of
thetheinitial
initialafocal
afocalstructure
structure with
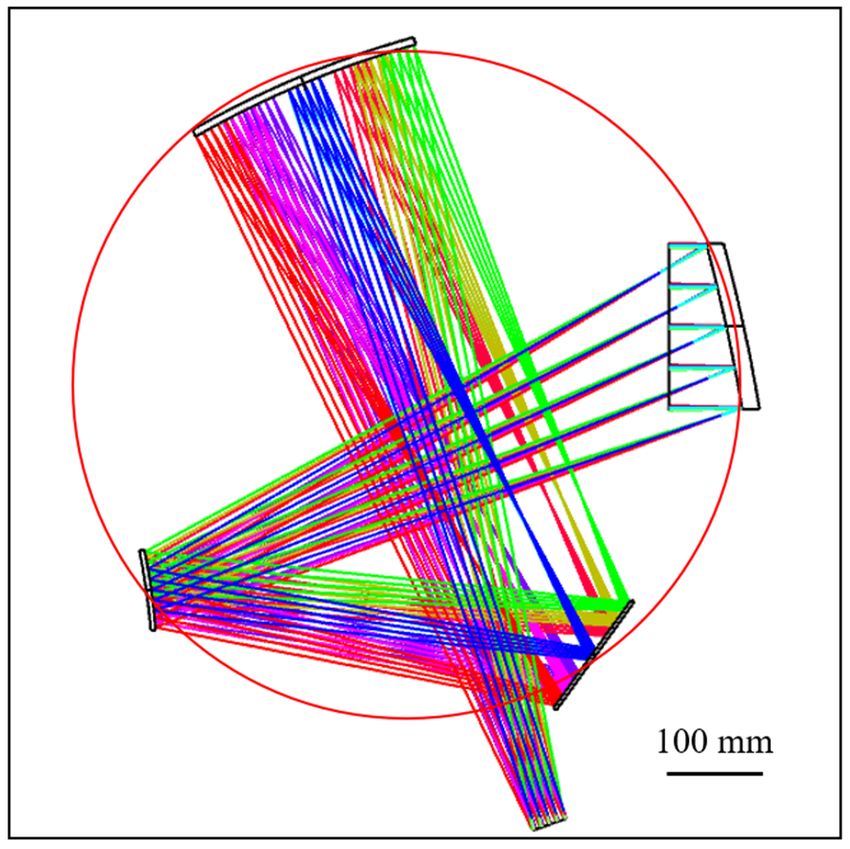
with parameters calculatedbybyGA,
parameters calculated GA, in
which the redthe
in which circle with with
red circle a radius of 337
a radius mmmm
of 337 represents
representsthethereference
referencesurface.
surface. Figure 11 shows
Figure 11 shows the
layouts
the of the structure
layouts of which
of the structure of few
whichof FOVs
few of have
FOVsbeenhaveoptimized. The modulation
been optimized. transfer
The modulation function
transfer
(MTF)function
curves (MTF)
for curves for theand
the initial initial and optimized
optimized structures
structures areare alsopresented
also presented in
inFigures
Figures12 12
andand
13, 13,
respectively. The MTF curves show that each system is close to the diffraction limit,
respectively. The MTF curves show that each system is close to the diffraction limit, indicating that indicating that the
initial structure
the initial structure obtained
obtained from
from GAGA is aisgood starting
a good pointpoint
starting for further optimization.
for further optimization.
Figure 10.10.
Figure Initial structure
Initial structurelayout
layout of theoff-axis
of the off-axisfour-mirror
four-mirror system.
system.Appl. Sci. 2020, 10, x FOR PEER REVIEW 13 of 18
Appl. Sci. 2020, 10, 5387 12 of 17
Appl.
Appl.Sci.
Sci.2020,
2020,10,
10,xxFOR
FORPEER
PEER REVIEW
REVIEW 13
13 of
of18
18
Figure 11. Optimized structure layout of the off-axis four-mirror system.
Figure
Figure 11.
11. Optimized
Optimized structure
structure layout
layout of
of the
the off-axis four-mirror
off-axis four-mirror system.
four-mirrorsystem.
system.
Figure 11. Optimized structure layout of the off-axis
Figure 12.12.
Figure
Figure
Figure Initial
12.
12. structure
Initial
Initial structuremodulation
structure modulation transfer
modulation transfer
transfer function(MTF)
transfer function
function
function (MTF)
(MTF)
(MTF) of of
of
of thethe
the
the off-axis
off-axis
off-axis
off-axis four-mirror
four-mirror
four-mirror
four-mirror system.
system.
system.
system.
Figure
Figure 13.
13. Optimized
Optimized structure
structure MTF
MTF of
of the
the off-axis
off-axis four-mirror
four-mirror system.
system.
Figure
Figure13.
13.Optimized
Optimizedstructure MTFofofthe
structure MTF theoff-axis
off-axis four-mirror
four-mirror system.
system.
The
The configuration
configuration parameters
parameters of of the
the optimized
optimized structure
structure areare presented
presented inin Table
Table 6.
6. After
After further
further
optimization,
optimization, the
the structural
structural parameters
parameters are are still
still close
close to
to the
the initial
initial structure,
structure, which
which proves
proves that
that itit is
is
The configuration
feasible to use GA to
parameters
find the
ofstructure
initial
the optimized
with
structure
special
are presented in Table 6. After further
requirements.
feasible to use GA to find the initial structure with special requirements.
optimization, the structural parameters are still close to the initial structure, which proves that it is
feasible to use GA to find
Table
Table 6. the initial parameters
6. Configuration
Configuration structure of
parameters with
of the special requirements.
the optimized
optimized off-axis
off-axis four-mirror
four-mirror system.
system.
Table 6. Configuration parameters of the optimized off-axis four-mirror system.Appl. Sci. 2020, 10, 5387 13 of 17
The configuration parameters of the optimized structure are presented in Table 6. After further
optimization, the structural parameters are still close to the initial structure, which proves that it is
feasible to use GA to find the initial structure with special requirements.
Table 6. Configuration parameters of the optimized off-axis four-mirror system.
Mirror R (mm) d (mm) Conic
Primary −1947.38 −636.00 1.020
Secondary −865.21 438.27 4.297
Quaternary 964.89 820.00 0.942
In the next step, the freeform surface is introduced to further improve the imaging quality [30].
The freeform surface is a category of non-rotational symmetric surfaces. Compared with the
traditional optical surface such as spherical and aspheric surfaces, it has a stronger ability to correct
aberrations. With the development of manufacturing technology, freeform surfaces are more and more
used in illumination and imaging systems.
In this structure, we choose the Zernike polynomial surface to optimize the mirrors [31]. Zernike
polynomials can correspond to Seidel aberration coefficients in optical design.
The Zernike polynomial surface is composed of the conical surface and additional aspheric terms
defined by the Zernike polynomial coefficients. The Fringe ordering of the Zernike polynomials is
chosen, with sag described mathematically by
N
cr2 X
z= p + Ci Zi (ρ, ϕ), (14)
1+ 1 − (1 + k)c2 r2 i=1
where c is the curvature of the base sphere, r is the radial coordinate of the surface, k is the conic
constant, ρ is the radial coordinate of the surface normalized by Rnorm , (that is, ρ = r/Rnorm ), ϕ is the
azimuthal component of the surface aperture, and Ci is the weight factor of the ith Zernike term,Zi .
After setting the tertiary mirror to the Zernike surface, the Aspheric surface high-order coefficients
and Zernike coefficients of the tertiary mirror are shown in Table 7, and the configuration parameters
of the final off-axis four-mirror system are shown in Table 8.
Table 7. Aspheric surface high-order coefficients and Zernike coefficients of the tertiary mirror.
Fourth Order Sixth Order Zernike Third Zernike Fifth
Mirror
Coefficient Coefficient Coefficient Coefficient
Tertiary −1.810 × 10⁻¹⁰ −7.727 × 10⁻¹⁵ 6.6 × 10⁻⁴ −1.506×10⁻⁵
Table 8. Configuration parameters of the final off-axis four-mirror system.
Mirror R (mm) d (mm) Conic Fourth Order Coefficient Sixth Order Coefficient
Primary −1682.54 −636.00 1.003 −1.039 × 10⁻¹³ −5.334 × 10⁻²⁰
Secondary −615.69 438.27 4.039 −2.681 × 10⁻¹¹ −1.514 × 10⁻¹⁶
Quaternary 1009.27 820.00 0.986 −4.901 × 10⁻¹² −1.796 × 10⁻¹⁷
The final structure layout of the off-axis four-mirror system is shown in Figure 14, in which
the rays tracing of all FOVs are plotted with different colors. All mirrors in the final structure are
distributed approximately along a cylinder.Appl. Sci. 2020, 10, 5387 14 of 17
Appl. Sci. 2020, 10, x FOR PEER REVIEW 15 of 18
Appl. Sci. 2020, 10, x FOR PEER REVIEW 15 of 18
Figure 14.
Figure 14. Final
Final structure
structure layout
layout of
of the
the off-axis
off-axis four-mirror
four-mirrorsystem.
system.
Figure 14. Final structure layout of the off-axis four-mirror system.
The ADRS
The ADRS and and the
the maximum
maximum deviation
deviation from
from the
the reference
reference surface
surface of
of each
each mirror
mirror in
in the
the final
final
The
structure ADRS
structure are and
are listed
listed in the maximum
in Table
Table9.9. The deviation
The ADRS
ADRS valuesfrom the
values show reference
show that surface
that mirrors
mirrors in of
in the each
the systemmirror
system are in
are close the
close totofinal
the
the
structuresurface.
reference
reference are listed in Table 9. The ADRS values show that mirrors in the system are close to the
surface.
reference surface.
Table 9. The
Table9. The ADRS
ADRS and
and the
the maximum
maximum deviation
deviation of
of each
each mirror
mirrorin
inthe
thefinal
finalstructure.
structure.
Table 9. The ADRS and the maximum deviation of each mirror in the final structure.
No.
No. M1 M1 M2 M2 M3 M3 M4 M4
ADRS (mm)
No. M1 M2
4.78 4.78 5.16 5.16 7.34 7.34
M3 M4
3.423.42
ADRS (mm)
MaximumADRS (mm)
deviation (mm) 13.08 4.78 13.75 5.16 14.05 7.34 5.18 3.42
Maximum deviation (mm) 13.08 13.75 14.05 5.18
Maximum deviation (mm) 13.08 13.75 14.05 5.18
The
The modulation
modulation transfer
transfer function
function (MTF)
(MTF) of the
of the system
the system
system isis shown
is shown in
shown in Figure
inFigure 15.
15.The
Figure15. TheMTFs at at
MTFs 13
The
cycles/mr modulation
are above 0.6transfer function (MTF) of The MTFs at 13
13 cycles/mr
cycles/mr are
are above
above 0.6for
0.6 forall
for allFOVs,
all FOVs,which
FOVs, whichindicates
which indicatesthat
indicates thatthe
that thesystem
the systemhas
system hasaaagood
has goodoptical
good optical performance.
optical performance.
performance.
Figure 15. Final structure MTF of the off-axis four-mirror system.
Figure15.
Figure 15.Final
Finalstructure
structureMTF
MTFof
ofthe
theoff-axis
off-axisfour-mirror
four-mirrorsystem.
system.
Figure 16a shows the gird distortion of the final off-axis four-mirror system. The paraxial FOV
Figure16a
grid Figure
coincides16ashows
shows
with the the
the gird
gird
actual distortion
distortion
FOV grid of the
of the finalfinal off-axis
off-axis
approximately, four-mirror
four-mirror
which system.
system.
indicates thatThe Theisparaxial
paraxial
there noFOV FOV
grid
obvious
grid coincides
coincides with with
the the
actual actual
FOV FOV
grid grid approximately,
approximately, which which
indicates indicates
that there that
is no there
distortion in the system. Figure 16b shows the F-Tan (Theta) distortion of the system. The distortion is
obvious no obvious
distortion
indistortion
increases in the
the system.
gently system.
Figure
as the16b
FOV Figure
shows 16b shows
the F-Tan
increases and the themaximum
F-Tan
(Theta) (Theta)
distortion distortion
of the is
distortion of the
system. Thesystem.
approximately The increases
distortion
0.4%. distortion
increases
gently gently
as the FOVas the FOVand
increases increases and the maximum
the maximum distortion is distortion is approximately
approximately 0.4%. 0.4%.Appl. Sci. 2020, 10, 5387 15 of 17
Appl. Sci. 2020, 10, x FOR PEER REVIEW 16 of 18
Figure
Figure 16. Distortion
16. Distortion of the of the off-axis
off-axis four-mirror
four-mirror system.
system. (a) (a) Grid (b)
Grid distortion. distortion. (b) F-Tan
F-Tan (Theta) (Theta)
distortion.
distortion.
4. Conclusions
4.The
Conclusions
introduction of manufacturing constraints in the optical design process can guarantee the
optical performance
The introductionof the of
system and facilitate
manufacturing the assembly
constraints andoptical
in the machining process,
design processwhich
can isguarantee
beneficialthe
to further
optical develop
performancethe applications
of the systemof optical systems. the assembly and machining process, which is
and facilitate
In this paper, a novel method for
beneficial to further develop the applicationsfinding the ofinitial structure
optical systems.parameters of an off-axis four-mirror
reflective system considering manufacturing constraints
In this paper, a novel method for finding the initial structure via GA is proposed. In this method,
parameters in order
of an off-axis four-
to find
mirrorthereflective
appropriate initial
system structuralmanufacturing
considering parameters, the GA is employed
constraints via GA to optimize the
is proposed. objective
In this method,
function,
in orderwhich is established
to find according
the appropriate to aberration
initial structuralanalyses
parameters,and manufacturing
the GA is employed constraints analyses.the
to optimize
Theobjective
GA is computationally
function, which efficient when finding
is established the globaltominima
according in complex,
aberration analyses highly
andnonlinear and
manufacturing
high-dimensional parameter spaces. In addition, the reasonable definition
constraints analyses. The GA is computationally efficient when finding the global minima in complex,of the objective function
andhighly
the optimization
nonlinear and strategy ensure the possibility
high-dimensional parameterofspaces. using In GAaddition,
successfully. This method
the reasonable helps of
definition
solve
thethe complex
objective opticaland
function alignment problem strategy
the optimization in optical systems.
ensure The off-axis
the possibility four mirror
of using system
GA successfully.
designed
This method helps solve the complex optical alignment problem in optical systems. The off-axis is
according to this method can be put into use without optical alignment once the machining four
completed. This method
mirror system designed is also applicable
according to off-axis
to this methodthree-mirror
can be put into systems, off-axisoptical
use without five-mirror systems
alignment once
andthecoaxial reflective
machining systems. This method is also applicable to off-axis three-mirror systems, off-axis
is completed.
five-mirror systemsthe
The feasibility of andproposed method is
coaxial reflective validated by designing an off-axis four-mirror afocal
systems.
system with an entranceofpupil
The feasibility diameter method
the proposed of 170 mm, a field of by
is validated view of 3◦ × 3an
designing
◦ , an operating wave band
off-axis four-mirror afocal
of 650~900 nm, and a compression ratio of five times, in which
system with an entrance pupil diameter of 170 mm, a field of view of 3° × 3°, an all the mirrors areoperating
guaranteed to be
wave band
distributed along a cylinder 337 mm in radius to facilitate the ultraprecise raster
of 650~900 nm, and a compression ratio of five times, in which all the mirrors are guaranteed to be milling. The results
show that the optimization
distributed along a cylinder method based
337 mm in on GA can
radius providethe
to facilitate a good starting raster
ultraprecise point for the design
milling. of
The results
theshow
reflective optical system with special requirements. In the future, by integrating
that the optimization method based on GA can provide a good starting point for the design of this method with
different optical structures,
the reflective optical system a synthetic method
with special to deal withInthe
requirements. thedesign
future,ofbymanufacturing-constrained
integrating this method with
optical systems can be obtained.
different optical structures, a synthetic method to deal with the design of manufacturing-constrained
optical systems can be obtained.
Author Contributions: Conceptualization, Z.L. and F.F.; methodology, R.L.; software, R.L.; validation, R.L.; formal
analysis,
AuthorR.L. and Z.L.; investigation,
Contributions: R.L., Z.L. and
Conceptualization, Z.L.;Y.D.; resources, F.F.;
methodology, R.L.;data curation,
software, R.L.;
R.L.; writing—original
validation, R.L.; formal
draft preparation, R.L.; writing—review and editing, R.L., Z.L., Y.D. and F.F.; visualization, R.L.; supervision, F.F.;
analysis, R.L. and Z.L.; investigation, R.L., Z.L. and Y.D.; resources, F.F.; data curation, R.L.; writing—original
project administration, F.F.; funding acquisition, F.F. All authors have read and agreed to the published version of
the draft preparation, R.L.; writing—review and editing, R.L., Z.L., and Y.D.; visualization, R.L.; supervision, F.F.;
manuscript.
project administration,
Funding: This research was F.F.; funding
funded acquisition,
by the NationalF.F.
KeyAll authorsand
Research have read and agreed
Development to theofpublished
Program version
China (Grant
No.of2017YFA0701200),
the manuscript. the Postdoctoral Innovative Talent Support Program of China (BX20190230), the National
Natural Science Foundation (No. 61635008), and the “111” project conducted by the State Administration of
Funding:
Foreign This
Experts research
Affairs andwas funded by
the Ministry of the National
Education of Key
ChinaResearch and Development Program of China (Grant
(No. B07014)
No. 2017YFA0701200), the Postdoctoral Innovative Talent Support Program of China (BX20190230), the National
Natural Science Foundation (No. 61635008), and the “111” project conducted by the State Administration of
Foreign Experts Affairs and the Ministry of Education of China (No. B07014)You can also read


