VALIDATION AND DETERMINATION OF LOSARTAN POTASSIUM USING ATTENUATION OF INCIDENT BEAM OF LIGHT BY FLOW INJECTION TECHNIQUE
←
→
Page content transcription
If your browser does not render page correctly, please read the page content below
Turkish Journal of Physiotherapy and Rehabilitation; 32(3)
                                                                 ISSN 2651-4451 | e-ISSN 2651-446X

 VALIDATION AND DETERMINATION OF LOSARTAN POTASSIUM USING
  ATTENUATION OF INCIDENT BEAM OF LIGHT BY FLOW INJECTION
                        TECHNIQUE

                                Ali Hussein Dneef, Mohammad K. Hammond
               University of Baghdad, College of Science, Department of Chemistry, Baghdad-Iraq

                                                    ABSTRACT

    An improved turbidimetric-flow injection technique for the measurement of Losartan potassium in both pure
    and pharmaceutical formulations has been developed. The technique is simple, sensitive, and quick. It is based
    on the production of a white precipitate in a potassium nitrate medium through oxidation of Losartan
    potassium-by-potassium persulfate. This precipitate was found utilizing a handmade Ayah 6SX1-T-2D Solar
    cell-CFI Analyzer with incident light attenuation measurements taken from the precipitated particles to
    estimate the Ayah 6SX1-T-2D coating concentration. Parameters concerning the chemical and physical aspects
    of the process were analyzed and optimized. The calibration graph was linear from 0.7 to 2.7 mMol L-1, with
    correlation value r = 0.9903. The limit of detection (S/N=3) is 0.7mg/270 µL, and the RSD is lower than 1%
    for the concentration of LOS at 0.8 and 2.3 mmol L-1 (six replicates). Los in three distinct pharmaceutical
    medication production facilities was determined using the technique. It was discovered that at the confidence
    level of 95%, the newly developed method analysis was not significantly different from the conventional
    method analysis (UV-Spectrophotometry at λ max 235 nm for turbidity measurement) employing the standard
    addition method with the use of t-test and F-test.

                                               I.    INTRODUCTION
Losartan potassium belongs to a group of drugs called angiotensin II receptor antagonists[1, 2]. It keeps blood
vessels from narrowing, which lowers blood pressure and improves blood flow[3]. Losartan is used to treat high
blood pressure (hypertension)[4]. It is also used to lower the risk of stroke in certain people with heart disease[5,
6]. Losartan is used to slow long-term kidney damage in people with type 2 diabetes who also have high blood
pressure [7-10]. it is chemically described as 2-butyl-4-chloro-1-[p-(o-1H-tetrazole-5-ylphenyl)benzyl]imidazole5-
methanol monopotassium salt. Its empirical formula is C22H22ClKN6O.

Losartan potassium is a white to off-white free-flowing crystalline powder with a molecular weight of 461.01. It is
freely soluble in water, soluble in alcohols, and slightly soluble in common organic solvents, such as acetonitrile
and methyl ethyl ketone [11, 12]. Oxidation of the 5-hydroxymethyl group on the imidazole ring results in the
active metabolite of losartan potassium is a white to off-white free-flowing crystalline powder with a molecular
weight of 461.01gm/mol[13].

www.turkjphysiotherrehabil.org                                                                               9994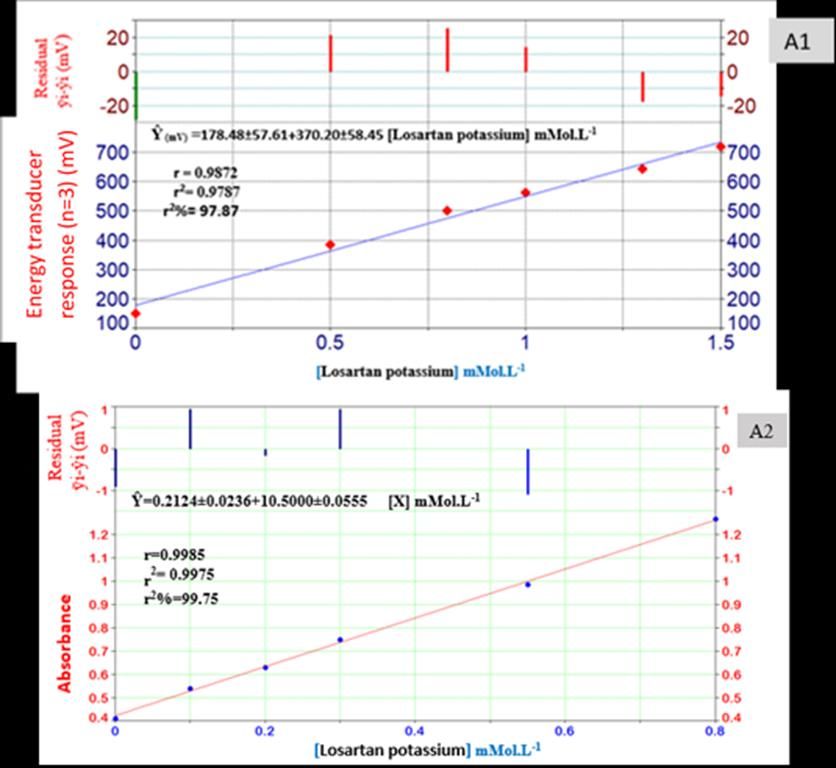
Turkish Journal of Physiotherapy and Rehabilitation; 32(3)
                                                                 ISSN 2651-4451 | e-ISSN 2651-446X

Scheme (1): chemical structure of Losartan potassium.

To promote the sensitivity, accuracy, and simple of an analytical method, flow injection technique

Joined with turbidity. In this research, the developed methods were depended on the measurement of turbidity of
(LOS) and potassium persulfate as reagent via the addition of (LOS) and potassium nitrate. The intensity of
turbidity is measured by a locally made Homemade Ayah 6SX1-T-2D solar cell CFI Analyzer joined with a flow
injection technique [14-25].

Reagents and Chemicals
All chemicals used in this were of analytical grade and distilled water was used in all dilution processes. A standard
solution of potassium persulfate (K2S2O8, 270.32 g.mol-1, 5 mMol.L-1); (potassium nitrate, 101.103g.mol-1, 50
mol.L-1) was prepared by dissolving 0.1351 g and 0.5055 g in 100 ml distilled water.

A stock solution of Losartan potassium (C22H22ClKN6O, 461.01g.mol -1, 2mMol.L-1) was prepared by dissolving
0.1844 g in 10 ml Ethanol then completed to 200 ml with distilled water and kept solution in the volumetric flask

Apparatus
Ismatec, Switzerland: Peristaltic pumps have two channels with various speed variables. IDEX Corporation, USA:
A rotary 6-port medium pressure injection valve (IDEX) with a sampling loop (0.7mm i.d. Teflon, different length)
To test the response, the Ayah 6 SX1-T-2D Solar cell-CFI Analyser, which utilizes six snow-white LEDs, was
used. For collecting signals from a sample path that was 60 mm long, two solar cells were used. In the measurement
of the system consisting of an x-t potentiometric recorder (Kompenso Graph C-1032) from Siemens (Germany) (1-
500 volts, 1-500 mV) and digital AVO-meter (auto range) (0-2 volts), the readout is given by x-t potentiometric
recorder Siemens (Germany) (1-500 volts, 1-500 mV) (China) Shimadzu UV-Vis Spectrophotometer model UV-
1800 (Japan) for scanning the absorption spectrum.

                Figure (1): Two-line manifold system design for LOS determination as an injected sample

www.turkjphysiotherrehabil.org                                                                                9995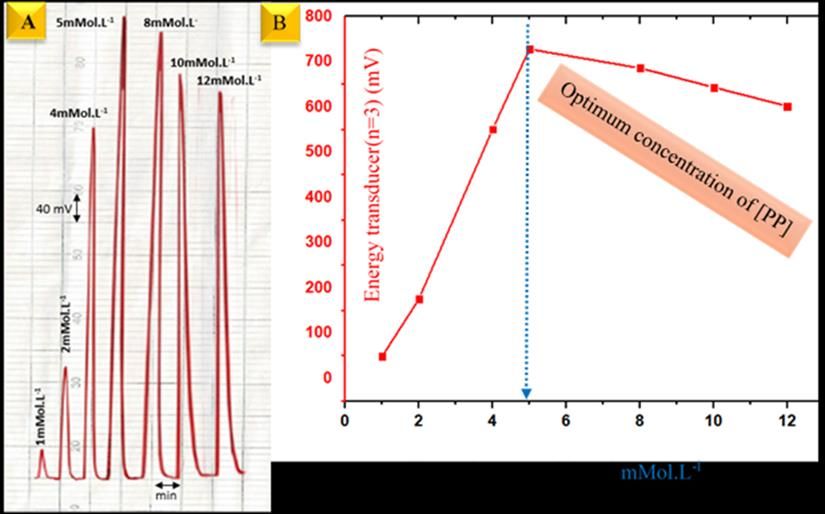
Turkish Journal of Physiotherapy and Rehabilitation; 32(3)
                                                                 ISSN 2651-4451 | e-ISSN 2651-446X

                                              II.    METHODOLOGY
Reaction of Losartan potassium with potassium persulfate forms a white precipitate as oxidation. The manifold
system used as shown in Figure.2 that is composed of two lines. The first line at a flow rate of 1.9 ml.min -1 show
the carrier stream ( potassium nitrate ) passing through the injection valve to carry the sample segment (Losartan
potassium ,100 µL of 2 mMol.L-1 ) to meet the potassium persulfate (5 mMol.L-1 ) carried by the second line (2
mL .min-1 ) at a Y-junction point before it is introduced to the CFI Analyzer .Each solution injected was assayed
in triplicate .The response profile of which was recorded on x-t potentiometric recorder to measure energy
transducer recorded when the applied voltage for the six snow white LEDs was 2 volt DC. Scheme.1 shows a
response expressed as peak height in mV by attention of incident light at 0-180°. The profile was proposed
mechanism for the reaction LOS – [K2S2O8] in aqueous medium.

Scheme.2: A probable proposed mechanism for the reaction of LOS – [K2S2O8]

Results and Discussion
The chemical and physical parameters such as Losartan potassium and potassium persulfate concentrations and
salt medium as well as the physical parameters like delay coil studied, sample volume, flow rate were examined
employing two-line manifold system as shown in Figure (1).

Chemical Variables
Study the reagent and selected the best concentration as well as the medium type and the best of the medium.

Potassium Persulfate (pp) Concentration
A series of potassium persulfate solutions (1-15 mMol.L-1) were prepared, using preliminary trial sample volume
of 170 µL, a reagent stream of potassium persulfate and carrier stream distal water at flow rate 2, 1.9 ml.min -1 of
reagent stream and carrier stream respectively. Each measurement was repeated for three times . The results
obtained are summarized in Table 4.2 and Figure. 4.2 A, B. It was found that 5 mMol.L-1 of K2S2O8 was the most
suitable for a maximum reflection of incident light and was used in all subsequent experiments, more than 5
mMol.L-1 mostly causing accumulation of precipitate particles in front of the detector which in turn to a decrease
in reflecting surface , this results in a decrease of peak height.

Table (4-2): Effect of (PP) concentration on the measurement of energy transducer response by reflection of
incident light for the determination of LOS.

www.turkjphysiotherrehabil.org                                                                              9996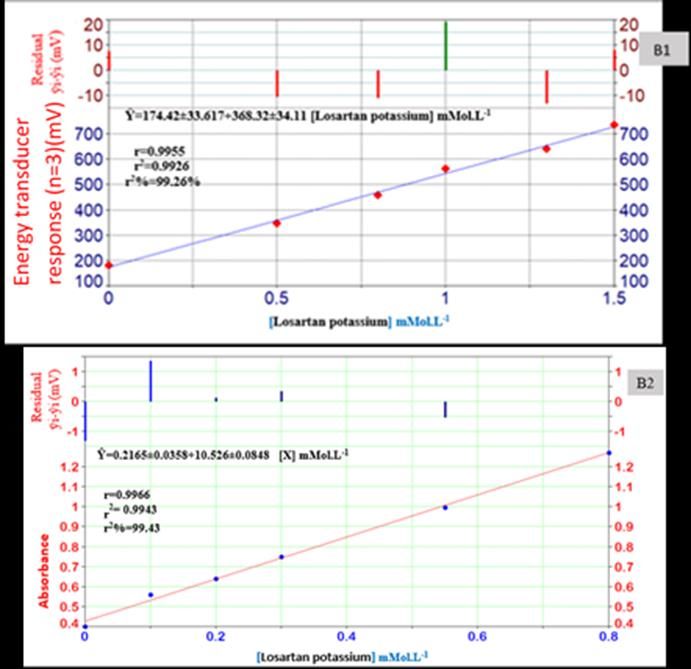
Turkish Journal of Physiotherapy and Rehabilitation; 32(3)
                                                                    ISSN 2651-4451 | e-ISSN 2651-446X

     [K2S2O8 ]            Average response                                                  Confidence interval At 95%
                                                          σn-1             RSD%
     mMol.L-1               (n=3) (mV)                                                          y̅i± t0.05/2,n-1 σn-1/√n

         1                       49.33                   1.15          2.34                          49.33±2.87

         2                      175.67                   1.15          0.65                         175.67±2.87

         4                      551.00                   1.73          0.31                           551±4.31

         5                      728.00                   2.00          0.27                           728±4.97

         8                      686.00                   2.00          0.29                           686±4.97

         10                     643.67                   1.52          0.23                         643.67±3.79

         12                     602.00                   2.00          0.33                           602±4.97

    Figure (4-2) A: Response profile for potassium persulfate at different concentration with Energy transducer response
     expressed an average peak heights (n=3) y̅i (mV) B: Relation of precipitating reagent in different concentration on
                                                   precipitation of LOS

                   III.    EFFECT OF DIFFERENT ELECTROLYTE ON THE LOS PP SYSTEM
The effect of medium on the precipitation system LOS-PP to determination of LOS was study. The study were
tested different salts such sodium chloride, ammonium chloride, potassium bromide and potassium nitrate. The
salts are used as carrier streams with 50 mMol.L-1at 1.9ml.min-1.The obtained results were tabulated in table (4.3)
while Figure (4.3) showed the potassium nitrate gave the best and more sensitivity response profile.

                   Table (4-3): Effect the different salts on height response for the determination of LOS.

                                                     Average                                         Confidence interval
                             Con. of salt                                               RSD               At 95%
     Type The salt                                response (n=3)            σn-1
                              mMol.L-1                                                   %
                                                      (mV)                                           y̅i± t0.05/2,n-1 σn-1/√n

          H2O                                          320.00              0.57          0.17            320.00±1.41

         NaCl                      50                  673.00              1.00          0.14            673.00±2.48

www.turkjphysiotherrehabil.org                                                                                         9997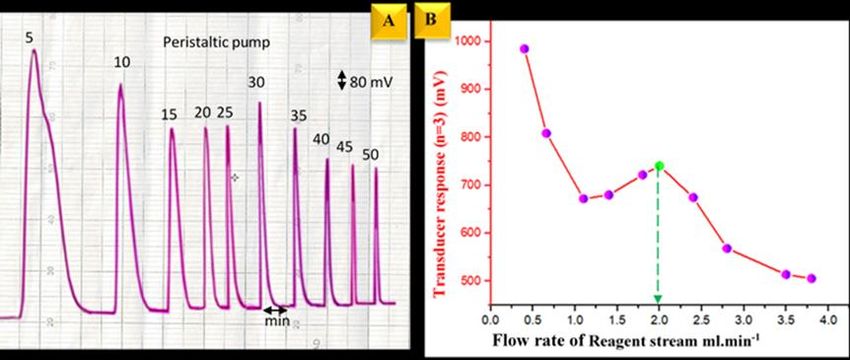
Turkish Journal of Physiotherapy and Rehabilitation; 32(3)
                                                                    ISSN 2651-4451 | e-ISSN 2651-446X

         NH4Cl                     50                  680.06              0.90         0.13             680.06±2.24

          KBr                      50                  681.33              0.57         0.08             681.33±1.43

         KNO3                      50                  800.33              1.52         0.19             800.33±3.79

     Figure (4-3): A: Response profile for different salts at same concentration with average peak heights (n=3) y̅i (mV)

Effect of potassium nitrate (PN) concentration on LOS PN system
Using 2 mMol.L-1 LOS and optimum concentration 5 mMol.L-1 of PP as well as prepare series of PN solution (10-
150 mMol.L-1) that used as a carrier stream ,220µl of sample volume at 1.9,2 ml.min-1 flow rate of carrier stream
and reagent respectively. The best concentration of PN is 50 mMol.L-1 because When the concentration is increased,
the largest size of precipitate minutes are formed and distributed well to represent the largest value of the beam,
and when the concentration is decreased, the largest size of sediment minutes is formed and these are less reflective
of the light, and even interstitial spaces are to transfer the incident light. Figure 4.4 shows the effect of potassium
nitrate concentration on height of LOS-PP system . The results obtained were summarized in Table 4.4.

                                 Table (4-4): Effect of PN concentration on LOS-PP system

      KNO3                 Average response                σn-1           RSD%            Confidence interval At 95%
    [mMol.L-1]               (n=3) (mV)
                                                                                               y̅i± t0.05/2,n-1 σn-1/√n

         10                      592.66                    1.15            0.19                    592.66±2.89

         20                      716.53                    1.36            0.18                    716.53±3.40

         30                      678.66                    4.16            0.61                   678.66±10.42

         50                      801.00                    1.00            0.12                      801±2.50

         80                      664.00                    2.00            0.30                      664±5.00

        100                      488.66                    1.15            0.23                    488.66±2.89

        150                       98.00                    2.00            2.04                      98±5.00

www.turkjphysiotherrehabil.org                                                                                            9998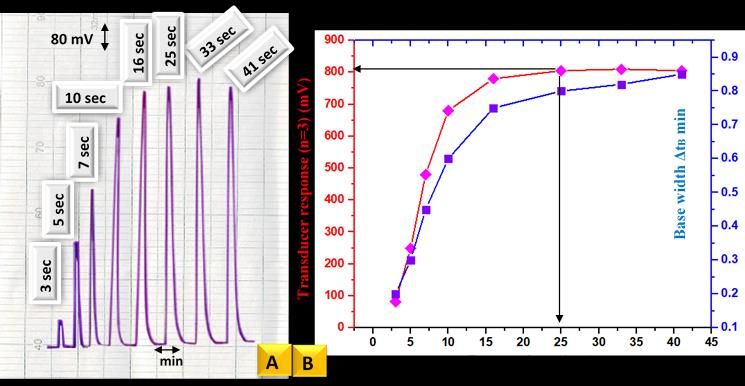
Turkish Journal of Physiotherapy and Rehabilitation; 32(3)
                                                                    ISSN 2651-4451 | e-ISSN 2651-446X

 Figure (4-4): A: Response profile for variation of PN on precipitation system for determination of LOS B: Relation of PN
             series concentration on Energy transducer response expressed average peak heights (n=3) y̅i (mV)

                                            IV.      PHYSICAL VARIABLES
Flow rate
Variation of flow rates ranged (0.4-3.8) ml.min-1 that controlled by the peristaltic pump were studied to evaluate of
flow rate on precipitation system for analysis LOS. Thus retaining another variable constant (i.e. PN 50 mMol.L-1,
PP 5 Mol.L-1 concentration), 220μl sample volume, open valve at all times, and applied voltage to the LEDs was 2
volt DC. The results obtained were summarized in Table 4.5. It can be recognized that a broad response peak occurs
at a low flow rate, an increase in peak base width (ΔtB) with little increase in peak height as shown in Fig. 4.5-A,
While at higher speed > 30 (indication approximate), although the effect of flow rate was not very crucial on the
responses. Obtaining regular response and sharp maxima, but it was not very high due to the precipitate segment
remained for a very short time in the measuring cell, therefore an indication approximate of 30 which corresponding
to a flow rate (1.9, 2) mL.min-1 carrier stream (KNO3), (K2S2O8), reagent stream were used to obtain a maximum
response and a narrower base width.

                    Table (4-5): Effect of the variation of flow rate on the energy transducer response.

                    Flow rate ml.min-1
   Peristaltic                                                                               Confidence
                                                  Average                                                           Base
     pump          Carrie                                                                  interval At 95%
                                                  response                                                          widt
   indication         r         Reagent                          σn-1       RSD%
                                                    (n=3)                                  y̅i± t0.05/2,n-1 σn-1/   h ΔtB
   approxim        stream
                                K2S2O8              (mV)                                                             min
       ate                                                                                          √n
                   KNO3

       5            0.40          0.40            984.66         1.15        0.11            984.66±2.87            3.20

       10           0.60          0.66            808.66         1.15        0.14            808.66±2.87            1.70

       15           1.00          1.10            672.00         2.00        0.29            672.00±4.97            1.00

                                                                 1.00
       20           1.36          1.40            680.00                     0.14            680.00±2.48            0.80

       25           1.60          1.80            722.00         2.00        0.27            722.00±4.97            0.70

       30           1.90          2.00            800.00         1.15        0.15            800.00±2.87            0.62

       35           2.30          2.40            674.53         0.80        0.11           674.533±2.01            0.60

www.turkjphysiotherrehabil.org                                                                                      9999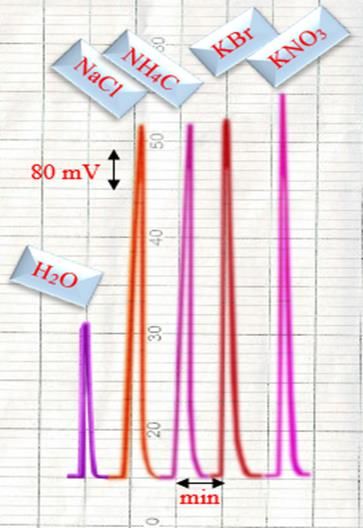
Turkish Journal of Physiotherapy and Rehabilitation; 32(3)
                                                                     ISSN 2651-4451 | e-ISSN 2651-446X

       40            2.60           2.80          568.33             1.50      0.26            568.33±3.79             0.50

       45            3.00           3.50          514.00             1.00      0.19            514.00±2.48             0.40

       50            3.40           3.80          505.66             1.15      0.22            505.66±2.87             0.30

  Figure (4-5): A: output response profile B: Variation of flow rate against attenuation of incident light expressed in (mV).

Sample loop
Using LOS (2mMol.L-1) & and optimum concentration of PP(5mMol.L-1) and variable sample volumes (0.1-0.38)
µl were used, while keeping all other parameter, flow rates (1.9,2)ml .min -1 for carrier stream and reagent
respectively, open valve & applied voltage to the LEDs was 2volt DC. The plot of change in sample volume vs.
reflection of incident light and ∆tB is shown in Figure 4.6. B. It was noticed that an increase of sample volume up
to 0.22ml lead to a significant increase in response height ( gave an increase of ≈ 20% ) & more perceptible than
small volume as shown in Fig 4.6. A.While a larger sample volume i.e: more than 220 µl even though it gave a
slightly higher response (add only 2%) but it was characterized with wider ∆tB which might be due to the continuous
relatively longer time duration of precipitate particles segment in front of the detector and increase of the particles
size causing a slow movement of precipitate particles so; 220 µl was the best sample volume. All results were
tabulated in Table 4.6.

       Table (4-6): Effect of the variation of sample volume on the transducer energy response determination of LOS.

                                                                                        Confidence interval          Base
   The volume           Length of            Average
                                                                                             At 95%                  width
    of loop µl            sample            response          σn-1          RSD%
                                                                                                                      ΔtB
     V=r2hπ              loop cm           (n=3) (mV)                                   y̅i± t0.05/2,n-1 σn-1/√n      min

       100                  12.99            324.66           1.15          0.35            324.66±2.87              0.35

       140                  18.08            580.66           1.15          0.19            580.66±2.87              0.40

       170                  21.65            608.33           1.52          0.25            608.33±3.79              0.41

       220                  28.02            800.00           1.15          0.14            815.33±2.87              0.45

       270                  34.39            881.00           1.73          0.19              881±4.30               0.60

       300                  38.91            906.66           1.15          0.12            906.66±2.87              0.70

       380                  48.91            976.00           1.00          0.10            976.00±2.48              0.85

www.turkjphysiotherrehabil.org                                                                                        10000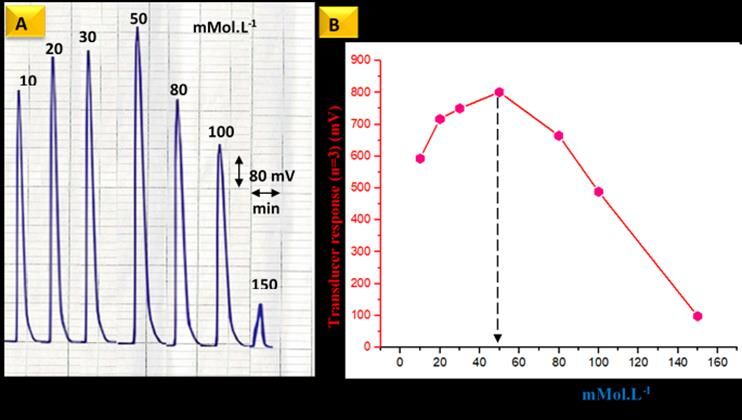
Turkish Journal of Physiotherapy and Rehabilitation; 32(3)
                                                                    ISSN 2651-4451 | e-ISSN 2651-446X

  Figure (4-5): A: Response profile for the volume of sample loop variation with Energy transducer response expressed an
  average peak height (n=3) y̅i (mV) B: Variation of energy transducer response by the reflection of incident light for LOS.

Intensity of light
The variation of light intensity on the efficiency for the determination of losartan potassium at 2mMol.L-1 was
studied. While keeping all other variables fixed (i.e:220 µl sample volume, PP 5mMol.L -1,50 mMol.L-1 of
potassium nitrate, open valve 1.9, 2 ml.min-1 flow rate for carrier stream and reagent line respectively. The applied
voltage to the LEDs was used (370-2000)mV DC by variation of light intensity knob (in the front panel of Ayah
6SX1-T-2D solar cell CFI Analyzer. The whole process was monitored by an AVO meter. The results were
tabulated in Table 4.7, which shows that an increase in the energy transducer response with increased intensity of
the light source. Therefore the intensity of 2 volts DC was selected as the optimum voltage that can be supplied to
give a better peak height and for the sake of the compromise between sensitivity and instrument lifetime. Figure
4.6-A, B shows the effect of variation of light intensity on energy transducer response.

       Table (4-7): Effect the variable light intensity on the energy transducer response determination of LOS by PP.

                                                                                  Confidence interval At           Base
                                   Average
                                                                                          95%                      width
     Intensity of light         response (n=3)          σn-1        RSD%
                                                                                                                    ΔtB
                                    (mV)                                            y̅i± t0.05/2,n-1 σn-1/√n       min

            370                      91.33              1.15         1.26                91.33±2.87                 0.40

            455                      102.00             2.00         1.96               102.00±4.97                 0.45

            637                      215.33             1.15         0.53               215.33±2.87                 0.50

            751                      290.00             2.00         0.68               290.00±4.97                 0.55

            811                      308.66             1.15         0.37               308.66±2.87                 0.57

            910                      380.33             1.52         0.40               380.33±3.79                 0.60

            2000                     805.00             1.52         0.18               482.66±3.77                 0.65

www.turkjphysiotherrehabil.org                                                                                       10001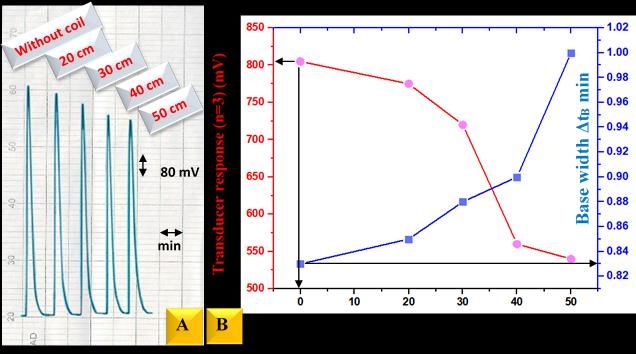
Turkish Journal of Physiotherapy and Rehabilitation; 32(3)
                                                                    ISSN 2651-4451 | e-ISSN 2651-446X

  Figure (4-6): A: Response profile of variation incident light intensity on precipitation reaction of LOS-PP B: Relation of
                                         intensity with Energy transducer response

Reaction coil
Variable coil length 0-20 cm was studied. This length comprises a volume (0- 0.393)ml which is connected after
Y-junction directly in a flow system. While keeping all other changeable constants (LOS: 2mMol.L-1; PP
concentration 5 mMol.L-1, flow rate 1.9& 2 ml.min-1 for carrier stream (PN) and reagent(PP) respectively, sample
volume 220 µl and applied voltage of LEDs was 2 volt DC. Figure 4.7A This may be due to the effect of diffusion
and dispersion on the precipitate particulate segment, causing an increase in diffusion regions and, in turn, a loss
of some of the reflectivity, with an increase in base width and destination for sample segment from injection valve
to measuring cell. So, it can be seen clearly that no reaction coil was selected for further work (Table 4.7 & Figure
4.6B).

             Table (4-8): Effect of reaction coil on precipitation system LOS-PP-PN for determination of LOS.

                                    Average                                      Confidence interval
      The            Length
                                    response                                          At 95%                  Base width
   volume of         of coil                          σn-1        RSD%
                                      (n=3)                                                                    ΔtB min
    coil µl            cm                                                        y̅i± t0.05/2,n-1 σn-1/√n
                                      (mV)

       0                0              805           2.00          0.18                805±4.96                   0.83

      157               20             775           2.00          0.20                775±4.96                   0.85

      235               30             720           1.73          0.17               720±4. 29                   0.88

      314               40             560           2.00          0.22                560±4.96                    0.9

      393               50             540           1.15          0.13                540±2.85                   1.00

www.turkjphysiotherrehabil.org                                                                                        10002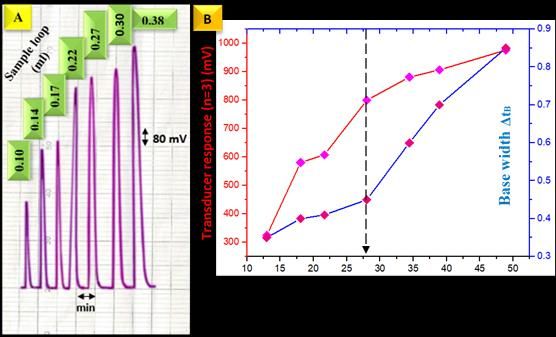
Turkish Journal of Physiotherapy and Rehabilitation; 32(3)
                                                                       ISSN 2651-4451 | e-ISSN 2651-446X

      Figure (4-6): A: Response profile for effect reaction coil on addition transducer response B: Effect of length coil on
                                                    reflection of incident light.

Purge time
A Purge time study was carried out to determine the optimum duration of the injection time i.e. allowed permissible
time for purging of the sample segment from the injection valve in this study 3-41 seconds were used. The optimum
physical and chemical parameters achieved in the previous section were kept constant. Figure 4.9 shows the
continuation of the increase the height of response with an increase of purge time up to 16 sec, after that, there was
no longer a significant difference in peak height but the increase of ∆tB, which might be attributed to the resistance
of flow due to the continuous passage of carrier stream through the injection valve which leads to the slow
movement of reflecting particles, therefore 16sec. as a purge time was chosen as optimum to completely purge of
sample segment from the sample loop. The obtained results were tabulated in Table 4.7

                   Table (4-7): Effect the purge time on attenuation of incident light for determination LOS.

                                                                                     Confidence interval At        Base
 Purge Time         Average response (n=3)
                                                   σn-1            RSD%              95%                           width ΔtB
 (sec)              (mV)
                                                                                     y̅i± t0.05/2,n-1 σn-1/√n      min
 3                  81.33                          1.15            1.41              81.33±2.87                    0.20
 5                  248.66                         1.15            0.46              248.66±2.87                   0.30
 7                  480.00                         1.15            0.18              480±2.87                      0.45
 10                 680                            1.52            0.16              680±3.79                      0.60
 16                 780                            1.52            0.15              780±3.79                      0.75
 25                 805                            1.00            0.09              805±2.48                      0.80
 33                 810                            1.52            0.14              810±3.79                      0.82
 41                 805                            1.52            0.14              805±3.79                      0.85

www.turkjphysiotherrehabil.org                                                                                         10003
Turkish Journal of Physiotherapy and Rehabilitation; 32(3)
ISSN 2651-4451 | e-ISSN 2651-446X
Figure (4-8): A: Response profile for purge time (sec) B: Average peak heights are used to represent purge time (sec) and
energy transducer response.
Calibration graph
An optimum physical and chemical parameters were used that achieved in the previous section. A series of LOS
solution range (0.5-3) mMol.L-1 were prepared and injected at sample volume 220 µL with flow rate 2 mL.min -1.
The average peak height (mV) was plotted against the concentration of LOS to construction scatter plot as shown
in Figure (4.9-A). A straight-line graph from 0.5 to 2.8 mMol.L-1 of LOS solution was obtained and showed in
Figure (4-9-B). It can be noticed that the increase in losartan potassium concentration will lead to a deviation from
a straight line and decreased the numerical value of the correlation coefficient. While usingthe classical
spectrophotometric method, a series of concentrations were prepared (0.01-0.1) mMol.L-1, and the absorbance was
calculated as shown in the figure. (4-9-C). The obtained data are summed up in Table (4-8).
www.turkjphysiotherrehabil.org 10004Turkish Journal of Physiotherapy and Rehabilitation; 32(3)
ISSN 2651-4451 | e-ISSN 2651-446X
Figure (4-9): Calibration graph for the determination of losartan potassium by proposed precipitation method: A: Scatter plot
(0.5-3 mMol.L-1), B: at rang (0.5-2.8 mMol.L-1), C: Absorbance in (classical method) Residual = (ȳi-ŷi) in mV, ȳi =
practical value, ŷi =estimated value. D: profile response for the variation of losartan potassium concentration with Energy
transducer response.
Table (4-8): Summary of calibration graph results for the determination of losartan potassium using Ayah 6SXI-T-2D solar
cell and classical spectrophotometer method.
Measured Liner Ŷ(mV)=a±sat+b±sbt[LOS] r t tab at 95% Calculate
[LOS] dynamic d t-value
mMol.L-1 at confidence r2 confidence
mMol.L-1 range tcal=|r|√n-
level 95%,n-2 level, n-2
mMol.L-1 r2 % 2 √1-r2
0.5-3 0.5-3 - 0.9943 2.201Turkish Journal of Physiotherapy and Rehabilitation; 32(3)
ISSN 2651-4451 | e-ISSN 2651-446X
0.01-0.1 0.01-0.1 - 0.9985 2.447Turkish Journal of Physiotherapy and Rehabilitation; 32(3)
ISSN 2651-4451 | e-ISSN 2651-446X
Table (4-11): Limit of detection for losartan potassium at optimum parameters using 220μL as an injection sample and
optimum parameters
Practically based
Practically based on the gradual dilution Theoretically based
on minimum Based on the linear
for the minimum concentration in the on the value of
concentration in equation Ŷ=YB+3Sb
calibration curve slope X=3SB/slope
calibration graph
0.5 mMol.L-1 12.6 µg/sample 13.712 µg/sample 6.88 µg/sample
Minimum* conc. = Gradual dilution for the minimum concentration in calibration graph, X= value of L.O.D. based
on slope, SB = standard deviation of blank solution, Sb = Fit Std Err, yB= average response for the blank solution
(equivalent to intercept in straight-line equation).
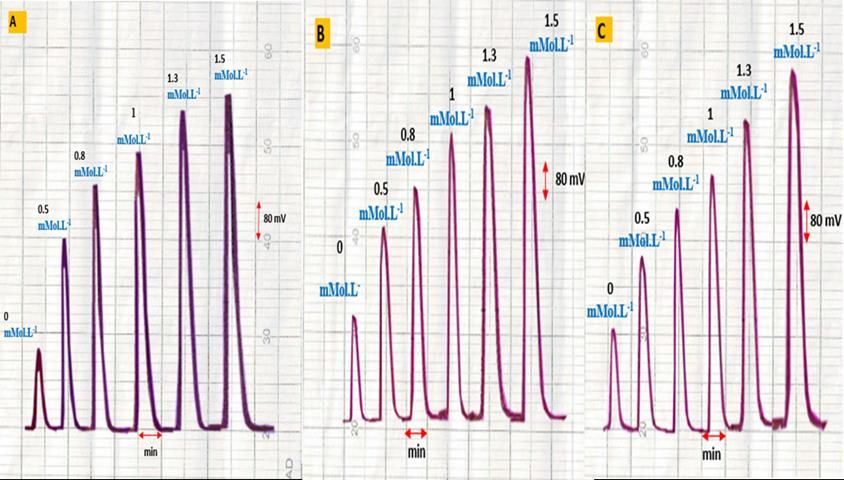
Analysis Determination of losartan potassium in the Pharmaceutical Preparation.
The CFIA via reflection of incident light expressed as (T0-180º) method using Ayah 6SX1-T-2D solar cell –CFI
Analyzer achieved. This work was used for the analysis of Losartan potassium in the three different drug
manufacturers (Angizaar-India-50mg, ALkindi-Iraq-50mg, Bio active-Turkey-50mg) and The results were
compared with Classical by UV-Spectrophotometric method via the measurement of λmax at 235 nm. A series of
solutions were prepared of a sample by transferring 1.25 mL to each of the six volumetric flasks (10 mL), followed
by the addition of (0, 1.25, 2, 2.5,3.25,3.75) mL from 4 mMol.L-1 standard solution of losartan potassium to have
the concentration range from (0-1.5) mMol.L-1. Flask no.1 is the sample flask volume. The classical method was
prepared a series of solutions to the determination of losartan potassium in the range (0-0.8 mMol.L-1) by
subsequently diluted and measured at λmax 235nm. Table (4-12) showed the summary results of standard additions
method results for the three samples with the amount of Losartan potassium in samples. Table (4-13) shows paired
t-test, which compared the methods used for analysis at a 95% confidence interval. It can be noticed from Table
(4-13) that the calculated t-test is less than the ttab. It can be regarded that there is no significant difference in using
the two methods. Therefore, the newly developed instrument can be used as an alternative to the commercially
available instrument
Figure (4-11) Response profile of three CompanyA: Angizaar B: ALkindi C: Bioactive
www.turkjphysiotherrehabil.org 10007Turkish Journal of Physiotherapy and Rehabilitation; 32(3)
ISSN 2651-4451 | e-ISSN 2651-446X
www.turkjphysiotherrehabil.org 10008Turkish Journal of Physiotherapy and Rehabilitation; 32(3)
ISSN 2651-4451 | e-ISSN 2651-446X
Figure (4-11): A (A1): Angizaar Company Standard addition (A2): UV spectrometric method. B (B1): ALkindi Company
Standard addition (B2): UV spectrometric method,C (C1): Bioactive Company Standard addition (C2): UV spectrometric
method
Table (4-14): Comparison of Losartan potassium measurements by conventional Absorbance with the newly developed
method for Losartan potassium.
Ayah 6SX1-T-2D solar cell CFI
Analytical parameter Classical method
Analyzer
r2%:linearity percentage 99.79 99.32
Measured [LOS.] mMol.L-1 0.01-0.1 0.5-3
Linear dynamic range [LOS.] mMol.L-1 0.01-0.1 0.5-2.8
Sensitivity (b) 13.4742 500.38
Intercept (a)
-0.0274 -172.4
Sample volume 5ml 0.22 ml
Sample rate.h-1 20 30
www.turkjphysiotherrehabil.org 10009Turkish Journal of Physiotherapy and Rehabilitation; 32(3)
ISSN 2651-4451 | e-ISSN 2651-446X
Table (4-11): Summary of results by standard additions method for the de ŷ: Estimated response value (mV for Ayah 6SX1-
T-2D solar cell CFI
Type of methods
Development method using Ayah 6SX1-T-2D solar cell CFI
Analyzer in mV
Classical method using ((UV-Spectrophotometric method)) at
235nm
Sampl Equation
e of
weight standard
Confiden
The equiva addition
ce Theoret
S comme lent to curve at
interval ical
a rcial 0.1844 95% for
for the content
m name, g Losartan potassium in ( mMol.L-1) n-2
average for the
p Countr (4mM Ŷ(mV)=(a±
weight active
le y, ol.L- Sat)+(b±Sb
of a 1 ingredie
N Conten )of t) r
tablet nt at
o t, the [LOS ]
W±1.9 95%
. Compa active mMol.L-1 r2
6 σn-1/ √n (g)
ny ingredi r2
at
ent (g) 0 1.25 2 ml 2.5 ml
3.25 3.75
ml ml %
95%(g) 0 0.5 0.8 1 1.3 1.5 Ŷ=(a±Sat)
0.0461 0.02 0.05 0.07 0.13 0.2 +(b±Sbt)
0 5 ml ml 5 ml 7ml ml
g [LOS ]
mMol.L-1
(1mM 0 0.01 0.02 0.03 0.05 5 0.08
ol.L-1)
0.9
Ŷ(mV)=17
872
8.48±57.6
0.1777± 0.05±0. 150 385 500 563 642 719 1+370.20 0.9
Angiza 0.6553 787
ar- 0.00020 000056 mV mV mV mV mV mV ±58.45
[X] 97.
Losart 87
an mMol.L-1
%
potassi
1 um Ŷ=0.2124 0.9
India ±0.0236+ 985
50mg 0.1777± 0.05±0. 10.5000± 0.9
0.1638 0.54 0.63 0.75 0.98
0.00020 000056 0.411 1.267 0.0555 975
0 1 0 5
[X] 99.
mMol.L-1 75
0.9
Ŷ(mV)=17
993
5.4±12.46
ALkin 0.1874± 0.691 0.05±0. 170 368 474 545 650 730 4+369.13 0.9
di- 0.00062 1 00016 mV mV mV mV mV mV ±12.630 989
[X]mMol. 99.
Losart
L-1 89
an %
potassi
2 0.9
um Ŷ=0.2165
966
Iraq ±0.0358+
0.1874± 0.05±0. 0.9
50mg 0.1727 0.40 0.56 0.64 0.75 0.99 1.27 10.526±0.
0.00062 000056 943
2 1 0 0 5 0 0848 [X]
99.
mMol.L-1
43
Ŷ=174.42 0.9
Bioacti
±33.617+ 955
ve 0.1767± 0.05±0.
3 0.6516 182 348 460 560 641 735 368.32±3 0.9
Losart 0.00022 000062
4.11 926
an
[X]mMol. 99.
www.turkjphysiotherrehabil.org 10010Turkish Journal of Physiotherapy and Rehabilitation; 32(3)
ISSN 2651-4451 | e-ISSN 2651-446X
potassi L-1 26
um %
Turkey
50mg
Ŷ=0.2152 0.9
±0.0194+ 990
0.1767± 0.05±0. 0.42 0.54 0.63 0.75 0.99 1.27
0.1629 10.516±0. 0.9
0.00022 000056 0 2 1 8 0 3
0459 [X] 983
mMol.L-1 99.
83
Analyzer method) for (n=3), method, r: correlation coefficient, r2: coefficient of determination& r2%: linearity
percentage, t0.05/2, 2 = 4.303. UV –Sp.: UV –spectrophotometric method, t0.025, %, [X] = [losartan potassium]
mMol.L-1termination of losartan potassium by turbidity system using Ayah 6SX1-T-2D solar cell CFI Analyzer
method and Absorbance method
Table (4-12): Paired t-test of a newly developed method with the classical method
Type of methods
Development method using Ayah 6SX1-T-2D solar cell CFI Analyzer in mV
Classical method using ((UV-Spectrophotometric method)) at 235nm
Practical Weight of losartan
No. of concentration potassium in each
sample (mMol.L-1) in sample (g) The Individual t-test (X-μ) √n / Paired t-test
10 ml efficiency σn-1 Xd√ n / σn-1
Weight of Losartan of
Practical determinat
potassium in tablet
concentration ion
4.303
(mMol.L-1) in σn-1/ √n (g) (%Rec)
100 ml
0.4820 0.1777±2.4840
0.04818±0.6734 95% /-0.2717/ ˂4.303
1 3.8560
0.0202 0.0466±0.0099
0.0505±0.0107 101% /-20.08/ > 4.303
1.0110
0.4750 0.1751±2.6295
0.04748±0.7130 94.96% /-0.2535/˂ 4.303
2 3.8000 /-
0.0205 0.0472±0.0124
104.44% /-15.98/ > 4.303 3.352/˂˂12.
1.0250 0.0512±0.0134 706
0.4730 0.1774±2.0875
0.04729±0.5564 94.58% /-0.3394/˂ 4.303
3 3.7840
0.0204 0.0470±0.0127
0.0509±0.0138 101.8% /-15.68/ > 4.303
1.0200
VI. CONCLUSION
The proposed method for the determination of LOS based on the formation of white precipitate for Oxidation
between the drug and K2S2O8 in KNO3 medium and measured the turbidity via the use of Ayah 6SX1-T-2D Solar
cell CFIA. The method is a simple, sensitive, does not require reaction coil, expensive chemicals and without
involve any specific sample treatment. In addition to easy and cheaper carry out. This method used for
determination of LOS in mailgram for 270µL sample volume in pure and pharmaceutical preparation.
Acknowledgement
I want to thank Professor Dr. Issam M. A. Shakir and Professor Dr. Nagam S. Turkey for their support,
encouragement, and remarks that were very helpful as well as to express my gratitude to the Ayah 6SX1-T-2D
Solar cell-CFI Analyzer that they've helped develop.
www.turkjphysiotherrehabil.org 10011Turkish Journal of Physiotherapy and Rehabilitation; 32(3)
ISSN 2651-4451 | e-ISSN 2651-446X
REFERENCE
1. Sodeifian, G., et al., Measuring and modeling the solubility of an antihypertensive drug (losartan potassium, Cozaar) in supercritical carbon dioxide.
Journal of Molecular Liquids, 2021. 331: p. 115745.
2. Dubey, R., V.K. Bhusari, and S.R. Dhaneshwar, Validated RP-HPLC method for simultaneous quantitation of losartan potassium and metolazone in
bulk drug and formulation. Scientia pharmaceutica, 2011. 79(3): p. 545-554.
3. Al-Majed, A.-R.A., et al., Losartan: comprehensive profile. Profiles of Drug Substances, Excipients and Related Methodology, 2015. 40: p. 159-194.
4. Sultana, N., M.S. Arayne, and S.N. Ali, An ultra-sensitive LC method for the simultaneous determination of paracetamol, carbamazepine, losartan and
ciprofloxacin in bulk drug, pharmaceutical formulation and human serum by programming the detector. 2013.
5. Jayasree, J., et al., Role of various natural, synthetic and semi-synthetic polymers on drug release kinetics of losartan potassium oral controlled release
tablets. International journal of pharmaceutical investigation, 2014. 4(4): p. 183.
6. Kumar, D., A. Sharma, and R. Garg, Formulation and Evaluation of Sublingual Tablet of Losartan Potassium. Asian Journal of Pharmaceutical
Research and Development, 2018. 6(4): p. 54-66.
7. Abd El-Hay, S.S., M.Y. El-Mammli, and A.A. Shalaby, Determination of clemastine hydrogen fumarate, desloratadine, losartan potassium and
moxepril HCl through binary complex formation with eosin. Arabian Journal of Chemistry, 2016. 9: p. S541-S547.
8. Abdel-Fattah, L., L. Abdel-Aziz, and M. Gaied, Enhanced spectrophotometric determination of Losartan potassium based on its physicochemical
interaction with cationic surfactant. Spectrochimica Acta Part A: Molecular and Biomolecular Spectroscopy, 2015. 136: p. 178-184.
9. Wu, J., et al., SERS determination of the antihypertensive drugs prazosin and losartan by using silver nanoparticles coated with β-cyclodextrin.
Microchimica Acta, 2019. 186(12): p. 1-10.
10. Lima, M.J. and B.F. Reis, A clean photometric method for the determination of losartan potassium in pharmaceuticals exploiting light scattering effect
and employing a multicommuted flow analysis approach. Talanta, 2017. 164: p. 183-188.
11. Guo, K., et al., Solubility of losartan potassium in different pure solvents from (293.15 to 343.15) K. Journal of Chemical & Engineering Data, 2008.
53(7): p. 1467-1469.
12. de Andrade, J.R., et al., Comparative adsorption of diclofenac sodium and losartan potassium in organophilic clay-packed fixed-bed: X-ray
photoelectron spectroscopy characterization, experimental tests and theoretical study on DFT-based chemical descriptors. Journal of Molecular
Liquids, 2020. 312: p. 113427.
13. Mattiazzi, P., et al., Assessment of purity parameters of generic and brand name losartan potassium. Current Pharmaceutical Analysis, 2021. 17(1): p.
129-139.
14. S Turkey Al-Awadie, N. and K. H Ismael Al-saadi, A new approach for the turbidimetric determination of cyproheptadine hydrochloride in
pharmaceutical preparations by using homemade linear array Ayah 6SX1-T-2D solar cell CFI analyser. journal of kerbala university, 2015. 11(1): p.
61-80.
15. S Turkey Al-Awadie, N. and O. A Yassin, New approach for the on-line turbidimetric determination of metronidazole in pharmaceutical preparation
via the use of a new homemade Ayah 6SX1-T-2D Solar-continuous flow injection analyser. karbala journal of pharmaceutical sciences, 2014. 5(7): p.
158-171.
16. Al-Awadie, N.S.T. and K.H.I. Al-saadi, Turbidimetric Determination of Metoclopramide Hydrochloride in Pharmaceutical Preparation via the Use of
A new Homemade Ayah 6SX1-T-2D Solar Cell-Continuous Flow Injection Analyser. Iraqi Journal of Science, 2015. 56(2B): p. 1224-1240.
17. Al-Awadie, N.S.T., I.M.S. Al-Hashimi, and K.H.I. Al-saadi, Novel Study of Cyproheptadine Hydrochloride Precipitate Formed by Potassium
hexacyanoferrate and Sodium nitroprusside using Atomic Force Microscopy. Iraqi Journal of Science, 2015. 56(4A): p. 2745-2761.
18. Moghadasi, S., Elveny, M., Rahman, H.S. et al. A paradigm shift in cell-free approach: the emerging role of MSCs-derived exosomes in regenerative
medicine. J Transl Med 19, 302 (2021). https://doi.org/10.1186/s12967-021-02980-6
19. JALIL, A. T., DILFY, S. H., KAREVSKIY, A., & NAJAH, N. (2020). Viral Hepatitis in Dhi-Qar Province: Demographics and Hematological
Characteristics of Patients. International Journal of Pharmaceutical Research, 12(1).
20. Dilfy, S. H., Hanawi, M. J., Al-bideri, A. W., & Jalil, A. T. (2020). Determination of Chemical Composition of Cultivated Mushrooms in Iraq with
Spectrophotometrically and High Performance Liquid Chromatographic. Journal of Green Engineering, 10, 6200-6216.
21. Jalil, A. T., Al-Khafaji, A. H. D., Karevskiy, A., Dilfy, S. H., & Hanan, Z. K. (2021). Polymerase chain reaction technique for molecular detection of
HPV16 infections among women with cervical cancer in Dhi-Qar Province. Materials Today: Proceedings.
22. Marofi, F., F. Abdul‐Rasheed, O., Sulaiman Rahman, H., Setia Budi, H., Jalil, A. T., Valerievich Yumashev, A., ... & Jarahian, M. (2021). CAR‐NK
cell in cancer immunotherapy; A promising frontier. Cancer Science.
23. Widjaja, G., Jalil, A. T., Rahman, H. S., Abdelbasset, W. K., Bokov, D. O., Suksatan, W., ... & Ahmadi, M. (2021). Humoral Immune mechanisms
involved in protective and pathological immunity during COVID-19. Human Immunology.
24. Turki Jalil, A., Emad Al. Qurabiy, H., Hussain Dilfy, S., Oudah Meza, S., Aravindhan, S., M. Kadhim, M., M. Aljeboree, A. (2021). CuO/ZrO2
Nanocomposites: Facile Synthesis, Characterization and Photocatalytic Degradation of Tetracycline Antibiotic. Journal of Nanostructures, (), -.
25. Jalil, A.T., Kadhum, W.R., Faryad Khan , M.U. et al. Cancer stages and demographical study of HPV16 in gene L2 isolated from cervical cancer in
Dhi-Qar province, Iraq. Appl Nanosci (2021). https://doi.org/10.1007/s13204-021-01947-9
www.turkjphysiotherrehabil.org 10012You can also read