STOCK ASSESSMENT OF YELLOWTAIL FLOUNDER (LIMANDA FERRUGINEA) OF THE SOUTHERN GULF OF ST. LAWRENCE (NAFO DIV. 4T) TO 2020
←
→
Page content transcription
If your browser does not render page correctly, please read the page content below
Canadian Science Advisory Secretariat
Gulf Region                                                   Science Advisory Report 2021/022

      STOCK ASSESSMENT OF YELLOWTAIL FLOUNDER
        (LIMANDA FERRUGINEA) OF THE SOUTHERN
       GULF OF ST. LAWRENCE (NAFO DIV. 4T) TO 2020

 Yellowtail Flounder (Limanda ferruginea)
 Credit: Fisheries and Oceans Canada

                                                     Figure 1. Subdivisions within NAFO Div. 4T in the
                                                     southern Gulf of St. Lawrence.

 Context:
 Yellowtail Flounder (Limanda ferruginea) range from southern Labrador to Chesapeake Bay (Scott and
 Scott 1988). In the southern Gulf of St. Lawrence (NAFO Div. 4T), Yellowtail tends to be distributed in
 shallow, near shore areas where it has been fished primarily for bait. The main fishery for Yellowtail
 Flounder now occurs in the waters off the Magdalen Islands. The first assessment of this stock was in
 1997 with subsequent assessments and updates in 2002 (DFO 2002, Poirier and Morin 2002), 2005
 (DFO 2005), 2013 (DFO 2014), 2014 (DFO 2015), 2015 (DFO 2016), and 2018 (DFO 2019). An annual
 total allowable catch (TAC) of 225 t for Yellowtail Flounder has been in effect since 2016 in
 NAFO Div. 4T. DFO Ecosystems and Fisheries Management has instituted a multi-year management
 approach for Yellowtail Flounder and requested advice for a TAC decision for May 2021 to May 2026
 for the southern Gulf of St. Lawrence Yellowtail Flounder stock.
 This Science Advisory Report is from the February 16, 2021 science peer review meeting on the stock
 status of Yellowtail Flounder and the development of management advice for the fishery on this stock.
 Participants at the meeting included DFO Science (Gulf, Québec, National Capital regions), DFO
 Fisheries Management (Gulf, Québec regions), provincial governments, and the fishing industry.

June 2021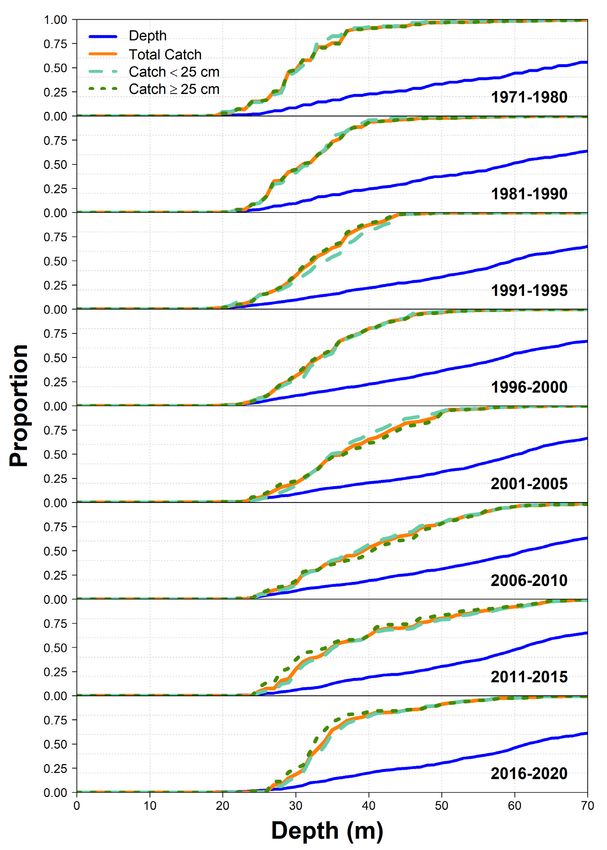
Yellowtail Flounder
    Gulf Region                                                    Southern Gulf of St. Lawrence

SUMMARY
•     Yellowtail Flounder is currently caught in a relatively small directed fishery concentrated
      around the Magdalen Islands with landings averaging 120 tonnes (t) over the past 10 years.
•     Yellowtail Flounder ≥ 25 cm (minimum size limit for the fishery) comprised 80% of the
      observed commercial catch throughout the 1970s and 1980s declining to 20.5% since 2011.
•     Based on the research vessel (RV) survey, the abundance of fish < 25 cm in length
      increased 10-fold from 1985 to 2013 while the abundance of larger fish declined by 94%
      from 1981 to 2011 and has remained at a very low level. This suggests that mortality is high
      for larger fish and low for smaller fish.
•     Based on a population model of the 4T stock, natural mortality of larger and older Yellowtail
      Flounder increased from 21% annually in 1985-1990 to 86% or more annually since 2009. In
      contrast, estimated natural mortality of small and young Yellowtail Flounder has remained
      below 53% annually from 1985 to 2020.
•     Similar changes in natural mortality have occurred in many fish species in the southern Gulf
      of St. Lawrence (sGSL). There is strong evidence that predation by grey seals is an
      important cause of the exceptionally high natural mortality experienced by larger and older
      individuals of these species.
•     Estimated spawning stock biomass (SSB) has declined by 50% from its peak observed
      value in the early 2000s. In addition, the composition of the SSB has changed. Fish aged
      7 years and older have declined from 30% of the SSB to less than 0.1%. Fish 4 years and
      younger now comprise 90% of the SSB.
•     Fishing mortality (F) is estimated to be very low for ages 6, and younger. The estimates of
      fishing mortality correspond to fishing rates of less than 1% for ages 2 and 4 and less than
      6% for age 6. For age 8+, fishing rates were less than 12%.
•     A limit reference point (LRP) was derived based on the estimated September biomass of
      large Yellowtail Flounder (≥ 25 cm). The LRP was estimated to be 5,710 t. The stock is
      considered to have been in the critical zone since 2009, and the index in 2020 was 39% of
      the LRP.
•     The contraction in size structure of Yellowtail Flounder, the large decline in the estimated
      size at 50% maturity, and the decline in abundance indices of the previously abundant
      commercial sized group are consistent with a stock experiencing very high levels of
      mortality.
•     The population was projected forward 10 years assuming recent productivity conditions
      would persist. The probability that the stock would remain below the LRP was estimated to
      be 100% in all years of the projection and at all three catch levels examined (0, 100 and
      300 t). The estimated biomass at the end of the projection was 22% (0-100 t) or 20% (300 t)
      of the LRP.
•     At current levels of productivity, 10-year projections indicate SSB declines of 43.7%, 44.0%
      or 45% with catches of 0 t, 100 t or 300 t. Fishing mortality is estimated to be such a small
      portion of total mortality that differences in projection trajectories are negligible between
      these levels of catch.

                                                   2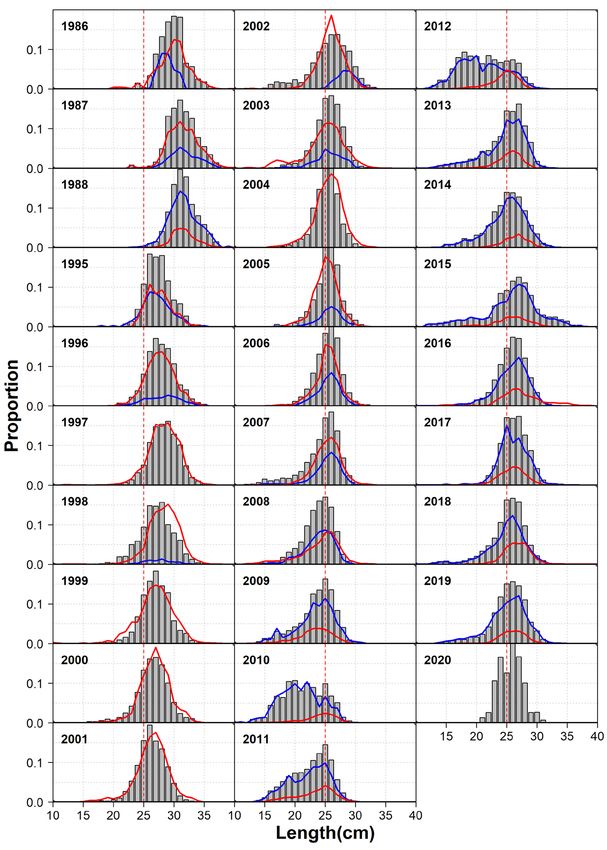
Yellowtail Flounder
 Gulf Region                                                        Southern Gulf of St. Lawrence

INTRODUCTION
Yellowtail Flounder (Limanda ferruginea) is a righteye flounder from the Western Atlantic Ocean
whose distribution ranges from Chesapeake Bay to the southern Labrador Shelf. In the southern
Gulf of St. Lawrence (sGSL), Yellowtail Flounder tends to be distributed in shallow, near shore
areas, where they have been harvested in localized fisheries. Yellowtail Flounder in
NAFO Div. 4T have been fished primarily for bait, and were not under quota management until
2000. They are associated with sand or sand and mud bottoms. Throughout their range, they
typically migrate seasonally into shallower waters in the spring and back to deeper waters in the
winter. Spawning occurs on or near the bottom in spring or early summer. Little information is
known on the biology of Yellowtail Flounder in 4T.
The last full assessment of the Yellowtail Flounder stock in the sGSL (NAFO Div. 4T) was
completed in 2015 (DFO 2016; Surette and Swain 2016). Updated indices of abundance to
2018 were provided in 2019 (DFO 2019).

The Fisheries
The time series of reported landings for Yellowtail in the sGSL begins in 1960 (Fig. 2). Before
1985, a considerable portion of flatfish landings was not identified to species and the landings
identified as Yellowtail Flounder are considered incomplete (Fig. 2). In 1991, it became a license
condition for mobile gear captains to maintain a logbook.
Yellowtail Flounder in the sGSL has been fished primarily for bait, except for 1997 when
landings of 800 tonnes (t) were reported to supply a Japanese food market. Subsequent to that
in 2000, a 300 t quota was established and has been reduced to 225 t in 2016. Preliminary
landings of Yellowtail Flounder for NAFO Div. 4T in 2019 and 2020 were 120 and 136 t,
respectively. These records represent an increase of about 35% over the value observed in
2015 and almost 68% over the lowest recorded level of the time series that was observed in
2016 (Fig. 2). It is now fished exclusively for bait to supply the lobster fishery.

Figure 2. Recorded landings (t) of Yellowtail Flounder and unspecified flatfish in NAFO Div. 4T, 1960 to
1997 (light shading) and 1998-2020 (dark shading). The TAC which has been in place since 1998 is also
shown. Preliminary landings for 2019 and 2020 are provided in red shading.

                                                    3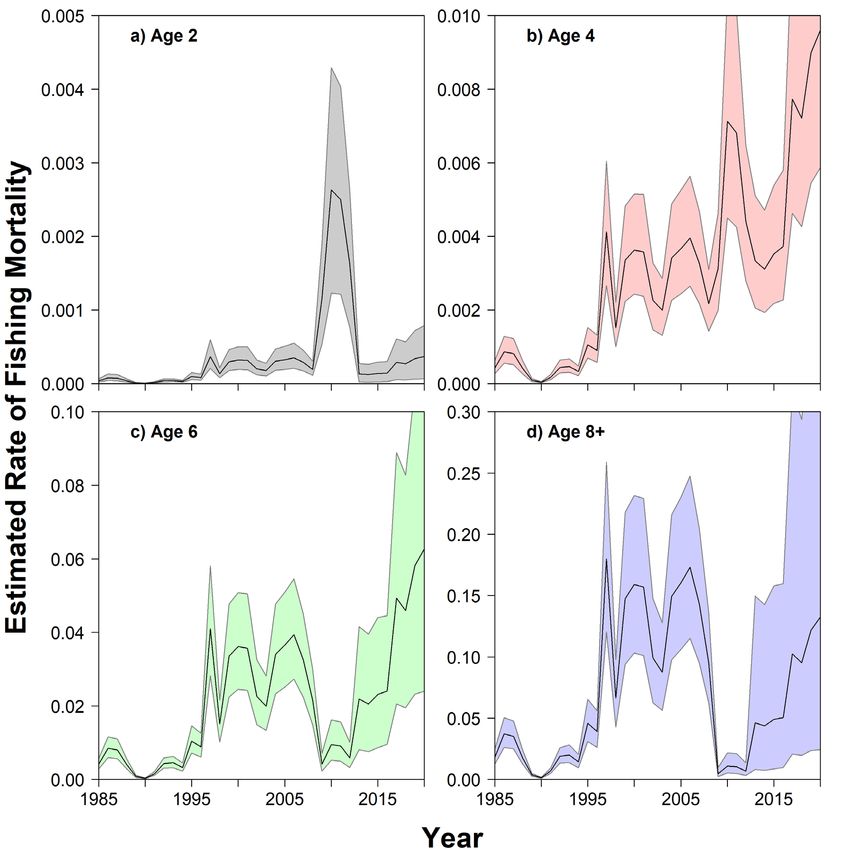
Yellowtail Flounder
Gulf Region Southern Gulf of St. Lawrence
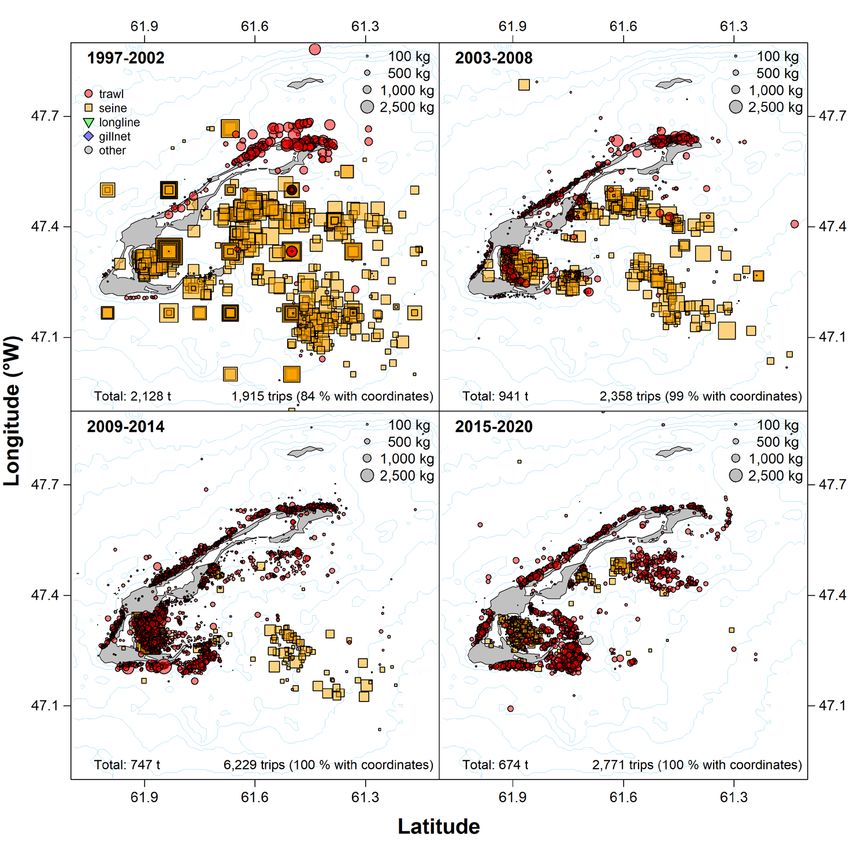
Yellowtail Flounder catches were from the Magdalen Islands (unit area 4Tf), northern PEI (unit
area 4Tj), and Chaleur Bay until the mid-1990s and, off eastern PEI and in the Shediac Valley
(4Tg and 4Tl) until 2005 (Figs. 1, 3). The fishery has been increasingly dominated by boats
originating from the Magdalen Islands with catches concentrated in NAFO unit area 4Tf since
1997 (Figs. 3, 4). In the 1980s and 1990s, Yellowtail Flounder landings were reported mainly
from August to November. Since then, most catches have occurred earlier, mainly in May and
June. Catches in May and June averaged almost 90% of the total landings for 2019 and 2020.
However, in 2014 and 2015 one third of the total landings were made in July (Fig. 3). The shift
to early fishing coincided with the concentration of the Yellowtail Flounder fishery off the
Magdalen Islands where the spring lobster fishery requires an early supply of fish bait.
Figure 3. Proportion of annual Yellowtail landings by NAFO 4T subdivision (upper row), by month (second
panel), by type of fishing gear (third panel) and by target species (lower panel), 1985 to 2020.
4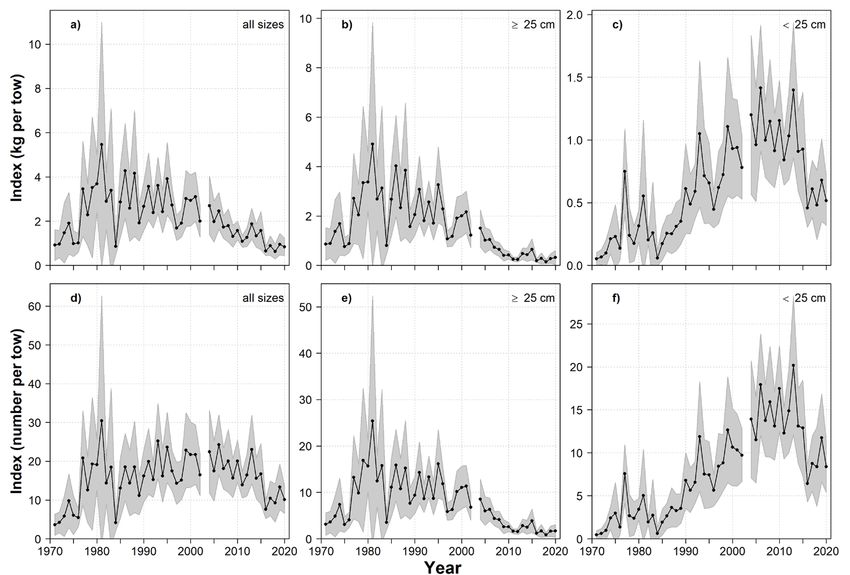
Yellowtail Flounder
 Gulf Region                                                          Southern Gulf of St. Lawrence

Trawls and seines are the preferred gear type for fishing Yellowtail and the proportion of
landings of each type has varied considerably through the years (Fig. 3). Until 2006, the seine
fleet contributed most of the Yellowtail landings but since then, trawlers have been dominant,
contributing 70 and 74% of the total landings in 2019 and 2020, respectively. Until the late
1990s, whenever the targeted species was indicated, Yellowtail was caught mainly as by-catch
in fisheries directing for American Plaice and Winter Flounder. However, since the mid-1990s,
Yellowtail Flounder has been increasingly reported as the targeted species (Fig. 3).

Figure 4. Spatial distribution of logbook catches of Yellowtail Flounder by block of years and fishing gear
type from the southern Gulf of St. Lawrence, 1997 to 2020. The surface area of the each plotted symbol
is proportional to the reported catch.

The size limit for Yellowtail Flounder in the sGSL 4T fisheries has been 25 cm since 1995 and is
intended to be used with a small fish protocol. This protocol was not broadly applied in the past
and samples of Yellowtail catches show a large increase in catches of smaller fish beginning in
1998, with the proportion of catches below 25 cm peaking at about 80% in 2010 to 2012. The
increasing proportions of small fish occurred in both seine and trawl gears but the proportion of
small fish declined in seines but remained higher in commercial trawlers since 2010. There was
a modal shift from 31 cm in the late 1980s, to 28 to 29 cm in the late 1990s, to 25 cm in the late
2000s (Fig. 5). Since 2014, a new measure has been instituted in the Magdalen Island fishery
requiring the return to the water (discarding) of Yellowtail less than 23 cm. There was a slight
increase of 33 to 35 cm fish in catches in 2015 relative to previous years. However this event

                                                     5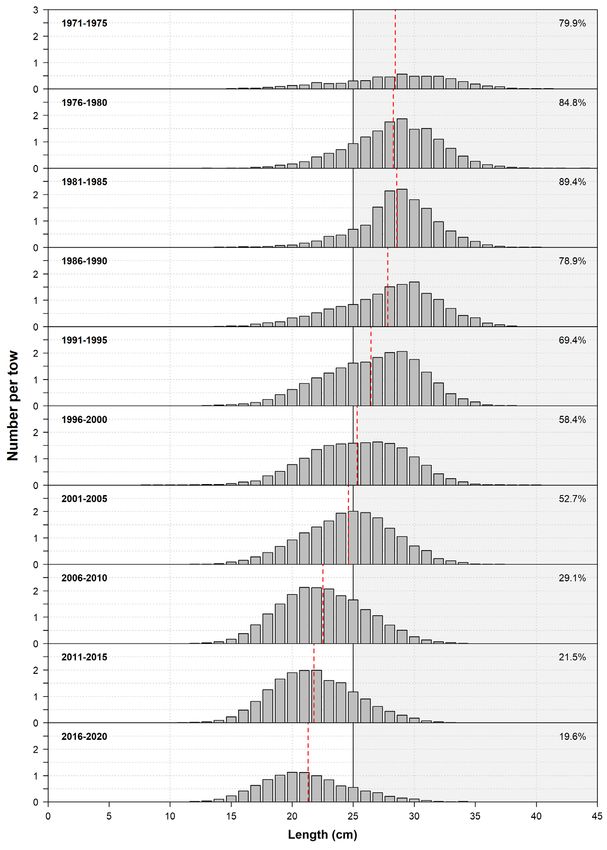
Yellowtail Flounder
 Gulf Region                                                           Southern Gulf of St. Lawrence

was short lived and fish larger than 30 cm were almost absent in 2019-2020 (< 5%), with over
90% of the proportion at length being observed between 20 and 30 cm.
The focus on bait was important in the development of the Yellowtail fishery in the sGSL. From
2001 to 2012, an experimental bait fishery prosecuted mainly by small lobster boats fishing
inshore with otter trawls targeting Yellowtail Flounder, Winter Flounder and Windowpane took
place in the Magdalen Islands. The effort for this fishery increased rapidly from 19 active
vessels in 2001 catching about five t of Yellowtail (6% of the local fishery landings) to
36 trawlers with bait licenses by 2008 with reported catches of 16 t, and peaked in 2010
(96 trawlers; 72 t) and 2011 (99 trawlers; 62 t). The experimental bait fishery was closed after
2012 and the bait market is now supplied by the commercial fishing fleet on the Magdalen
Islands.

Figure 5. Proportions at length of Yellowtail Flounder for the commercial fishery catches based on port
and at-sea samples from the southern Gulf of St. Lawrence, for available years 1986 to 2020. The red
dashed vertical line corresponds to the 25 cm size limit. Overlaid solid lines indicate the proportions of the
total represented by trawler (blue) and seiner (red) catches. Note that for certain years, no trawl samples
were available (e.g. 1999 to 2001). Data for 2019 and 2020 is preliminary.

                                                      6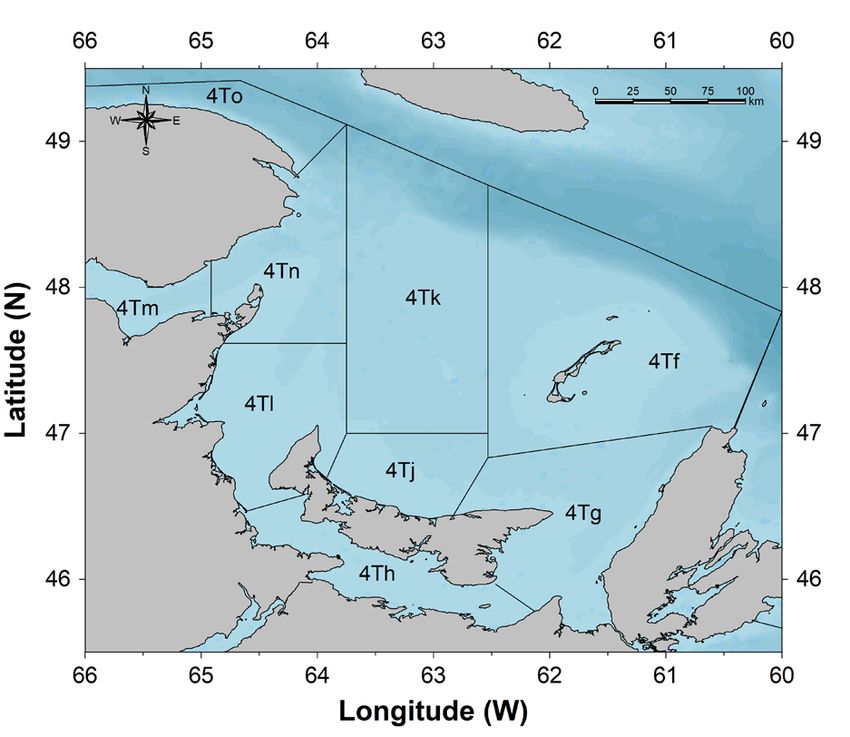
Yellowtail Flounder
 Gulf Region                                                      Southern Gulf of St. Lawrence

ASSESSMENT
Abundance Indices
An annual multi-species bottom trawl research vessel (RV) survey has been conducted in the
sGSL using standardized protocols each September since 1971. In addition, a sentinel August
otter trawl survey has been conducted since 2003. Results of these surveys provide information
on trends in abundance and biomass for groundfish species in the sGSL.
The September RV survey of the sGSL follows a stratified random sampling design. The same
stratification scheme has been used since 1971, except for the addition of three inshore strata
(401-403) in 1984, which were not included in the following results to have a constant survey
area over the entire time series. Comparative fishing experiments were conducted to test for
species-specific changes in fishing efficiency whenever there was a change in research vessel
(1985, 1992, and 2004/2005) or trawl gear (1985). Furthermore there was a change from day-
only to 24-hr fishing in 1985, and both comparative fishing experiments and analyses of survey
catches have been undertaken to estimate any species-specific changes in fishing efficiency
that resulted from this change in protocol. When a change in fishing efficiency was detected for
a particular species, catch rates for that species were standardized to a constant level of
efficiency so that indices remained comparable for the entire time series (Benoît and
Swain 2003; Benoît 2006).
The RV survey biomass index for small Yellowtail Flounder (< 25 cm) increased greatly from the
mid-1980s to the mid-2000s and remained high until 2015 before declining to levels similar to
those observed in the 1990s (Fig. 6). In contrast, the biomass index for large Yellowtail
(≥ 25 cm) decreased sharply from the mid-1990s to 2012. This index increased slightly in 2013
to 2015 before declining in 2016 and has since remained at record low levels (Fig. 6). Similarly,
the RV abundance index of small Yellowtail Flounder increased 10-fold from 1985 to 2013 while
the abundance of larger fish declined by 94% from 1981 to 2011 and has remained at a very
low level since then.

Figure 6. RV survey biomass indices (mean weight in kg per tow and mean number per tow) for Yellowtail
Flounder with all lengths included (a and d), lengths ≥ 25 cm (b and e) and < 25 cm (c and f) from the
southern Gulf of St. Lawrence, 1971 to 2020.

                                                  7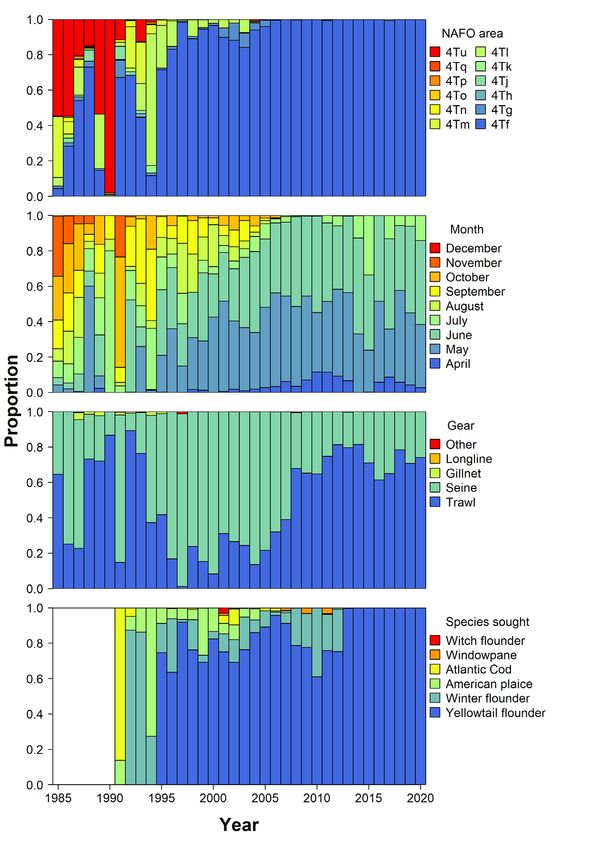
Yellowtail Flounder
 Gulf Region                                                        Southern Gulf of St. Lawrence

Stratified mean length-frequencies show a marked shift in the sizes of Yellowtail Flounder
caught in the September survey (Fig. 7). Modal lengths were at 29 cm during the early portion of
the survey (1971 to 1990) and began declining during the early 1990s to attain 24 cm in the
early 2000s and since down to 21-22 cm. Annual length-frequency distributions for the past ten
years show few changes, with the modal length and standard deviation remaining fairly stable.
No indications of cohorts are discernible. The percentage of Yellowtail Flounder greater than or
equal to 25 cm has averaged 20.5% since 2011, a major shift compared to the values of over
80% observed throughout the 1970s and 1980s (Fig. 8).

Figure 7. RV survey length frequencies of Yellowtail Flounder from the southern Gulf of St. Lawrence in
five year groups, 1971-2020. The dashed vertical red line shows the mean length for each period. The
percentage of Yellowtail Flounder greater than or equal to 25 cm in length is also shown.

                                                    8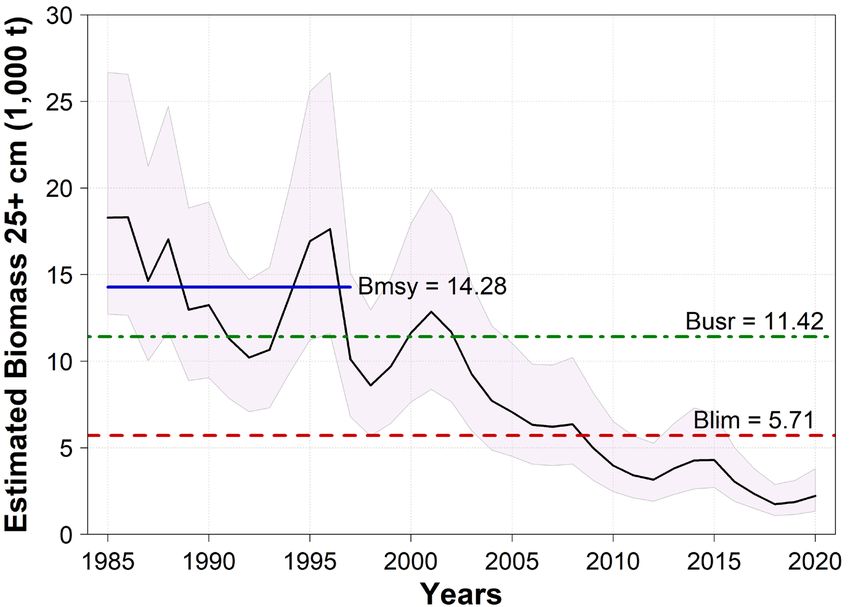
Yellowtail Flounder
 Gulf Region                                                        Southern Gulf of St. Lawrence

Considering that the local Magdalen Islands fishery is mostly the sole source of Yellowtail
Flounder landings in NAFO 4T, a separate index was produced for the September survey strata
(428, 434, 435 and 436) associated with that fishery. Similar to the sGSL index, the biomass of
Yellowtail Flounder < 25 cm increased sharply from the late 1980s to the mid-2000s before
rapidly declining, whereas biomass of large Yellowtail Flounder (≥ 25 cm) dropped sharply
between the mid-1990s and late 2000s in this area and has remained at record low levels since
2008. The trend in size of Yellowtail Flounder for the Magdalen Islands strata is very similar to
that of the sGSL, with the shift in modal size occurring mainly during the 1990 to 2010 period
associated with a decline in abundance of large Yellowtail (≥ 25 cm) in the survey catches
(Fig. 8).

Figure 8. Percentages, based on standardized length-frequencies of the catch, of Yellowtail Flounder of
length ≥ 25 cm in the September bottom trawl survey catches, in all strata of the southern Gulf of St.
Lawrence (solid line) and in the strata around the Magdalen Islands (dashed line), 1971 to 2020.

The fish length at which 50% of fish are mature (size-at-maturity), was estimated for each year
and sex from the RV survey observations (Fig. 9). The size-at-maturity for each year and sex
decreased from approximately 21 cm for male and 27 cm for female in 1971 to the lowest
estimated levels of the time series at about 10 and 14 cm in 2020, respectively. A declining
trend in the age at maturation is often a symptom of high mortality. When mortality is high early
maturation is favored because it increases the probability of surviving to reproduction
(Swain 2011).

                                                    9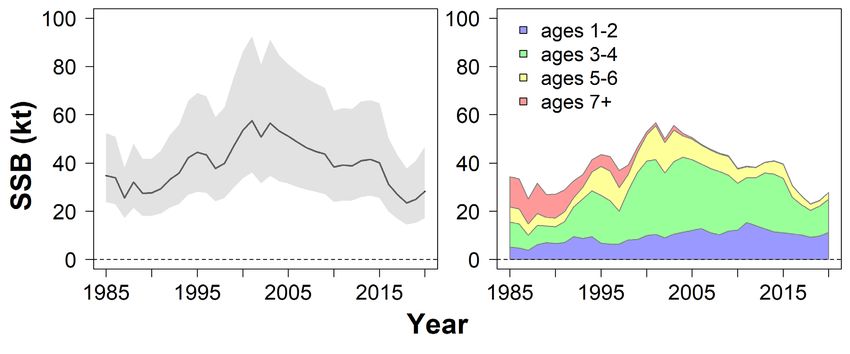
Yellowtail Flounder
 Gulf Region                                                         Southern Gulf of St. Lawrence

Figure 9. Size (cm) at 50% maturity of Yellowtail Flounder, by year and sex, from the southern Gulf of St.
Lawrence as estimated from samples collected from the RV survey, 1971 to 2020.

Spatial Distribution
The spatial distribution of standardized Yellowtail Flounder catches (in kg per tow) from the
September RV survey is shown in Figure 10. Throughout the sGSL, Yellowtail Flounder are
distributed along costal to mid-shore ecosystems. They are distributed in and around the
western, northern and sometimes eastern part of PEI, around the Shediac Valley, on the
eastern part of the Acadian Peninsula, in St. George’s Bay and around the Magdalen Islands.
Smaller catches have become more prevalent in the deeper (50 to 65 m) part of the sGSL in
recent years (1996 to 2020). While the depth profile of stations sampled shows no variation over
time, there are greater proportions of the total catches of Yellowtail Flounder taken in deeper
(50 to 65 m) and cooler waters (< 10ºC) since 2000 (Fig. 11). Despite this expansion of
Yellowtail Flounder into deeper waters, the scale of catches has decreased in all areas, though
there are still some mid-sized catches in northern PEI and to the south-east of the Magdalen
Islands.

                                                    10
Yellowtail Flounder
Gulf Region Southern Gulf of St. Lawrence
Figure 10. Spatial distribution of standardized September bottom trawl survey catches (in kg per standard
tow) of Yellowtail Flounder in the southern Gulf of St. Lawrence, 1971 to 2020. P(occ) indicates
probability of occurrence (the number of tows catching Yellowtail Flounder divided by the total number of
tows)
11Yellowtail Flounder
Gulf Region Southern Gulf of St. Lawrence
Figure 11. Habitat association curves of Yellowtail Flounder with respect to water depth based on catches
from the September bottom trawl survey, 1971 to 2020. Blue lines correspond to the cumulative
frequency curves of the survey sampling stations while the other lines correspond to the cumulative catch
curves for the total catch (solid dark orange), small fish (long chartreuse dashes) and larger fish (short
dark green dashes).
Population Modelling
Methods
A length-based age-structured model was developed to examine the dynamics and status of
Yellowtail Flounder. Abundance at age in the model was mapped into the two length groups
12Yellowtail Flounder
Gulf Region Southern Gulf of St. Lawrence
used for the survey indices and catch proportions based on length-at-age data for 2000, 2007,
2013, 2015 and 2017. Fish aged 1-3 years were assigned to the < 25 cm length group, those
aged 5 years and older were assigned to the ≥ 25 cm length group, and half the 4 year olds
were assigned to each length group. Data inputs included: (1) total annual landings in tonnes,
(2) annual abundance indices from the September RV survey for two length groups (< 25 cm,
≥ 25 cm), (3) the proportion of the annual landings (in numbers of fish) in each of the length
groups, (4) the average weight of individuals by length group for the annual fishery catch and
the annual survey indices, (5) the annual mean weights-at-age, and (6) the annual vector of
proportions mature-at-age. In initial trials, survey catchability q was estimated to be 1.4, with the
survey indices at the scale of trawlable abundance. A small flatfish like Yellowtail Flounder is not
expected to be herded into the net by the doors. Thus, such a high value of q would only be
possible if sampling locations in the survey were strongly biased towards areas where Yellowtail
Flounder occurred at high densities, with these high catch rates extrapolated to areas where
Yellowtail Flounder densities are actually low. Given the distributions of Yellowtail Flounder and
of sampling sites in the survey area, this is not a plausible hypothesis. Thus, an informative prior
for q was used in the model, with a mean of -0.3566 on the log scale (q = 0.7) and SD = 0.15. M
was estimated separately for six time blocks (6-year blocks between 1985 and 2020, i.e. 1985-
1990, 1991-1996, 1997-2002, 2003-2008, 2009-2014 and 2015-2020) and two age groups (1-3
and 5-8+). M of 4-year olds was assumed to be the average of M for ages 1-3 and 5-8+ in the
same year.
Results
The model fit the abundance indices fairly well, though the small fish index tended to be
underestimated in the 2005-2015 period and the large fish index tended to be overestimated in
the 2010-2018 period. Fit to the length-group proportions in the fishery catch was good, except
for a tendency to slightly overestimate the contribution of large fish to the fishery catches in the
early to mid-2000s.
The estimated catchability to the RV survey was very low for age 1 fish (0.018), increasing to
0.46 by age 8+. Estimated fishery selectivity in 1985 to 2008 was less than 0.01 for ages 1 to
3 years and then increased rapidly with age, particularly after age 5. Fishery selectivity for
young ages was much higher in the 2009-2012 period. Fishery selectivity returned to a very low
level for ages 1 to 3 years in 2013-2020. This reflected the mandatory sorting and discarding of
Yellowtail Flounder less than 23 cm in the commercial fishery of the Magdalen Islands during
this period.
Uncertainty in abundance estimates was high, especially for the youngest age group (Fig. 12).
The median estimate of abundance of 1-3 year olds increased steadily from about 325 million in
1985 to a peak of 677 million in 2012, i.e. about double the initial abundance. Age 1-3
abundance then declined to 520 million in 2020. The median estimate of abundance for four and
five year olds was about 41 million in the 1980s, increasing to an average value of 201 million
from 2000 to 2009 before declining by over 50% to about 95 million in 2019 and 2020. The
median estimate of 6+ abundance was about 59 million in the mid-1980s, decreasing to
3 million in 2020, a 95% decline over the time series.
The median estimate of spawning stock biomass (SSB) averaged 31 thousand t in the 1980s,
increasing to an average of 54 thousand t in 2000 to 2005 (Fig. 13). SSB then gradually
declined to 40 thousand t in 2015. Since the last assessment (2015), estimated SSB has
declined to an average of 26 thousand t in 2017 to 2020, about 50% of the level observed in
2000-2005.
13Yellowtail Flounder
Gulf Region Southern Gulf of St. Lawrence
The estimated age composition of the SSB has changed dramatically since the mid-1980s
(Fig. 13). Fish 7 years and older are estimated to have contributed 30% of the SSB in 1985-
1990, declining to less than 0.1% of the SSB since 2015. In contrast, fish 4 years and younger
now comprise 90% of the SSB. This decline in the age and size composition of the spawning
stock may reduce recruitment success due to the lower reproductive potential often attributed to
smaller fish (e.g., due to smaller eggs with lower energy stores).
Figure 12. Estimated abundances of three age-groups of Yellowtail Flounder in the southern Gulf of St.
Lawrence, 1985 to 2020. Lines show the median values and shading their 95% confidence intervals.
Figure 13. Estimated spawning stock biomass (SSB) of Yellowtail Flounder in the southern Gulf of St.
Lawrence (left panel) and its estimated age composition (right panel), 1985 to 2020. In the left panel, lines
show the median estimate and shading shows its 95% confidence interval.
The median estimates of recruitment fluctuated without trend between 180 and 283 million
individuals (Fig. 14). The median estimate of recruitment rate (the abundance of recruits divided
by the SSB producing them) averaged 6.3 fish/kg of spawners. Recruitment rate was above
average in the late 1980s and early 1990s (averaging 8.3), in 2010 to 2012 (6.8) and since 2017
(9.5).
14Yellowtail Flounder
Gulf Region Southern Gulf of St. Lawrence
Figure 14. Estimated recruit abundance (millions) and recruitment rate (recruits/SSB) of Yellowtail
Flounder in the southern Gulf of St. Lawrence, 1985 to 2020. Lines and shading show the median and its
95% confidence interval.
Large changes in estimated natural mortality (M) occurred over the time series, with changes in
opposite directions for large and small individuals (Fig. 15). For young fish (ages 1-3), the
median estimate of M in 1985-1990 was 0.76 (53% annual mortality), declining to 0.16 (15%
annually) in 2003-2008 and then increasing to 0.41 (34%) in 2015 to 2020. For older fish (aged
5 years and older), the median estimate of M in 1985-1990 was 0.24 (21% annually), increasing
to 1.99 (86% annually) in 2009-2020. Any unreported fishery catch would be attributed to
natural mortality by the model and thus may contribute to these extremely high estimates of M
for large individuals. However, unreported catch would need to be many times reported catch to
account for an important portion of elevated natural mortality. The larger individuals in most
large-bodied groundfish species in the sGSL are also experiencing unusually high natural
mortality (Swain and Benoît 2015). Predation by grey seals appears to be an important cause of
this elevated mortality (e.g. Swain and Benoît 2015; Neuenhoff et al. 2019).
Figure 15. Estimated natural mortality of three age groups of Yellowtail Flounder during five time periods
in the southern Gulf of St. Lawrence, 1985 to 2020. Horizontal lines show the median, boxes the
interquartile range (25 to 75 percentiles) and error bars the 95% confidence interval.
Estimated fishing mortality (F) of Yellowtail Flounder was low for all ages over the entire time
series (Fig. 16). For all ages, F tended to be lowest in early years (1985 to about 1995) and
increased to relatively high values in 2020. For older ages (6+) F was also relatively high in
15Yellowtail Flounder
Gulf Region Southern Gulf of St. Lawrence
1997-2008. For 6 year olds, F averaged 0.004 early in the time series, increasing to an average
value of 0.03 in 1997 to 2008, and 0.058 in 2020. For 8 year olds F increased from 0.02 early in
the time series to 0.13 in 1997 to 2008 and 0.076 in 2020. Periods of relatively high F coincided
with relatively high landings (1995-2012, Fig. 2) or low 4+ abundance (Fig. 12).
Figure 16. Estimated fishing mortality of four ages of Yellowtail Flounder in the southern Gulf of St.
Lawrence, 1985 to 2020. Solid lines and shading indicate the median and 95% confidence interval based
on Markov chain Monte Carlo (MCMC) sampling.
Reference Points for Yellowtail Flounder from NAFO Div. 4T
In the 2015 assessment reference points were estimated using the RV survey biomass index for
large Yellowtail (≥ 25 cm). The average biomass index in 1977-1997 was used as a proxy for
Bmsy, the biomass yielding maximum sustainable yield. In this assessment we have estimated
analogous reference points at the population scale (Fig. 17). The reference point was based on
the model estimates of biomass of the large (≥ 25 cm) size group. To be consistent with the
index-based reference point, biomass was projected forward to September. The Bmsy proxy was
14.28 kt. The estimated reference points were 11.42 kt for the Upper Stock Reference (USR) or
Busr (80% of Bmsy) and 5.71 kt for the Limit Reference Point (LRP) or Blim (40% of Bmsy). The
16Yellowtail Flounder
Gulf Region Southern Gulf of St. Lawrence
median estimate of large Yellowtail Flounder biomass was 39% of the LRP in 2020, and has
been below the LRP since 2008. The estimated probability that this population was below the
LRP was 0% in 2002 and 99% in 2016 to 2020 (Fig. 18).
Figure 17. Estimated September biomass of large (≥ 25 cm) Yellowtail Flounder in the southern Gulf of
St. Lawrence, 1985 to 2020. The black line is the median estimate and the shading is the 95% confidence
interval. Horizontal lines show the median estimates of reference points: dark blue for Bmsy, dark green for
Busr and dark red for Blim.
Figure 18. Estimated probability that September biomass of large (≥ 25 cm) Yellowtail Flounder in the
southern Gulf of St. Lawrence is below Blim.
17Yellowtail Flounder
Gulf Region Southern Gulf of St. Lawrence
Projections Relative to Different Catch Options
The population was projected forward ten years assuming that current productivity conditions
would persist over the projection period. Natural mortality was set at the levels estimated for the
2016 to 2020 time block. For each year and resampling iteration, population weights at age,
average individual weights in the fishery catch by length group, and recruitment rates were
randomly sampled from the estimated values in the last ten years (2011-2020). Projections were
conducted at three levels of annual fishery catch: 0 t, 100 t and 300 t.
Projections at catch levels of 0 t, 100 t, and 300 t show no perceivable difference in stock trends
over the next ten years. Estimated SSB declined by 50% over the projection period with no
fishery catch (Fig. 19). The estimated decline in SSB was virtually the same with annual catches
of 100 t or 300 t. The probability that the stock would remain below the LRP was estimated to be
100% in all years of the projection and at all three catch levels (Fig. 20). The median estimate of
biomass relative to the LRP was 37% in the first projection year declining to 20% in the last
projection year at all the annual fishery catch levels. At such levels of catch, natural mortality
appears to currently be the dominant factor affecting stock status at the scale of the sGSL.
Figure 19. Projected (2021 to 2030) SSB (kt) of southern Gulf of St. Lawrence Yellowtail Flounder at
three levels of annual fishery catch. The black line shows historical estimates and the circle and coloured
lines show projected estimates (median). Grey and blue shading show the 95% confidence intervals for
the historical period and the projection period with no catch, respectively. The dashed line and circle
indicate the lower confidence limit for projections with fishery catches of 100 or 300 t.
18Yellowtail Flounder
Gulf Region Southern Gulf of St. Lawrence
Figure 20. The projected September biomass of the large length class (≥ 25 cm) of Yellowtail Flounder.
The black line shows historical estimates and coloured lines show projected estimates (medians). Grey
and blue shading shows the 95% confidence intervals for the historical period and the projection with no
catch. The red dashed lines and yellow circles indicate the lower confidence limits and the medians for
projections with fishery catches of 100 or 300 t respectively. The red horizontal line is the Limit Reference
Point (5,710 t).
Sources of Uncertainty
Fishery catch has been at a relatively low level over the entire period modelled (1985-2020).
This makes it difficult to estimate the population scale (i.e., average population biomass). When
estimated freely, catchability (q) to the RV survey is estimated to be implausibly high (1.4). An
informative prior yields an estimate of fully-recruited catchability that is reasonable (0.46), but
the choice of the prior is based on little information. Nonetheless, although population scale
depends on q, the trends in population biomass are similar between different levels of q (e.g.,
compare with Surette and Swain 2016).
The age-structured length-based model is based on limited age-length data (i.e., age-length
samples restricted to 2000, 2007, 2013, 2015 and 2017). The data from these five years were
grouped together to obtain an average age-length relationship for the entire model period. This
assumes that there has been no systematic increase or decrease in size-at-age over time. The
failure to meet this assumption could result in biased estimates of changes in natural mortality.
While reliable data to test this assumption are limited, the data in the above years do not
indicate a systematic change in length at age (LAA). For example, LAA is low in 2013, high in
2015, and low again in 2017. The “coarse” length-age relationship used in the modelling also
mitigates impacts of interannual variation in LAA. Despite this variation, most fished aged 1 to 3
years are in the small length class and most fish aged 5 or more years are in the large length
class in the five years with LAA data.
19Yellowtail Flounder
Gulf Region Southern Gulf of St. Lawrence
Mandatory sorting and discarding of Yellowtail Flounder less than 23 cm has been in place in
the commercial fishery of the Magdalen Islands since 2014. This is not accounted for in the
fishery landings used as a data input to the population model. Instead, this unaccounted
mortality will be attributed to natural mortality by the population model. This may account for the
estimated increase in natural mortality of fish aged 1-3 years old in 2009-2014 and 2015-2020.
Recording weight of the discarded Yellowtail Flounder less than 23 cm could help improve such
source of uncertainty.
There is clear evidence of a sustained decline in the size at maturity of Yellowtail in the sGSL.
There is uncertainty regarding the reproductive value of the SSB for different ages and sizes.
There are uncertainties associated with the maturity staging practices in the survey which can
impact the perception of variations in size at maturity. It is difficult to distinguish immature from
resting stages of fish at small sizes during September when sampling occurs.
CONCLUSIONS AND ADVICE
Although the abundance of pre-commercial sizes (< 25 cm) of Yellowtail Flounder in the sGSL
increased for most of the period since 1985, commercial abundance has been in decline since
about 1980. Based on the model estimates, the abundance of fish 6 years and older has
declined by 95% since the mid-1980s. This decline appears to be on-going. Based on the
model, this decline in the abundance of older, larger fish is due to extreme increases in the
natural mortality of these fish from 21% annually early in the time series to 86% annually in the
last 12 years. Similar elevated natural mortality is widespread among large individuals of many
fish species in the sGSL. There is strong evidence that predation by grey seals is an important
cause of this elevated mortality.
SSB was relatively high in the mid-2000s but has declined by 50% since then. Furthermore the
age composition of the spawning stock has changed from one with a high proportion of older,
larger fish to one dominated by younger smaller fish.
Fishing mortality is estimated to be low on all ages of Yellowtail Flounder. It is at negligible
levels for young ages and reaches a maximum of 0.13 for the oldest age (8+). At the current
level of natural mortality, projections indicate that catches of 100 or 300 t have a negligible
impact on the population trajectory.
The population in 2020 is estimated to be 39% of the LRP with a 99% probability that it is below
the LRP. The probability that the stock remained below the LRP during the projection to 2030
was 100% in all years at all catch levels from 0 t to 300 t. The estimated population level in 2030
was about 20% of the LRP.
At the scale of the sGSL, natural mortality appears to be the dominant factor affecting Yellowtail
Flounder stock status.
20Yellowtail Flounder
Gulf Region Southern Gulf of St. Lawrence
LIST OF MEETING PARTICIPANTS
Name Affiliation
Mark Laflamme DFO Science - Gulf
Mélanie Roy DFO Science - Gulf
Nicolas Rolland DFO Science - Gulf
Doug Swain DFO Science - Gulf
Daniel Ricard DFO Science - Gulf
Jenni McDermid DFO Science - Gulf
Francois Turcotte DFO Science - Gulf
Rémi Sonier DFO Science - Gulf
Elizabeth Thompson DFO Science - Gulf
Daniel Lapierre DFO FAM - Gulf
Cédric Arseneau DFO FAM - Québec
Stéphanie Labbé-Giguère DFO FAM - Québec
Dominic Cyr DFO FAM - Québec (IDM)
Denyse Hébert DFO FAM - Québec (IDM)
Ryan Chleback DFO NCR
David MacEwen Government of PEI
Adam Mugridge Government of NS
Alain Arseneau Industry
André Bourgeois Industry
Réjean Turbide Industry
SOURCES OF INFORMATION
This Science Advisory Report is from the February 16, 2021 regional advisory meeting on the
stock assessment of Yellowtail Flounder (Limanda ferruginea) in the southern Gulf of
St. Lawrence (NAFO Div. 4T). Additional publications from this meeting will be posted on the
Fisheries and Oceans Canada (DFO) Science Advisory Schedule as they become available.
Benoît, H.P. 2006. Standardizing the southern Gulf of St. Lawrence bottom-trawl survey time
series: results of the 2004-2005 comparative fishing experiments and other
recommendations for the analysis of the survey data. DFO Can. Sci. Advis. Sec. Res. Doc.
2006/008: 127 p.
Benoît, H.P., and Swain, D.P. 2003. Standardizing the southern Gulf of St. Lawrence bottom-
trawl survey time series: adjusting for changes in research vessel, gear and survey protocol.
Can. Tech. Rep. Fish. Aquat. Sci., 2505: iv + 95 p.
DFO. 2002. Yellowtail Flounder in the southern Gulf of St. Lawrence. DFO Science Stock Status
Report A3-16 (2002).
DFO. 2005. Yellowtail Flounder in the southern Gulf of St. Lawrence. DFO Can. Sci. Advis. Sec.
Sci. Advis. Rep. 2005/010.
DFO. 2014. Updated indices of abundance to 2013 for stocks of six groundfish species
assessed by DFO Gulf Region. DFO Can. Sci. Advis. Sec. Sci. Resp. 2014/028.
DFO. 2015. Updated indices of abundance to 2014 for stocks of six groundfish species
assessed by DFO Gulf Region. DFO Can. Sci. Advis. Sec. Sci. Resp. 2015/015.
21Yellowtail Flounder
Gulf Region Southern Gulf of St. Lawrence
DFO. 2016. Stock assessment of Yellowtail Flounder (Limanda ferruginea) of the southern Gulf
of St. Lawrence (NAFO Div. 4T) to 2015. DFO Can. Sci. Advis. Sec. Sci. Advis. Rep.
2016/033.
DFO. 2019. Updated indices of abundance to 2018 for American Plaice and Yellowtail Flounder
from NAFO Div. 4T. DFO Can. Sci. Advis. Sec. Sci. Resp. 2019/006.
Neuenhoff, R. D., Swain, D.P., Cox, S.P., McAllister, M.K., Trites, A.W., Walters, C.J. and
Hammill, M.O. 2019. Continued decline of a collapsed population of Atlantic cod (Gadus
morua) due to predation-driven Allee effects. Canadian Journal of Fisheries and Aquatic
Sciences. 76: 168-184.
Poirier, G., and Morin, R. 2002. The status of yellowtail Flounder in NAFO Division 4T in 2001.
DFO Can. Sci. Advis. Sec. Res. Doc. 2002/034. 40 p.
Scott, W.B., and Scott, M.G. 1988. Atlantic Fishes of Canada. University of Toronto Press,
Scholarly Publishing Division.
Surette, T., and Swain, D. 2016. The Status of Yellowtail Flounder in NAFO Division 4T to 2015.
DFO Can. Sci. Advis. Sec. Res. Doc. 2016/058. x + 74 p.
Swain, D.P. 2011. Life-history evolution and elevated natural mortality in a population of Atlantic
cod (Gadus morhua). Evolutionary Applications 4: 18-29.
Swain, D.P. & Benoît, H.P. 2015. Extreme increases in natural mortality prevent recovery of
collapsed fish populations in a Northwest Atlantic ecosystem. Marine Ecology Progress
Series, 519, 165-182.
22Yellowtail Flounder
Gulf Region Southern Gulf of St. Lawrence
THIS REPORT IS AVAILABLE FROM THE:
Center for Science Advice (CSA)
Gulf Region
Fisheries and Oceans Canada
P.O. Box 5030, Moncton (NB) E1C 9B6
Telephone: 506-851-6201
E-Mail: DFO.GLFCSA-CASGOLFE.MPO@dfo-mpo.gc.ca
Internet address: www.dfo-mpo.gc.ca/csas-sccs/
ISSN 1919-5087
ISBN 978-0-660-38968-4 Cat. No. Fs70-6/2021-022E-PDF
© Her Majesty the Queen in Right of Canada, 2021
Correct Citation for this Publication:
DFO. 2021. Stock Assessment of Yellowtail Flounder (Limanda ferruginea) of the southern Gulf
of St. Lawrence (NAFO Div. 4T) to 2020. DFO Can. Sci. Advis. Sec. Sci. Advis. Rep.
2021/022.
Aussi disponible en français :
MPO. 2021. Évaluation du stock de limande à queue jaune (Limanda ferruginea) du sud du
golfe du Saint-Laurent (Division 4T de l'OPANO) jusqu'en 2020. Secr. can. de consult. sci.
du MPO. Avis sci. 2021/022.
23You can also read