Changing Times - New Uncertainties: Assessing Their - NET
←
→
Page content transcription
If your browser does not render page correctly, please read the page content below
Changing Times – New
                               Uncertainties: Assessing Their
                               Effects on Global Energy and
                               LNG Export Markets

                                           LSI Energy Markets and Regulation
                                           in Alaska Conference

                                           Paul R. Carpenter
                                           Steven H. Levine
                                           Anul Thapa

                                           December 8, 2014

Copyright © 2013 The Brattle Group, Inc.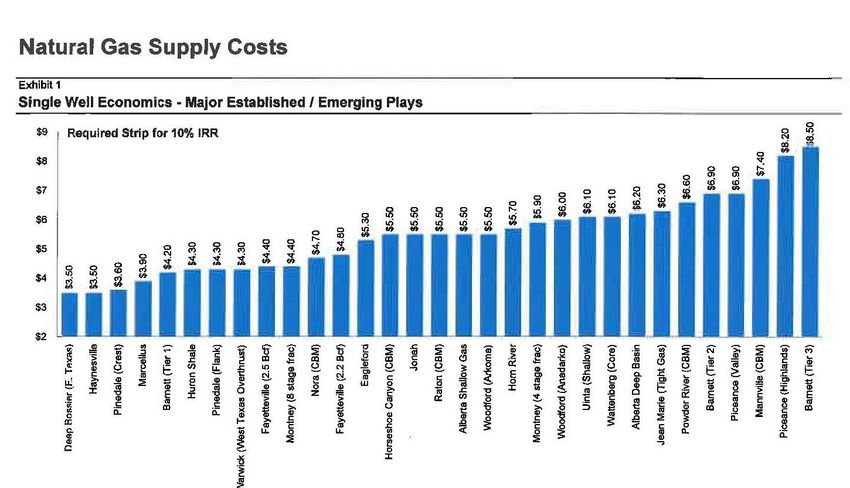
This week’s Economist cover

                              1 | brattle.com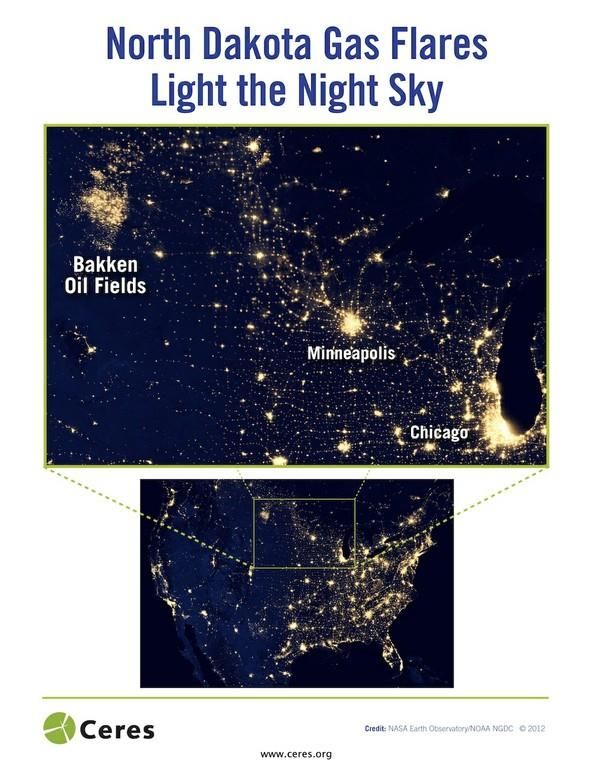
Agenda

▀   Changing times – new uncertainties

▀   The global price paths of oil and natural gas

    − Are the gaps closing? Domestic oil vs. gas? Global gas?

▀   Oil prices and shale gas production

▀   China’s gas status and Russia’s “Eastern Pivot”

▀   Implications for LNG export projects and Alaska

                                                                2 | brattle.com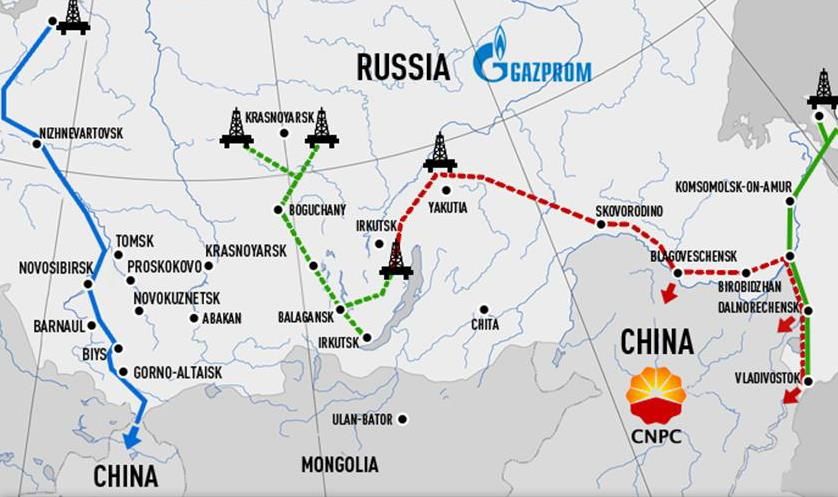
Changing Times, New Uncertainties
▀ Dec 2011 Conference
− “The Uncertain Future of ANS Natural Gas in the Lower-48”
Competition from shale gas in Lower-48
▀ Dec 2012 Conference
− “The Uncertain Future for ANS LNG Exports”
Competition from proposed LNG export projects
▀ Dec 2014: Have any of the risks been resolved? What new
uncertainties do we need to assess?
3 | brattle.com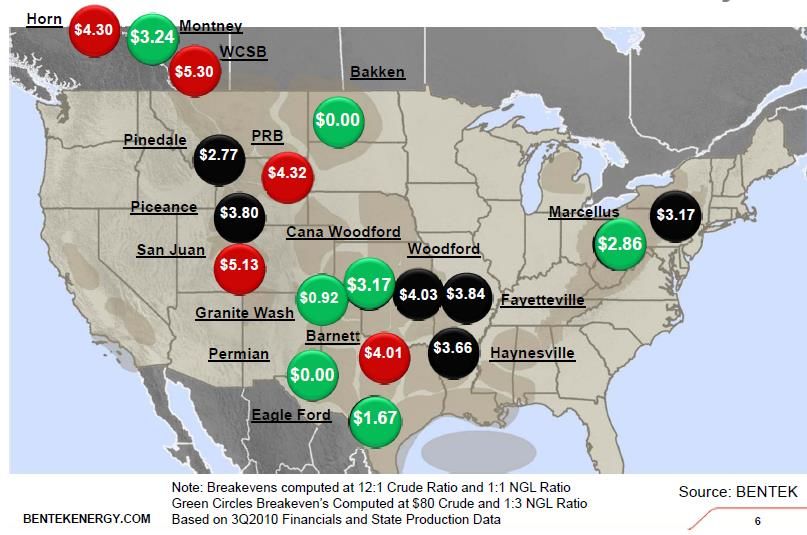
Known Unknowns

A man was reprieved from a death sentence by the King of France, on
condition that within a year he teach the King’s favorite horse to
speak. “Don’t worry about it,” he told a friend, “Within a year the
King may die, or the horse may die, or I may die – or the horse may
speak!”
- M. A. Adelman, The Supply and Price of Natural Gas, Oxford: Basil Blackwell,
1962, p.9.

Even if the need is not urgent, it is important to look through the
medium to the long-term. The indefiniteness of the long-term does
not make it any less real!

                                                                           4 | brattle.com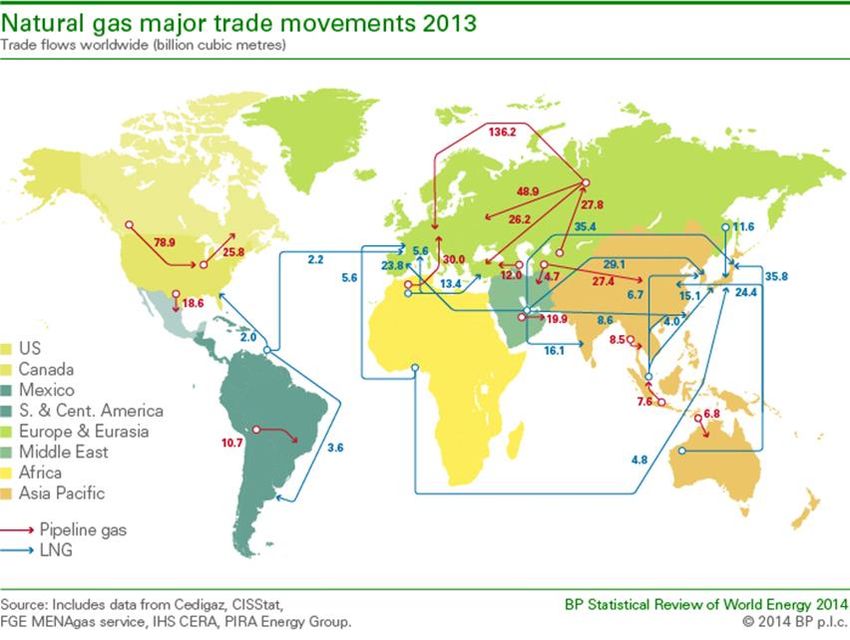
Summary of Uncertainties Facing LNG
  Export Projects – A recap from last time
Demand Uncertainty
  ▀   Need for LNG post-2020 is very uncertain (e.g., China’s needs will depend upon its natural gas demand growth as well as
      growth in its indigenous production) – Growth now shows signs of slowing, indigenous production uncertainty remains
Competition Uncertainty
  ▀   Competition between Australia, British Columbia, Gulf Coast, Alaska and other LNG projects – Shakeout about to occur?
  ▀   Competition from indigenous production and pipeline import options – Sino/Russian gas deals now a reality, but execution
      uncertain

Pricing/ Project Economics Uncertainty
  ▀   Oil-linked or gas-linked – Are we witnessing the start of long-term convergence?
  ▀   Panama Canal toll uncertainty – In the process of resolution
  ▀   Project cost uncertainty (e.g., Australian cost overruns) – A reality. Will it be repeated in other greenfield projects?

Upstream Infrastructure Development Uncertainty
  ▀   Infrastructure challenges seen for British Columbia and Alaskan LNG exports since contingent upon large pipeline build-out –
      Challenge has grown in BC. Alaska?
  ▀   Possible siting advantage in U.S. Gulf Coast due to existing infrastructure – Confirmed

Level of Government Support
  ▀   Large “stranded gas” advantage in British Columbia and Alaska, but pipeline infrastructure disadvantage -- Unchanged
  ▀   Uncertainty in U.S. export permit process – Approvals, and more clarity

                                                                                                                          5 | brattle.com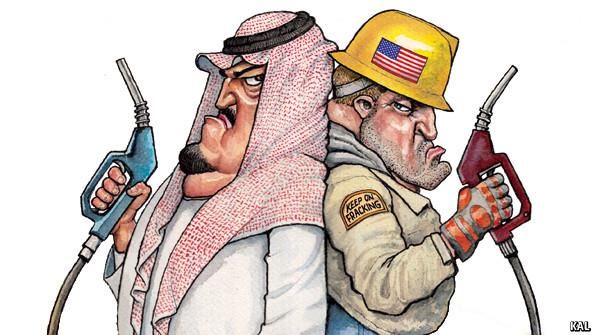
The Global Price Paths of Oil and Gas

• Not on my Dec 2012 list was uncertainty over the long-run
  persistence of the oil/gas price “gap” – critical to new LNG
  exports because they are all about geographic price arbitrage
  between oil-linked Asian contract prices and North American
  gas prices

• We’re now in the midst of another global oil price “event”
   – How likely is it to be sustained, and what will be its affects?
Is the “Gap” Closing?

                        7 | brattle.com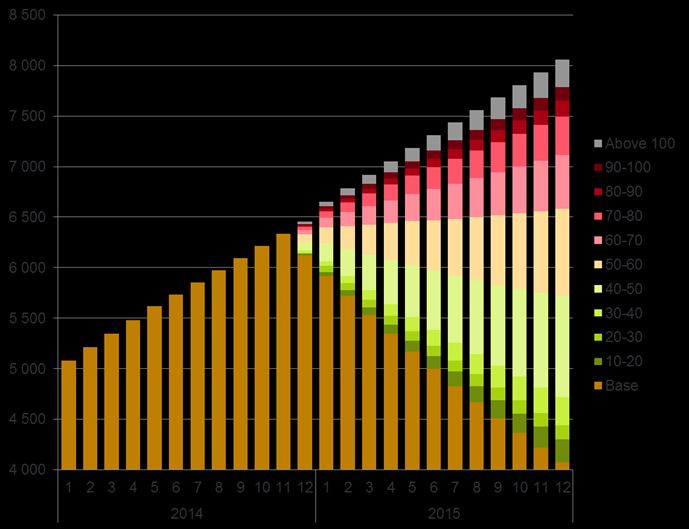
Some Simple LNG Arithmetic
US Gulf Coast Project:
   HH Price                      $4.00 - $6.00/MMBtu
   115% HH                        4.60 – 6.90
   Liquefaction cost              3.50
   Transport to Asia              2.30
       Delivered price           $10.40 - $12.70/MMBtu
 [Cheniere is quoted as forecasting its delivered price in Asia at $11.90 based
 on $4.00 HH]
 Oil-linked Asian Contracts:
   Brent at $75 = $11/MMBtu in Japan [Credit Suisse]
            $85 = $13
            $60 = $10

                                                                              8 | brattle.com
Recent Oil Price Decline Not Just a “Spot”
Phenomenon
9 | brattle.comProf. Morris Adelman (MIT) had it right 40 years ago
“Once the [oil] price leaped ahead (with the 1st Arab embargo), I
suggested that it would fluctuate in a wide band between a competitive
floor and a monopoly ceiling. “
“I wrote in 1973, before the embargo: The monopoly ceiling is set by the
competition for more expensive sources of crude oil, or by consumers’
reducing their expenditures on oil products. This ceiling is very far above
even the current price, and hence we must expect the cartel to keep
raising the price throughout the 1970’s. But for the longer run, the
crystal ball becomes clouded, because there are factors working both to
strengthen and to weaken the cartel. The net effect is a residual, which
is basically unstable. Small changes can produce large effects. But at
least we can try to set out what forces are worth watching carefully.”
- M.A. Adelman, The Economics of Petroleum Supply, MIT Press, 1993.
10 | brattle.comWhat forces should we be watching for today?
▀ OPEC crude and US shale oil are very much in direct competition
▀ What is our market share?
▀ The competitive floor price may be quite low in the short run. What
is the floor in the long run?
▀ Shale technology has made the US a low(er) cost supplier. But are
the Saudi’s costs even lower?
▀ How far do prices have to fall for US shale oil production to be
affected?
11 | brattle.comU.S. is the now largest producer of petroleum and natural gas in the world
estimated U.S., Russia, and Saudi Arabia petroleum and natural gas production
quadrillion Btu million barrels per day of oil equivalent
60.0 30
United States
Russia
50.0 25
Saudi
Arabia
40.0 20
30.0 15
natural
gas
20.0 10
10.0
petro- 5
leum
0.0 0
2008 2009 2010 2011 2012 2013 2014e
Source: U.S. Energy Information Administration
Note: Petroleum production includes crude oil, natural gas liquids, condensates, refinery processing gain, and other liquids,
including biofuels; barrels per day oil equivalent were calculated using a conversion factor of 1 barrel oil equivalent=5.55
million British thermal units (Btu)
Independent Petroleum Association of America
November 13, 2014Effect of low oil prices on North American shale oil production
US+CA, oil+NGLs from tight plays (kbbld)
Brent-indexed
breakeven prices:
Source: Rystad Energy North America Quarterly Shale Report
13Production cost is not the whole story
▀ Much of US production is hedged forward, and so short-term
declines in oil prices may not affect production volume until hedges
start running off (2016?)
But:
▀ There are already reports of 2015 drilling and development budget
cutbacks
▀ There may be a financial contagion if low oil prices are sustained [J.P.
Morgan]
− AtOil Prices and Shale Gas Production
▀ What happens to the lower-48 natural gas price if oil prices stay
low?
▀ The most valuable shale gas wells have been those in liquids-rich
plays (60% of new gas wells produce both oil and gas – EIA)
− Marcellus
− Eagle Ford
▀ If oil prices fall to $50-60/bbl, gas prices may have to rise to $5.00-
$6.00/MMbtu to break even [FACTS Global Energy estimate]
15 | brattle.comShale Gas Breakeven at $80 Oil
16 | brattle.comThe result of a $0.00 Bakken breakeven
17 | brattle.comOne potential supply curve
18 | brattle.comShale Changed U.S. Outlook in World Gas Markets
Pre-shale EIA outlook of 12-18 Bcf/d of net imports by 2025;
April 2014 outlook of 9 Bcf/d of net exports by 2030
19 | brattle.comBut what were the EIA’s assumed oil and gas prices?
(2012 $/Bbl, $/MMBtu) 2020 2030
Brent Reference Case $ 97 $119
Brent High Oil Case $150 $174
Brent Low Oil Case $ 69 $ 72
HH Reference Case $4.38 $6.03
HH High Oil Case $4.73 $6.88
HH Low Oil Case $4.35 $5.75
US DOE EIA, Annual Energy Outlook 2014, April 2014, Table C-1
20 | brattle.comMajor Natural Gas Trade Flows in 2013
▀ Three distinct regional markets, Asia (oil-linked contract prices), Europe (mix of
oil-linked and spot gas pricing), and North America (Henry Hub + “basis” pricing)
▀ Some diversions of spot cargoes between regions (spot market)
− ~27% by volume in spot/short-term trades in 2013
Source: BP Statistical Review of World Energy 2014. 21 | brattle.comIEA Gas Demand Forecast (Golden Rules Case)
Shows Largest Demand Growth in Asia
Natural Gas Demand by Region ▀ Gas demand growth to 2035 expected to
in the Golden Rules Case be particularly strong in China (47 Bcf/d),
(Bcf/d) Middle East (27 Bcf/d), and India (13
2035 Demand
less
Bcf/d)
Region/Country 2010 2035 2010 Demand
[1] [2] [3] [4] ▀ But gas demand growth is highly
uncertain and can be met by indigenous
Americas [a] 81 102 20
United States 66 76 10
production, pipeline imports and/or LNG
[b]
Europe [c] 56 67 11 imports
Asia Oceania [d] 17 23 6
Japan [e] 10 13 3 ▀ Part of the uncertainty relates to electric
OECD [f] 155 192 37 sector gas demand (and the future
E. Europe/Eurasia 64 84 20
[g] generation mix of nuclear, coal, gas and
Russia [h] 43 54 11 renewables)
Asia [i] 39 116 77
China [j] 11 57 47 ▀ LNG market growth likely to depend
India 6 19 13
[k] heavily on China and India demand
Middle East [l] 35 62 27
Africa [m] 10 16 6 growth
Latin America [n] 14 24 10
Non-OECD [o] 162 303 141 ▀ Japan and South Korea (currently ~50%
World [p] 316 495 178 of LNG demand) forecasted to grow at
Sources:
much slower pace
[2] - [3]: World Energy Outlook 2012_GoldenRulesReport p78
▀ Europe also forecasted to grow but at
slower pace 22 | brattle.comPotential Import Growth in Key Asian Countries
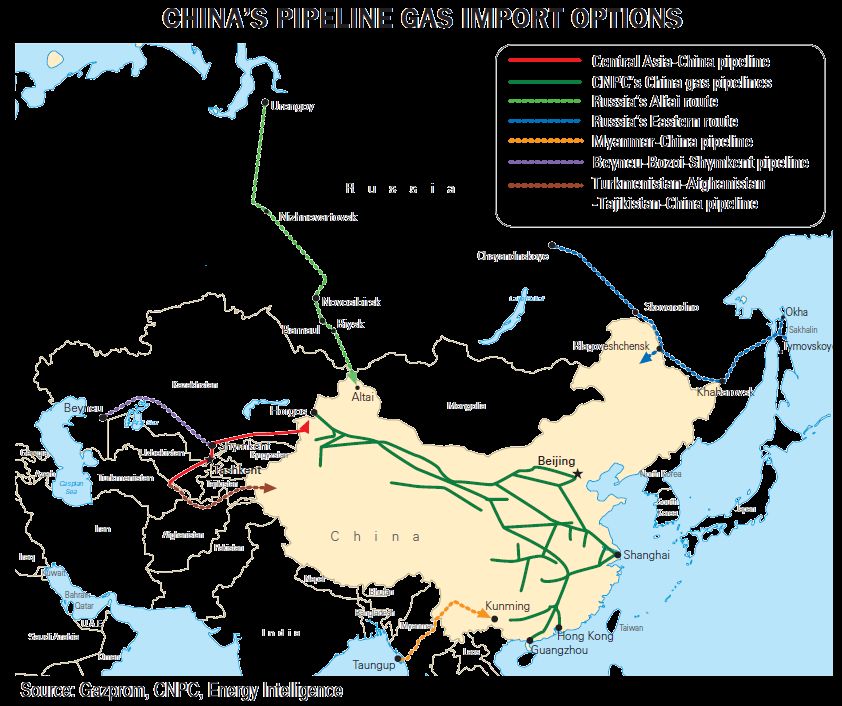
23 | brattle.comChina’s Gas History
24 | brattle.comSignificant Uncertainty in Unmet Gas Demand
Post-2020
Global LNG outlook depends in part on supply-
demand dynamics in China
▀ China has competitive alternatives for gas
supply—pipeline imports and LNG options
▀ Recently signed a 30-year deal with Russia for
pipeline gas for ~3.7 Bcf/d (beginning 2019)
▀ Gas started flowing on the Myanmar-China
pipeline on July 28, 2013 (expected to receive
~0.4 Bcf/d over 30-years).
▀ China LNG imports from Australia set to
increase by ~2+ Bcf/d by 2017
▀ Russian LNG also an alternative for China
▀ Some estimates suggest China has 1,115 Tcf of
shale gas reserves (~10x the size of Marcellus)
▀ But, difficulty in realizing this potential
Source: “China Keeps Import Options Wide Open,” World Gas Intelligence, July 25, 2012
▀ Demand for natural gas/LNG is also uncertain
▀ Environmental considerations -> + demand
▀ Competition with renewables -> - demand
25 | brattle.comRussia’s Eastern Gas Strategy
▀ Develop significant Siberian gas reserves and sell to Asian markets
▀ Requires significant scale to achieve economies due to infrastructure
requirements
▀ Chinese pipeline deals viewed as key to achieving reserve
development scale to make LNG exports from east coast viable
− Accelerated in importance to Putin after Ukraine/sanctions
response by EU and West
26 | brattle.comSource: Russia Today
27 | brattle.comRussia is a Major Supplier of Natural Gas in Europe;
LNG is a Small Component of Supply
28 | brattle.comEuropean LNG Imports Have Declined;
LNG is Being Re-Exported
LNG Imports by European Countries LNG Re-Exports by European Countries
▀ Oversupply due to long-term supply commitments, declining natural
gas demand (from economic downturn, renewables, cheap coal, low
CO2 prices, etc.)
▀ Strong competition from Asian/South American market Re-
exports to Asia and South America 29 | brattle.comLow Utilization of European LNG Import Terminals
Utilization of European LNG Import Terminals
Number of Import 2013 Utilization
LNG Import Capacity LNG Imports of
Country Terminals (Bcf/d) (Bcf/d) Terminals
[a] [b] [c] [d]
Belgium [1] 1 0.87 0.31 35.7%
France [2] 3 2.30 0.85 36.8%
Greece [3] 1 0.48 0.06 11.6%
Italy [4] 3 1.49 0.53 35.8%
Netherlands [5] 1 1.16 0.04 3.8%
Portugal [6] 1 0.74 0.18 25.0%
Spain [7] 6 5.81 1.45 24.9%
Turkey [8] 2 1.18 0.59 49.6%
United Kingdom [9] 4 5.17 0.90 17.4%
Total Europe [10] 22 19.21 4.90 26.74%
Sources and Notes:
[1]-[9],[a]-[b]: GIIGNL 'The LNG Industry 2013'
Source: GIIGNL ‘The LNG Industry 2013’
[1]-[2],[4],[7]-[9],[c]: BP Statistical Review of World Energy 2014
[3],[5],[6],[c]: GIIGNL 'The LNG Industry 2013'
[10],[d]: Average for Europe
30 | brattle.comLNG Supply Competition
Australia
▀ 9 Bcf/d of LNG export projects under construction (with on-line dates 2014-2016)
− Large projects (capital costs of $20-$60 billion per project)
− Projects facing substantial cost overruns
− Not all fully subscribed (e.g., Gorgon LNG)
− Asian buyers looking for cheaper alternatives
▀ 5 Bcf/d proposed
▀ 3 Bcf/d currently operational
Canada
▀ 21-37 Bcf/d of proposed LNG export projects
− Most in British Columbia; some in Nova Scotia
▀ None under construction
▀ Chinese companies participating in some Canadian projects
− PetroChina (LNG Canada), Sinopec (Pacific NorthWest LNG), CNOOC (Aurora LNG)
31 | brattle.com~43 Bcf/d of Proposed U.S. LNG Export Capacity
Most (35 Bcf/d) proposed in the Gulf Coast
▀ 1.7 Bcf/d East Coast, 2.5 Bcf/d West Coast, 2.5 Bcf/d project in Alaska
One plant under construction (Sabine Pass); one about to start
construction (Freeport); another (Cameron LNG) has made its final
investment decision
8 (10.6 Bcf/d) with DOE approval for exports to non-FTA countries
▀ Sabine Pass (2.2 Bcf/d), Freeport (1.8 Bcf/d), Lake Charles (2.0 Bcf/d),
Cameron (1.7 Bcf/d), Cove Point (0.8 Bcf/d), Jordan Cove (0.8 Bcf/d),
Oregon LNG (1.3 Bcf/d), and Carib Energy (0.04 Bcf/d).
4 (6.5 Bcf/d) with FERC approval
▀ Sabine Pass (2.2 Bcf/d), Freeport (1.8 Bcf/d), Cameron (1.7 Bcf/d),
Dominion Cove Point (0.8 Bcf/d)
32 | brattle.comContracts/Agreements by Project
Contracted Contracted
Capacity Capacity
Project Importing Entity Type of Buyer Bcf/d Project Importing Entity Type of Buyer Bcf/d
[1] GASNATURAL FENOSA Portfolio 0.5 [15] Japan LNG Investment LLC (Mitsubishi Corp/NYK) Asian 0.5
[2] GAIL Asian 0.5 Cameron [16] Mitsui & Company, Ltd. Asian 0.5
[3] KOGAS Asian 0.5 [17] GDF SUEZ Portfolio 0.5
Sabine Pass
[4] BG Group Portfolio 0.7
[5] Total Portfolio 0.3 [18] GASNATURAL FENOSA Portfolio 0.2
[6] Centrica European 0.2 [19] Pertamina Asian 0.2
[20] Endesa Generacion SA European 0.3
Corpus Christi
[7] Osaka Gas Asian 0.3 [21] Iberdrola SA European 0.1
[8] Chubu Electric Asian 0.3 [22] Woodside Energy Trading Singapore Pte. Ltd Portfolio 0.1
Freeport [9] BP Portfolio 0.6 [23] Électricité de France European 0.1
[10] SK E&S LNG Asian 0.3
[11] Toshiba Corporation Asian 0.3 [24] GASNATURAL FENOSA Portfolio 0.2
[25] GUNVOR Portfolio 0.2
Magnolia
Lake Charles [12] BG Group Portfolio 1.9 [26] LNG Holdings Corp Portfolio 0.2
[27] AES Latin American Development, Ltd Other 0.1
[13] GAIL Asian 0.3
Cove Point
[14] Sumitomo Corporation Asian 0.3 Total [28] 10.2
Sources and Notes:
[1]-[27]: The Brattle Group Research, GIIGNL reports, company websites.
[1]-[27]: Includes both binding and non-binding contracts and agreements.
[1]-[27]: Includes LNG sales contracts and tolling agreements.
[3]: Adjusted to reflect sale of KOGAS' capacity at Sabine Pass to Total
[14]: Sumitomo has sold almost all of its capacity at Cove Point to Tokyo Gas and Kansai Electric
[15],[16]: Tokyo Electric Power has bought capacity from both Mitsubishi and Mitsui at Cameron
Tokyo Gas has bought capacity from Mitsui at Cameron
[24],[25]: Does not include interruptible capacity
▀ Majority of the contracts (5.5 Bcf/d) are with portfolio players (e.g., BG, BP) with no
specific destinations
▀ 3.9 Bcf/d contracted by Asian buyers
▀ 0.7 Bcf/d contracted by European buyers
33 | brattle.comImplications for LNG Projects and Alaska
▀ Timing is everything: there may be a near-term supply glut as Australian
and US projects come on stream
− Asian spot LNG price has already dropped below $10.00/MMBtu
▀ If oil/gas price gap stays closed, then there will be an LNG project
“shakeout” in the US and Canada
− Petronas just announced the delay of FID for its Pacific Northwest LNG
project in BC, saying that at $70 oil the project was not economic
▀ Given the post-2025 timing of the Alaska LNG project, perhaps a shakeout of
the first-moving competition would be a good thing?
▀ When uncertainties reign, there is option value in waiting.
34 | brattle.comWith constant changes in supply, demand and technology, relative advantages
must change, and some fuels or demands or sellers are under pressure to give
ground to others…. An orderly retreat is, of all military manoeuvers, the
hardest to carry out.
- M.A. Adelman, The Supply and Price of Natural Gas, Oxford: Basil
Blackwell, 1962.
35 | brattle.comThe Brattle Group
The Brattle Group provides consulting and expert testimony in economics, finance, and regulation to
corporations, law firms, and governments around the world.
Many of our engagements are related to energy and utility regulation in such areas as:
Climate Change Policy and Planning Regulatory Strategy and Litigation Support
Cost of Capital Renewables
Energy Asset Valuation Risk Management
Fuel and Power Procurement Market Design and Competitive Analysis
Paul Carpenter specializes in the economics of the natural gas, oil and electric utility industries. He holds a PhD in
Applied Economics and an MS in Management from the Massachusetts Institute of Technology, and a BA in
economics from Stanford University. He is a Principal and Chairman of The Brattle Group
Steven Levine is a Principal of The Brattle Group who specializes in energy and regulatory economics, with a
particular focus on the natural gas and petroleum industries. He received a B.A. in economics from Brandeis
University and an M.B.A. with a concentration in finance from Columbia Business School.
Anul Thapa is an Associate of The Brattle Group with expertise in the regulation and economics of the natural gas
and electricity markets. He received an MBA with a concentration in finance from MIT Sloan School of
Management and a B.A. magna cum laude in Mathematics and Computer Science from DePauw University.
36 | brattle.comAppendix
37 | brattle.com~43 Bcf/d of Proposed U.S. LNG Export Capacity
Capacity Capacity
FTA Non-FTA Status Status Status Announced
Project (Bcf/d) (Bcf/d) FTA non-FTA FERC Online Date
[1] [2] [3] [4] [5] [6] [7]
Lower 48:
Sabine Pass Liquefaction, LLC [a] 2.2 2.2 Approved Approved Approved 2016/2017
Sabine Pass Liquefaction, LLC [b] 1.4 1.4 Approved Under DOE Review Under FERC Review
Freeport LNG Expansion, L.P. and FLNG Liquefaction, LLC [c] 2.8 1.8 Approved Approved Approved 2018
Lake Charles Exports, LLC [d] 2.0 2.0 Approved Approved Under FERC Review 2019
Dominion Cove Point LNG, LP [e] 1.0 0.8 Approved Approved Approved 2017
Carib Energy (USA) LLC [f] 0.0 0.0 Approved Approved Not Required
Jordan Cove Energy Project, L.P. [g] 1.2 0.8 Approved Approved Under FERC Review 2017
Cameron LNG, LLC [h] 1.7 1.7 Approved Approved Approved 2019
Gulf Coast LNG Export, LLC [i] 2.8 2.8 Approved Under DOE Review Not Filed 2018
Gulf LNG Liquefaction Company, LLC [j] 1.5 1.5 Approved Under DOE Review Under FERC Review 2019/2020
LNG Development Company, LLC (d/b/a Oregon LNG) [k] 1.3 1.3 Approved Approved Under FERC Review 2019
SB Power Solutions Inc [l] 0.1 n/a Approved n/a Not Filed
Southern LNG Company, L.L.C. [m] 0.5 0.5 Approved Under DOE Review Under FERC Review
Excelerate Liquefaction Solutions I, LLC [n] 1.4 1.4 Approved Under DOE Review Under FERC Review 2018
Golden Pass Products LLC [o] 2.0 2.0 Approved Under DOE Review Under FERC Review 2018/2020
Cheniere Marketing, LLC [p] 2.1 2.1 Approved Under DOE Review Under FERC Review 2018
Main Pass Energy Hub, LLC / Freeport-McMoran Energy LLC [q] 3.2 n/a Approved n/a Not Filed 2016/2017
CE FLNG [r] 1.1 1.1 Approved Under DOE Review Under FERC Review 2018
Waller LNG Services, LLC [s] 0.2 0.2 Approved Under DOE Review Not Filed
Pangea LNG (North America) Holdings, LLC [t] 1.1 1.1 Approved Under DOE Review Not Filed 2019/2020
Magnolia LNG, LLC [u] 0.5 n/a Approved n/a Under FERC Review 2018
Magnolia LNG, LLC [v] 0.5 1.1 Approved Under DOE Review Under FERC Review 2018
Gasfin Development USA, LLC [w] 0.2 0.2 Approved Under DOE Review Not Filed 2019
Venture Global LNG, LLC [x] 1.3 1.3 Approved Under DOE Review Under FERC Review 2019
Advanced Energy Solutions [y] 0.0 n/a Approved n/a Not Filed
Argent Marine Management, Inc. [z] 0.0 n/a Approved na Not Filed
Eos LNG LLC [aa] 1.6 1.6 Approved Under DOE Review Not Filed
Barca LNG LLC [ab] 1.6 1.6 Approved Under DOE Review Not Filed
Delfin LNG LLC [ac] 1.8 1.8 Approved Under DOE Review Not Filed 2017/2021
Annova LNG LLC [ad] 0.9 n/a Approved n/a Not Filed 2019
Texas LNG LLC [ae] 0.3 0.3 Approved Under DOE Review Not Filed 2018
Louisiana LNG Energy LLC [af] 0.3 0.3 Approved Under DOE Review Under FERC Review
Alturas LLC [ag] 0.2 n/a Pending Approval n/a Not Filed
Strom Inc. [ah] 0.1 0.0 Approved Under DOE Review Not Filed
SCT&E LNG, LLC [ai] 0.7 0.7 Pending Approval n/a Not Filed
Sabine Pass Liquefaction, LLC [aj] 0.6 n/a Pending Approval n/a Under FERC Review
Downeast LNG, Inc. [ak] 0.5 0.5 Pending Approval Under DOE Review Under FERC Review
Subtotal (Lower 48) [al] 40.6 33.5
Alaska [am] 2.5 2.5 Under FERC Review 2021/2024
Total United States [an] 43.1 36.0
38 | brattle.com~29 Bcf/d to 45 Bcf/d Proposed in Canada LNG LNG
Capacity Capacity
Project Province Ownership Start Year (mmtpa) (Bcf/d) Status/Notes
[1] [2] [3] [4] [5] [6]
Shell / KOGAS / Mitsubishi /
LNG Canada [a] British Columbia 2019 12.0 - 24.0 1.6 - 3.1 25 year export license approved
PetroChina
Originally
PETRONAS / SINOPEC / JAPEX/
Pacific Northwest LNG [b] British Columbia 2019 but 13.1 - 19.7 1.7 - 2.5 25 year export license approved
Indian Oil/ PetroleumBrunie
FID Delayed
Kitimat LNG [c] British Columbia Chevron and Apache Corp 2017 5.0 - 10.0 0.6 - 1.3 20 year export license approved
Prince Rupert LNG [d] British Columbia BG Group 2020 14.0 - 21.6 1.8 - 2.8 25 year export license approved
LNG Partners / Haisla Nation 20-year export license approved
Douglas Channel LNG [e] British Columbia 2016 0.9 - 1.8 0.1 - 0.2
/AltaGas (for 1.8 mmtpa)
Exxon Mobil Canada / Imperial Oil 25 year export license approved
WCC LNG [f] British Columbia 2021 10.0 - 30.0 1.3 - 3.9
Resources (for 30.0 mmtpa)
Woodfibre LNG [g] British Columbia Woodfibre Natural Gas Limited 2017 2.1 0.3 25 year export license approved
Triton LNG [h] British Columbia AltaGas / Idemitsu Kosan 2017 2.3 0.3 25 year export license approved
CNOOC / INPEX / JGC Exploration
Aurora LNG [i] British Columbia 2021 24.0 3.1 25 year export license approved
Canada
Kitsault Energy [j] British Columbia Krishnan Suthanthiran 2018 10.0 - 20.0 1.3 - 2.6 Applied for 25 year export license
WesPac Midstream –
[k] British Columbia WesPac Midstream LLC 2016 3.0 0.4 Applied for 25 year export license
Vancouver LLC
Steelhead LNG Limited
Steelhead LNG [l] British Columbia 2019 30.0 3.9 Applied for 25 year export license
Partnership
Cedar LNG Export Development
Cedar LNG [m] British Columbia 2020 14.5 1.9 Applied for 25 year export license
Ltd.
Woodside Energy
[n] British Columbia Woodside Petroleum Ltd. 2021 15.0 - 20.0 1.9 - 2.6 Applied for 25 year export license
Holdings Pty Ltd
Discovery LNG [o] British Columbia Quicksilver Resources Canada Inc. 2021 5.0 - 20.0 0.6 - 2.6 Applied for 25 year export license
Orca LNG [p] British Columbia Orca LNG Ltd. 2019 24.0 3.1 Applied for 25 year export license
Canada Stewart Energy Application incomplete.
[q] British Columbia Canada Stewart Energy Group Ltd 2017 5.0-30.0 0.6 - 3.9
Group Resubmission not filed yet
Goldboro LNG [r] Nova Scotia Pieridae Energy Limited 2019 5.0 - 10.0 0.6 - 1.3 Applied for 20 year export license
Bear Head LNG [s] Nova Scotia Liquefied Natural Gas Limited 2019 12.0 1.6 Applied for 25 year export license
Melford Project [t] Nova Scotia H-Energy 2020 13.5 1.7 Have not applied yet
GNL Québec [u] Québec GNL Québec Inc. 2020 11.0 1.6 Applied for 25 year export license 39 | brattle.comAustralia Ahead of the Pack with ~9 Bcf/d
Under Construction
Australian LNG Projects
Capacity
Project Status Owner (Bcf/day) Cost Online
[1] [2] [3] [4] [5] [6]
North West Shelf Venture[a] Operational 2.20 1989
Darwin [b] Operational Conoco 0.48 Early 2006
Pluto [c] Operational Woodside 0.57 $15 Billion 2013
Subtotal [d] 3.26
Gorgon [e] Approved/Under Construction Chevron 2.08 $57 Billion 2015
Wheatstone [f] Approved/Under Construction Chevron 1.19 $35 Billion 2016
Curtis Island [g] Approved/Under Construction BG 1.13 $34 Billion 2014
Ichthys [h] Approved/Under Construction Inpex 1.12 $43 Billion Q4 2016
Gladstone [i] Approved/Under Construction Santos 1.04 $30 Billion 2015
PNG LNG [j] Approved/Under Construction Exxon 0.92 $19 Billion 2014
Australia Pacific [k] Approved/Under Construction Conoco/Origin 1.20 $37 Billion 2015
Prelude [l] Approved/Under Construction Shell 0.48
Subtotal [m] 9.17
Browse [n] Proposed Woodside 1.60
Shell/Arrow [o] Proposed Shell/Petrochina 1.07 $20 Billion 2017
Interoil LNG [p] Proposed Interoil 1.07 $7 Billion 2015
Asia Pacific [q] Proposed Conoco/Origin 0.60
Pluto 2 [r] Proposed Woodside 0.57 $15 Billion
▀ Australian LNG projects facing substantial cost Subtotal [s] 4.91
Grand Total [t] 17.33
overruns and competitive pressures
Sources:
▀ Korea Gas has reportedly walked away from a Reuters, CNN Money, Bloomberg.
non-binding agreement to purchase 1.5 mmtpa
(~200 MMcf/d) from Gorgon LNG
▀ Only 65% of Chevron’s share of Gorgon LNG is committed under long-term contracts
▀ Asian buyers looking for cheaper source of supply
40 | brattle.comYou can also read