INVESTOR PRESENTATION JUNE 2018 - Amazon AWS
←
→
Page content transcription
If your browser does not render page correctly, please read the page content below

JUNE 2018
INVESTOR PRESENTATION
PLEASE READ THIS PRESENTATION
MAKES REFERENCE TO:

Forward-looking statements
This presentation contains forward-looking statements within the meaning of securities laws. The words “anticipate,” “assume,” “believe,” “pending,”
“budget,” “estimate,” “expect,” “forecast,” “guidance,” “intend,” “plan,” “project,” “will” and similar expressions are intended to identify forward-looking
statements. These statements involve known and unknown risks, which may cause SM Energy's actual results to differ materially from results expressed or
implied by the forward-looking statements. Forward-looking statements in this presentation include, among other things, expected Permian Basin
production, expectations about future cost inflation, and the expected benefits from joint venture arrangements. General risk factors include the availability
of and access to capital markets; the availability, proximity and capacity of gathering, processing and transportation facilities; the volatility and level of oil,
natural gas, and natural gas liquids prices, including any impact on the Company’s asset carrying values or reserves arising from price declines;
uncertainties inherent in projecting future rates of production or other results from drilling and completion activities; the imprecise nature of estimating oil and
natural gas reserves; uncertainties inherent in projecting future drilling and completion activities, costs or results, including from pilot tests; the uncertainty of
negotiations to result in an agreement or a completed transaction; uncertainties inherent in projecting the timing and ultimate outcome of litigation; the
uncertain nature of acquisition, divestiture, joint venture, farm down or similar efforts and the ability to complete any such transactions; the uncertain nature
of expected benefits from the actual or expected acquisition, divestiture, drilling carry, farm down or similar efforts; the availability of additional economically
attractive exploration, development, and acquisition opportunities for future growth and any necessary financings; unexpected drilling conditions and results;
unsuccessful exploration and development drilling results; the availability of drilling, completion, and operating equipment and services; the risks associated
with the Company's commodity price risk management strategy; uncertainty regarding the ultimate impact of potentially dilutive securities; and other such
matters discussed in the “Risk Factors” section of SM Energy's 2017 Annual Report on Form 10-K, as such risk factors may be updated from time to time in
the Company's other periodic reports filed with the Securities and Exchange Commission. The forward-looking statements contained herein speak as of the
date of this announcement. Although SM Energy may from time to time voluntarily update its prior forward-looking statements, it disclaims any commitment
to do so except as required by securities laws.

           Non-GAAP financial measures: See Appendix for reconciliations

           Non-GAAP forward looking metrics: See Appendix for definitions

                                                                                                                           2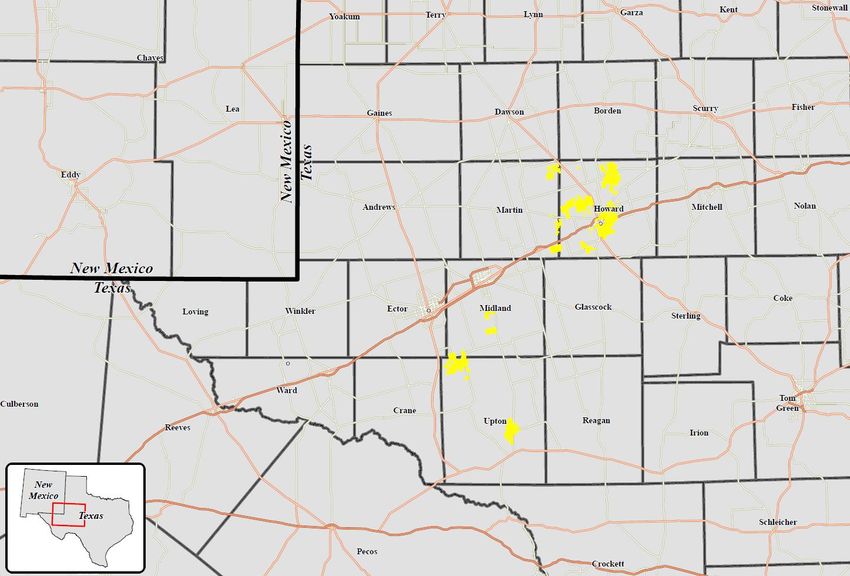
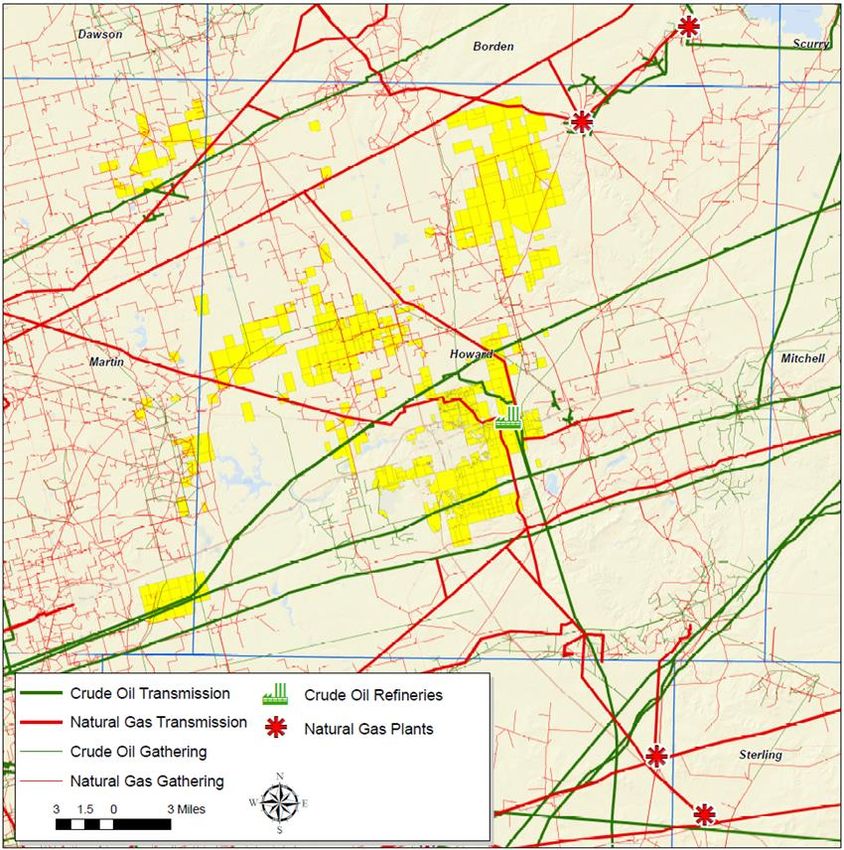
SM ENERGY PREMIER OPERATOR OF TOP TIER ASSETS
FOCUSED ON TWO BASINS IN TEXAS

                                  (1)
• Market capitalization: ~$3.0B

• Production: ~113 MBoe/d; 42%
  oil, 41% natural gas, 17%                 MIDLAND BASIN
  NGLs (1Q18)                               ▪ ~82,500 net acres
                                            ▪ 8 Rigs / 4 Frac Crews

• Proved Reserves: 468 MMBoe;               EAGLE FORD
                                            ▪ ~165,000 net acres
  46% proved developed (YE17)               ▪ 2 Rigs / 1 Frac Crew

                                        ~35%
• Expected 2018 Capital Spend:
  $1.27 billion

(1) As of May 31, 2018

                                        3
2017-2019 DRIVING DIFFERENTIAL VALUE
OFF TO A GREAT START IN 2018

                                                                        “ CASH FLOW GROWTH PER
    PREMIER
   OPERATOR                                       ~35%   CAGR 2017-19
                                                                        DEBT ADJUSTED SHARE IS
                                                                        THE METRIC WITH THE
                                                           Expected
                                                                        HIGHEST CORRELATION TO
                                                    CASH FLOW
                                                     GROWTH             INTRA SECTOR RELATIVE
      TOP TIER                                         PER DEBT         PERFORMANCE”
      ASSETS
                                                                                     ~35%
                                                   ADJUSTED SHARE (1)
                                                                        – Credit Suisse 12/11/17(2)

(1) See Appendix for Cash Flow per Debt Adjusted Share definition
(2) Betty Jiang and William Featherston, Credit Suisse

                                                                                    4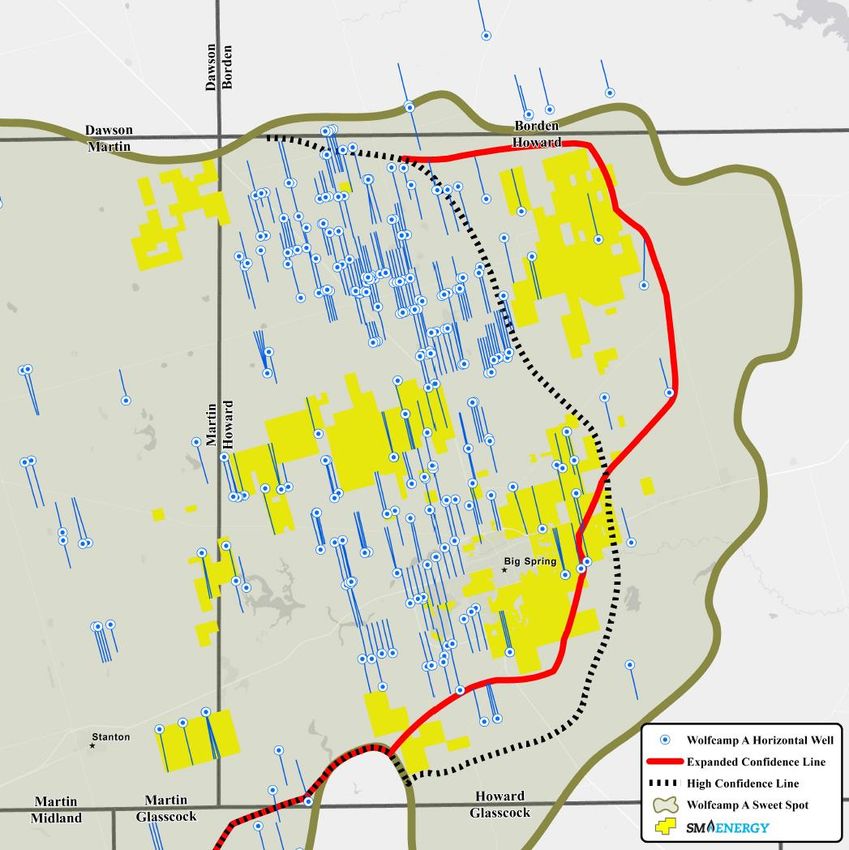
FIRST QUARTER 2018 HIGHLIGHTS

Cash flow growth, up 30% sequentially
   • Rapid margin expansion, highest in 14 quarters
   • Big Midland production growth

Operational execution: New wells outperforming expectations
   • 19 new RockStar wells average 1,440 Boe/d peak
      30-day IP rates (88% oil)

Significant reduction in net debt
    • Non-core asset sales year-to-date reduce net debt and
       core up portfolio

           $792 million                                                       $1.6 billion
           Non-core asset sales(1)                                                         Liquidity(2)

 (1)   Non-core asset sales in the Powder River Basin, North Dakota and Texas completed through May 2018
 (2)   As of March 31, 2018; commitment amount as of May 30, 2018

                                                                                                           5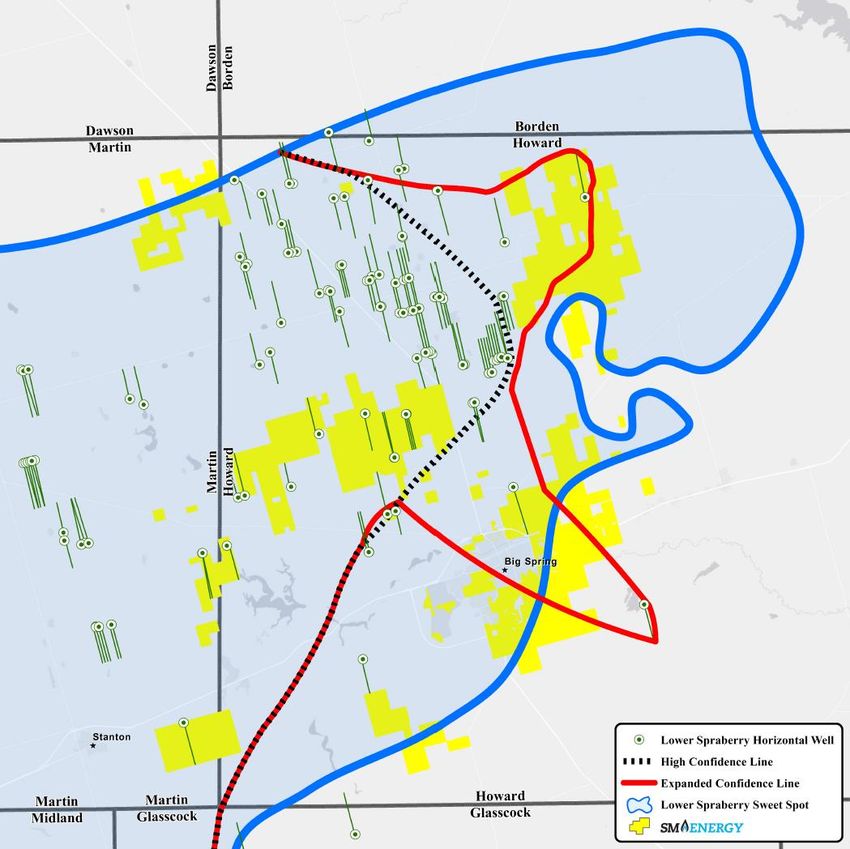
MIDLAND BASIN
 EXECUTING ON OUR PLAN

                                              Midland Basin
                                              ~82,500 net acres

• 17 net completions in 1Q18
   - 15 in RockStar area
                                                             RockStar

• 8 rigs currently

• 4 frac fleets operating at high
  efficiency

• ~36 net completions expected in
  2Q18
                                    Sweetie
                                     Peck
• Focusing on co-development of
  intervals

                                                        6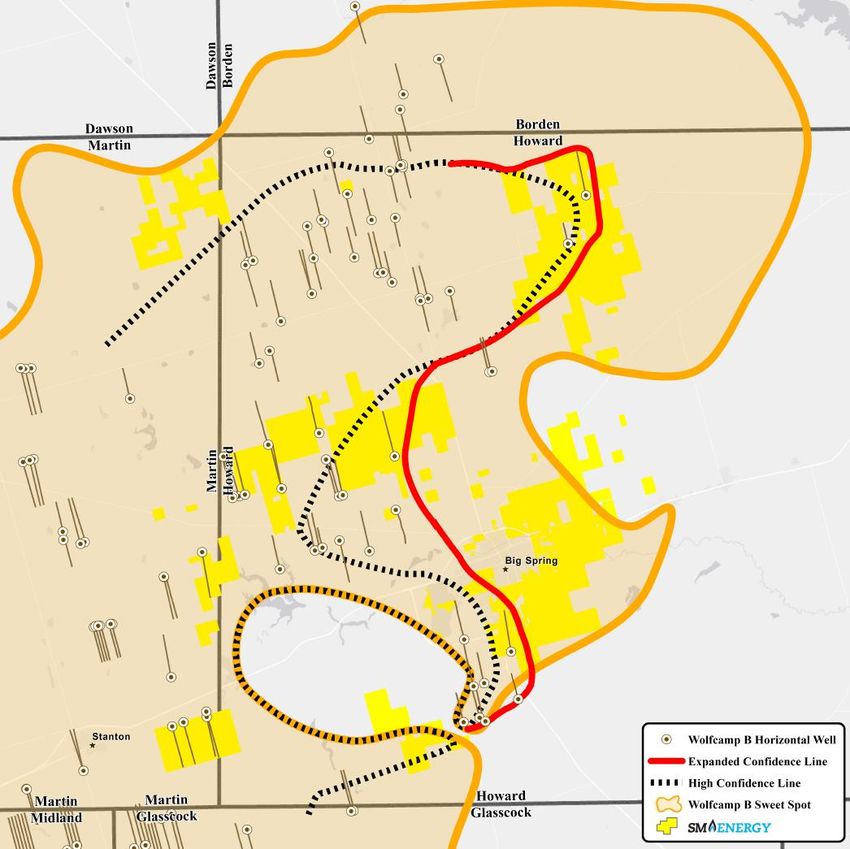
MIDLAND BASIN TOP WELL RESULTS
SM RANKS #1 IN REVENUE PER WELL & REVENUE PER LATERAL FOOT(1)

     (1) Baird Equity Research 3/28/18 – Joseph Allman   7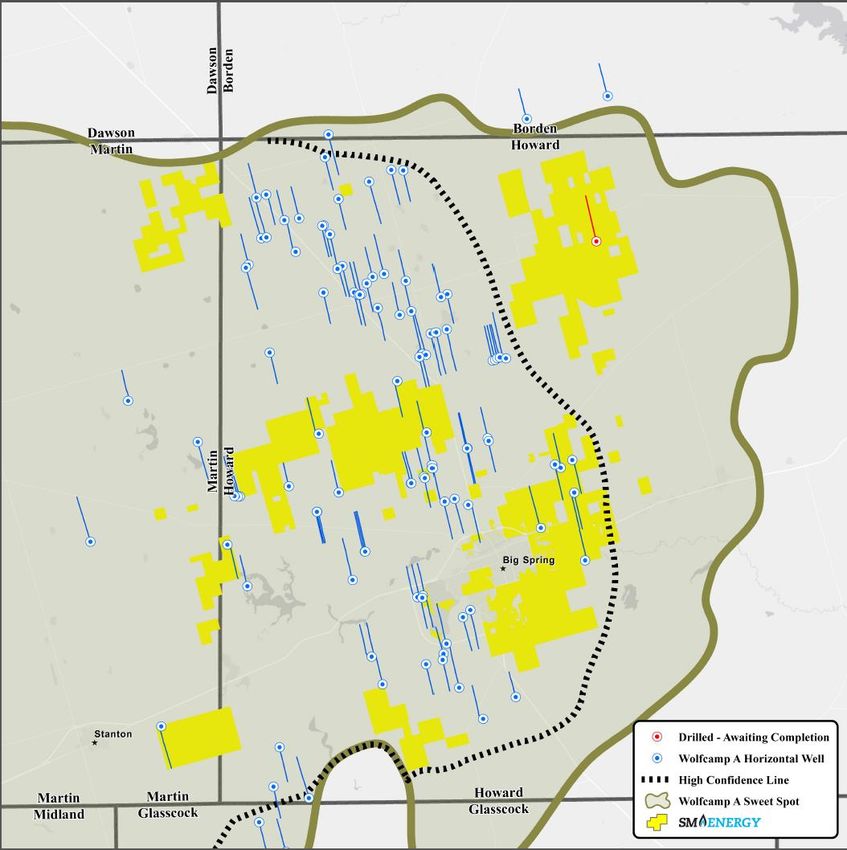
2017-2019 PERMIAN HIGH RATE OF CHANGE
EXPECTED BIG PERMIAN PRODUCTION GROWTH & MARGIN EXPANSION

• Permian projected production growth up ~135% 2017-2019
• Company projected cash operating margin up over 45% 2017-2019
  Production
    (MBoe)

                   4Q16           1Q17           2Q17          3Q17           4Q17           1Q18          2Q18e          3Q18e            4Q18e

               Note: 2018 estimated Permian Basin production by quarter based on February 2018 plan, updated for Halff East divestiture.

                                                                                                                           8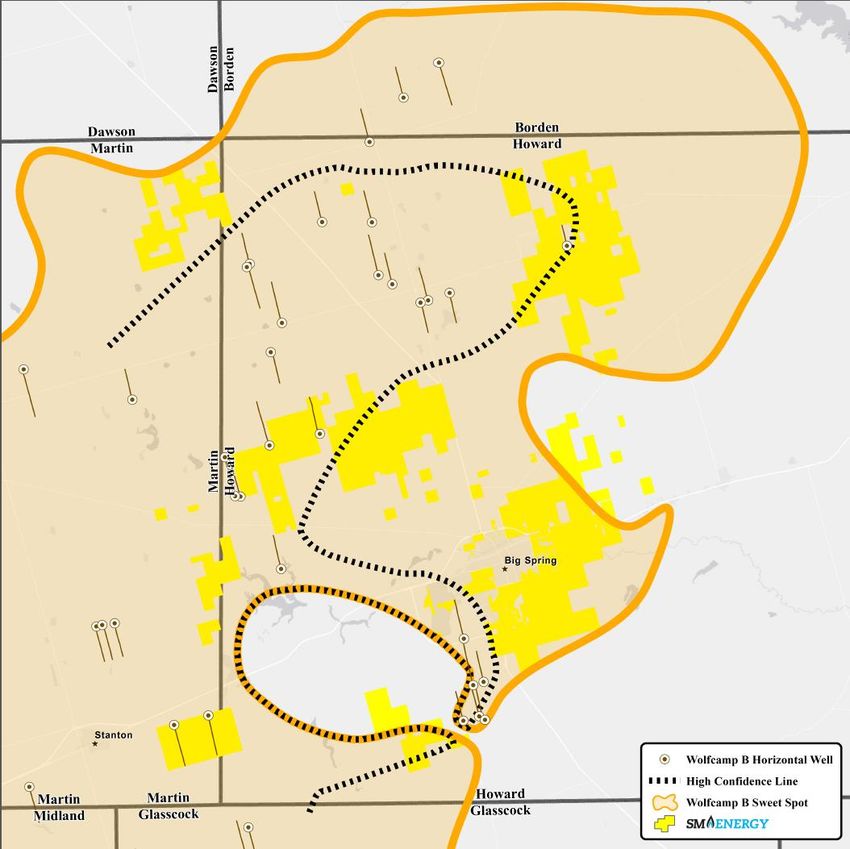
ROCKSTAR NEW WELL RESULTS
GREAT RESULTS IN MULTIPLE INTERVALS ACROSS ACREAGE POSITION
NEW WELLS AVERAGE 1,440 BOE/D, 88% OIL (10,200’ LATERAL LENGTH)

                                 Fezzik A 2443WA
                                 Fezzik A 2444WA
                                30 Day Avg Peak Rate:
       Guitar North 2850WA
       Guitar North 2851WA        1,536 Boe/d
       Guitar North 2852WA          (89% oil)
       Guitar North 2867WB
       Guitar North 2868WB
                                                                            Wiley Bob A 2351WA
        30 Day Avg Peak Rate:
                                                                            Wiley Bob 2352WA(1)
          1,607 Boe/d
                                                                            30 Day Avg Peak Rate:
            (87% oil)
                                                                                 941 Boe/d
                                                                                  (90% oil)
                                                                          (1) 7,708’ lateral length
        Lumbergh 2547WA
        Lumbergh 2548WA
        Lumbergh 2565WB

        30 Day Avg Peak Rate:
          1,623 Boe/d
                                                     Berlinda Ann 2341WA
            (85% oil)                                Berlinda Ann 2342WA
                                                     Berlinda Ann 2361WB
                                                   Whitaker 22-27 Unit 2251WA
         Lumbergh 2527LS                           Whitaker 22-27 Unit 2252WA
         Lumbergh 2528LS
                                                        30 Day Avg Peak Rate:
        30 Day Avg Peak Rate:
                                                          1,305 Boe/d
          1,485 Boe/d
                                                            (90% oil)
            (87% oil)

                                                                                         9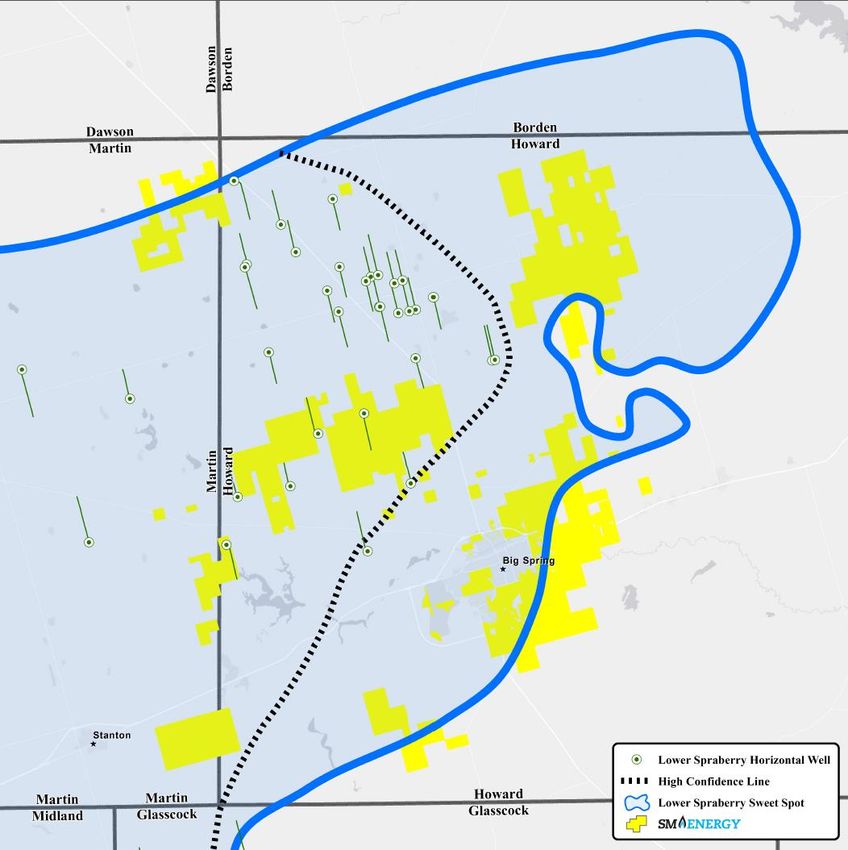
ROCKSTAR NEW WELL RESULTS
        NEW WELLS CONTINUE OUTPERFORMANCE TREND
                              300,000

                              250,000
Cumulative Production (BOE)

                              200,000

                              150,000

                              100,000

                               50,000

                                       0
                                           0        30          60          90          120         150          180         210         240         270         300   330   360
                                                                                                   Days on Production

                                                     Previously Reported Well Avg(1)                           New Well Avg(2)                    PEER 1MMBOE

                                 Note: Monthly data normalized to days on production; as of April 26, 2018

                                 (1)   Previously Reported Well Average includes all (36) previously reported SM operated wells on production since 11/3/2016.
                                 (2)   New Well Average includes 19 new wells that have not been previously reported.

                                                                                                                                                       10
MIDLAND BASIN INFRASTRUCTURE WATER MANAGEMENT
INVESTING $70MM IN FRESH AND PRODUCED WATER
INFRASTRUCTURE IN 2018
Currently 95%+
Midland water on pipe
Expected cost Accelerates System
savings development control
(LOE + Capital)
11MIDLAND BASIN INFRASTRUCTURE REGIONAL SAND
POSITIVE ARRANGEMENT WITH US SILICA & SANDBOX LOGISTICS
New sand mines
close to SM
operations ~55 miles(1)
>$400K ~48 miles(1)
expected capital
savings per well Lamesa (3Q18)
Crane (1Q18)
(1) Road miles
12MIDLAND BASIN INFRASTRUCTURE TAKEAWAY
MULTIPLE PURCHASERS WITH FT ASSURE RELIABLE SM TAKEAWAY
High quality WTI
Multiple purchasers
Sales at wellhead; used by TX
~90% of oil on pipe with FT; excellent
gathering is firm refineries; SM oil
relationships
37-41 gravity
Permian Basin
Oil Takeaway
13EAGLE FORD
ENHANCING VALUE OF INVENTORY
Eagle Ford
~165,000 net acres
• Up-spacing to improve returns
• Assessing new intervals
• Optimizing completions
JV Area
• Running 2 rigs and 1 frac fleet
• Expect to complete 9 net wells
in 2Q18
14BALANCE SHEET OFFERS FINANCIAL FLEXIBILITY
LIQUIDITY OF $1.6B, INCLUDING $643MM CASH ON HAND(1)
• Rapidly reducing net debt with $792MM non-core asset sales year-to-date
• Net debt:TTM Adjusted EBITDAX 3.3 times at 3/31/18; below 3.0 times projected year-end
• No bond maturities until 2021
• Senior Secured Debt:TTM Adjusted EBITDAX at 0.0 times; max ratio allowed 2.75 times
• TTM Adjusted EBITDAX:Interest at ~4.1 times; minimum ratio required 2.0 times
Debt Maturities(1)
(in millions) $1,500
Borrowing Base: $1.27B(2) $1,250
$1,000
Commitments: $1.0B(2)
$750
$500
$172.5
$562 $500 $500 $500 $250
$345 $395
$0 drawn
$0
2018 2019 2020 2021 2022 2023 2024 2025 2026
1.500%
Coupon 6.500%
6.125% 6.500% 5.000% 5.625% 6.750%
Yield to worst(3) 5.41% 5.41% 5.79% 6.26% 6.48% 6.63%
Initial call date 11/2016 11/2018 7/2017 7/2018 6/2020 9/2021
Initial call price 103.25% 103.06% 103.25% 102.50% 102.81% 103.38%
(1) As of March 31, 2018; borrowing base and commitment amount as of May 30, 2018
(2) Borrowing base updated for Divide County asset sale; commitments unchanged 15
(3) As of May 29, 2018WELL HEDGED
PERCENTAGE OF EXPECTED PRODUCTION HEDGED
Production Hedged(1) • ~80% of expected 2Q18 – 4Q18 production volumes
hedged; ~85% of oil volumes, ~65% of gas volumes
(NGLs hedged by product)
• ~75% of expected 2Q18 production volumes hedged;
80% ~75% of oil volumes, ~65% of gas volumes (NGLs
hedged by product)
• ~40% of expected 2019 production volumes hedged;
~50% oil volumes, ~25% gas volumes (NGLs hedged
by product)
Midland-Cushing Basis Swaps
• ~70% of expected 2Q18 – 4Q18 Permian oil
production covered by basis hedges at just over $1/Bbl
70%
• ~45% of expected 2019 Permian oil production
covered by basis hedges
Note: Hedging data as of May 18, 2018; all percentages calculated using mid-point of guidance.
(1) Percentage includes oil swaps and collars, natural gas swaps and collars, and NGL swaps; does not include basis swaps.
16SM ENERGY WHY INVEST IN SM?
OBJECTIVE; DELIVER LONG-TERM GROWTH IN CASH FLOW
PER DEBT ADJUSTED SHARE
• Unique opportunity to participate in competitively high rate of change in oil
production, margin expansion and cash flow growth
• Assets: SM wells ranked best in Midland Basin
• Execution: Exceptional track record; growing inventory
• Rapidly strengthening balance sheet with ample liquidity
• Returns focused: executive compensation tied to returns
25-well cube development; Pads from left to right: Ensign 772, Ensign 769, Trinidad 57, and Ensign 767
17Appendix
18Operational Detail
191Q18 REALIZATIONS BY REGION
Benchmark Pricing
NYMEX WTI Oil ($/Bbl) $62.87
NYMEX Henry Hub Gas ($/MMBtu) $3.00
Hart Composite NGL ($/Bbl) $30.87
Production Volumes Eagle Ford(1) Permian Rocky Mountain Total
Oil (MBbls) 354 3,315 592 4,262
Gas (MMcf) 18,731 5,631 861 25,222
NGL (MBbls) 1,641 5 27 1,673
MBoe 5,117 4,259 763 10,139
Revenue (in thousands)
Oil $19,583 $205,794 $35,683 $261,060
Gas 52,733 24,876 1,500 79,109
NGL 41,770 124 823 42,717
Total $114,086 $230,794 $38,006 $382,886
Expenses (in thousands)
LOE $11,321 $28,292 $10,572 $50,174
Ad Valorem 2,361 4,366 50 6,777
Transportation 45,307 197 1,396 46,900
Production Taxes 1,921 11,359 3,748 17,028
Per Unit Metrics:
Realized Oil per Bbl $55.27 $62.07 $60.27 $61.25
% of Benchmark - WTI 88% 99% 96% 97%
Realized Gas per Mcf $2.82 $4.42 $1.74 $3.14
% of Benchmark – NYMEX HH 94% 147% 58% 105%
Realized NGL per Bbl $25.45 $24.29 $30.36 $25.53
% of Benchmark – HART 82% 79% 98% 83%
Realized per Boe $22.29 $54.19 $49.84 $37.76
LOE per Boe $2.21 $6.64 $13.86 $4.95
Transportation per Boe $8.85 $0.05 $1.83 $4.63
Ad Val per Boe $0.46 $1.03 $0.07 $0.67
Production Tax - per BOE/% of Pre-Hedge
$0.38/1.7% $2.67/4.9% $4.92/9.9% $1.68/4.4%
Revenue
Production Margin per Boe $10.39 $43.80 $29.16 $25.83
Note: Totals may not sum due to rounding and other classifications
(1) Includes nominal amounts of other production and expenses from the region.
202018 PLANNED RIG ACTIVITY AND
COMPLETIONS BY MONTH
14 120
12
100
10
80
Total Net DUCs(1)
Operated Rigs
8
60
6
40
4
20
2
0 0
Jan Feb Mar Apr May Jun Jul Aug Sep Oct Nov Dec
Midland Basin Eagle Ford Total Net DUCs
(1) Total Net DUCs counts remove DUCs associated with assets sold.
21NGL REALIZATIONS
• 16% increase in realized price (before hedges) from 1Q17 to 1Q18
• SM NGL price realizations are predominantly tied to Mont Belvieu, fee
based contracts
• Differential reflects NGL barrel product mix, and transportation and
fractionation fees
SM Typical NGL Bbl(1)
1Q17 2Q17 3Q17 4Q17 1Q18 13%
9%
Mt. Belvieu ($/Bbl) $26.74 $24.11 $27.55 $32.12 $30.87 42%
9%
SM Realization
$22.06 $19.71 $22.40 $26.01 $25.53 27%
($/Bbl)
% Differential to
82% 82% 81% 81% 83%
Mt. Belvieu Ethane Propane
Iso Butane Normal Butane
Natural Gasoline
(1) Includes the effects of ethane rejection
222018 ACTIVITY BY REGION
WELLS DRILLED, FLOWING COMPLETIONS, AND DUC COUNT
Wells Drilled Flowing Completions DUC Count
1st Quarter 2018 1st Quarter 2018 1st Quarter 2018
Region Gross Net Gross Net Gross Net
Permian
Sweetie Peck 3 3 4 2 8 8
RockStar 32 30 18 15 54 50
Permian total 35 33 22 17 62 58
Eagle Ford(1) 11 8 5 5 39 33
Rocky Mountain (Divide) - - - - 18 15 (2)
Subtotal Operated Wells 46 41 27 22 119 106
Non-operated Wells(3) n/a - n/a - n/a 1
Total n/a 41 n/a 22 n/a 107
(1) As of March 31, 2018, there were 4 gross JV wells drilled, 0 JV wells completed, and 8 gross JV DUC’s
(2) Expected to be sold during 2Q18
(3) Non-operated activity relates to wells located in the Permian Basin
23LEASEHOLD SUMMARY
PRO-FORMA FOR PENDING TRANSACTIONS
Net
Acres(1) 2Q Sales / Pro-forma
Region 3/31/18 Additions Net Acres
Midland Basin
RockStar 64,855 760 65,615
Sweetie Peck(2) 16,900 - 16,900
Halff East 5,420 (5,420) -
Midland Basin Total 87,175 (4,660) 82,515
Eagle Ford 164,680 - 164,680
Rocky Mountain
Divide 119,235 (119,235) -
Rocky Mountain Other(3) 186,845 - 186,845
Other Areas/Exploration 24,915 - 24,915
Total 582,850 (123,895) 458,955
(1) Includes developed and undeveloped oil and gas leasehold, fee properties, and mineral servitudes held as of March 31, 2018.
(2) Sweetie Peck acreage includes 2,450 net acres of drill-to-earn acreage.
(3) Rocky Mountain Other includes non-core Williston Basin, and other non-core acreage located in North Dakota, Montana, Wyoming, and Utah.
24Financial Detail
25OIL AND GAS DERIVATIVE POSITIONS
BY QUARTER THROUGH 2019
Midland - Cushing
Oil Swaps Oil Collars Oil Basis Swaps
Price
Volume Volume Ceiling Floor Volume Differential
Period (MBbls) $/Bbl(1) (MBbls) $/Bbl(1) $/Bbl(1) (MBbls) $/Bbl(1)
2Q’18 1,534 $49.57 1,459 $59.03 $50.00 2,392 ($1.03)
3Q’18 1,769 $49.77 1,948 $58.61 $50.00 3,018 ($1.06)
4Q’18 1,894 $49.87 2,222 $58.44 $50.00 3,327 ($1.08)
1Q’19 442 $50.70 1,865 $61.08 $49.38 1,471 ($1.27)
2Q’19 439 $50.70 1,990 $61.44 $49.66 1,546 ($1.32)
3Q’19 524 $50.70 2,079 $61.51 $48.26 3,113 ($2.75)
4Q’19 535 $50.70 2,092 $61.46 $48.25 3,132 ($2.74)
Gas Swaps Gas Collars
Volume Volume Ceiling Floor
Period (BBTU) $/MMBTU(1) (BBTU) $/MMBTU(1) $/MMBTU(1)
2Q’18 15,712 $2.85 - - -
3Q’18 17,147 $2.88 - - -
4Q’18 18,646 $2.91 - - -
1Q’19 16,979 $2.92 - - -
2Q’19 - - 4,358 $2.83 $2.50
3Q’19 - - 5,066 $2.83 $2.50
4Q’19 - - 4,818 $2.83 $2.50
Note: Includes all commodity derivative contracts for settlement at any time during the second quarter of 2018 and later periods through 2019, entered into as of 5/18/18.
(1) Prices are weighted averages; natural gas prices reflect the weighted average of regional contract positions and are no longer adjusted to a NYMEX equivalent.
26NGL DERIVATIVE SWAP POSITIONS
OPIS MT. BELVIEU
Ethane Purity Propane Iso Butane
Volume Volume Volume
(2) (2) (2)
Period (MBbls) $/Bbl Period (MBbls) $/Bbl Period (MBbls) $/Bbl
2Q’18 915 $10.87 2Q’18 554 $24.94 2Q’18 66 $35.07
3Q’18 1,033 $10.99 3Q’18 610 $24.27 3Q’18 70 $35.07
4Q’18 1,146 $11.18 4Q’18 671 $24.39 4Q’18 76 $35.07
2018 Total 3,094 2018 Total 1,835 2018 Total 212
1Q’19 853 $12.25 1Q’19 440 $26.13 1Q’19 29 $35.70
2Q’19 877 $12.29 2Q’19 348 $28.53 2Q’19 29 $35.70
3Q’19 907 $12.34 3Q’19 360 $28.53 3Q’19 30 $35.70
4Q’19 896 $12.36 4Q’19 355 $28.53 4Q’19 29 $35.70
2019 Total 3,533 2019 Total 1,503 2019 Total 117
1Q’20 275 $11.13
Natural Gasoline Normal Butane
2Q’20 264 $11.13
Volume Volume
2020 Total 539 (2) (2)
Period (MBbls) $/Bbl Period (MBbls) $/Bbl
2Q’18 175 $50.99 2Q’18 84 $35.69
3Q’18 202 $51.13 3Q’18 93 $35.70
4Q’18 208 $50.99 4Q’18 102 $35.70
2018 Total 585 2018 Total 279
1Q’19 48 $50.93 1Q’19 37 $35.64
2Q’19 49 $50.93 2Q’19 38 $35.64
3Q’19 50 $50.93 3Q’19 39 $35.64
4Q’19 50 $50.93 4Q’19 39 $35.64
2019 Total 197 2019 Total 153
(1) Includes all commodity derivative contracts for settlement at any time during the second quarter of 2018 and later periods, entered into as of May 18, 2018.
(2) Weighted-Average Contract Price
271ST QUARTER 2018
SOLID EXECUTION
Production & Pricing 1Q18
Total Production (MMBoe/MBoe/d) 10.1/112.7
Oil Percentage 42%
Pre-Hedge Realized Price ($/Boe) $37.76
Post-Hedge Realized Price ($/Boe) $35.34
$210.2 MM
Adjusted EBITDAX(1)
Costs $/Boe
LOE $4.95
Ad Valorem $0.67
Transportation $4.63
$168.7 MM
Production Taxes $1.68 Discretionary
Production Expenses $11.93 Cash Flow (1)
Cash Production Margin (pre-hedge) $25.83 30% increase
G&A – Cash $2.33 (over 4Q17)
G&A – Non Cash $0.40
Operating Margin (pre-hedge) $23.10
DD&A $12.87
(1) See Appendix for reconciliation of non-GAAP measures
28TOTAL CAPITAL SPEND
RECONCILIATION TO COSTS INCURRED (GAAP)
Reconciliation of costs incurred in oil and gas
activities (GAAP) to total capital spend Three Months Ended
(Non-GAAP)(1) (in millions) March 31, 2018
Costs incurred in oil and gas activities (GAAP): $372.2
Asset retirement obligation (0.9)
Capitalized interest (4.5)
Total capital spend (Non-GAAP): $366.7
Note: Amounts may not calculate due to rounding
(1) The non-GAAP measure of total capital spend is presented because management believes it provides useful information to investors for analysis of
SM Energy's fundamental business on a recurring basis. In addition, management believes that total capital spend is widely used by professional
research analysts and others in the valuation, comparison, and investment recommendations of companies in the oil and gas exploration and
production industry, and many investors use the published research of industry research analysts in making investment decisions. Total capital spend
should not be considered in isolation or as a substitute for Costs Incurred or other capital spending measures prepared under GAAP. The total capital
spend amounts presented may not be comparable to similarly titled measures of other companies.
29ADJUSTED EBITDAX RECONCILIATION
Reconciliation of net income (GAAP) and net cash provided by operating Three Months Ended
activities (GAAP) to adjusted EBITDAX (non-GAAP): (in thousands) March 31, 2018
Net income (GAAP) $317,401
Interest expense 43,085
Interest income (849)
Income tax expense 98,991
Depletion, depreciation, amortization, and asset retirement obligation liability accretion 130,473
Exploration(1) 12,411
Abandonment and impairment of unproved properties 5,625
Stock-based compensation expense 5,412
Net derivative loss 7,529
Derivative settlement loss (24,528)
Net gain on divestiture activity (385,369)
Other 7
Adjusted EBITDAX (Non-GAAP) $210,188
Interest expense (43,085)
Interest income 849
Income tax expense (98,991)
Exploration(1) (12,411)
Amortization of debt discount and deferred financing costs 3,866
Deferred income taxes 98,366
Other, net (2,534)
Changes in current assets and liabilities (16,113)
Net cash provided by operating activities (GAAP) $140,135
Adjusted EBITDAX represents net income (loss) before interest expense, interest income, income taxes, depletion, depreciation, amortization and asset retirement obligation liability accretion expense, exploration expense, property abandonment and
impairment expense, non-cash stock-based compensation expense, derivative gains and losses net of settlements, gains and losses on divestitures, gains and losses on extinguishment of debt, and certain other items. Adjusted EBITDAX excludes
certain items that we believe affect the comparability of operating results and can exclude items that are generally one-time in nature or whose timing and/or amount cannot be reasonably estimated. Adjusted EBITDAX is a non-GAAP measure that we
present because we believe it provides useful additional information to investors and analysts, as a performance measure, for analysis of our ability to internally generate funds for exploration, development, acquisitions, and to service debt. We are also
subject to financial covenants under our Credit Agreement based on adjusted EBITDAX ratios. In addition, adjusted EBITDAX is widely used by professional research analysts and others in the valuation, comparison, and investment recommendations
of companies in the oil and gas exploration and production industry, and many investors use the published research of industry research analysts in making investment decisions. Adjusted EBITDAX should not be considered in isolation or as a
substitute for net income (loss), income (loss) from operations, net cash provided by operating activities, or other profitability or liquidity measures prepared under GAAP. Because adjusted EBITDAX excludes some, but not all items that affect net
income (loss) and may vary among companies, the adjusted EBITDAX amounts presented may not be comparable to similar metrics of other companies. Our credit facility provides a material source of liquidity for us. Under the terms of our Credit
Agreement, if we failed to comply with the covenants that establish a maximum permitted ratio of senior secured debt to adjusted EBITDAX and a minimum permitted ratio of adjusted EBITDAX to interest, we would be in default, an event that would
prevent us from borrowing under our credit facility and would therefore materially limit our sources of liquidity. In additi on, if we are in default under our credit facility and are unable to obtain a waiver of that default from our lenders, lenders under that
facility and under the indentures governing our outstanding Senior Notes and Senior Convertible Notes would be entitled to exercise all of their remedies for default.
(1) Stock-based compensation expense is a component of exploration expense and general and administrative expense on the statements of operations. Therefore, the exploration line items shown
in the reconciliation above will vary from the amount shown on the statements of operations for the component of stock-based compensation expense recorded to exploration expense.
30ADJUSTED NET INCOME RECONCILIATION
Reconciliation of net income (GAAP) to adjusted net income Three Months Ended
(non-GAAP): (in thousands, except per share data) March 31, 2018
Net income (GAAP) $317,401
Net derivative loss 7,529
Derivative settlement loss (24,528)
Net gain on divestiture activity (385,369)
Abandonment and impairment of unproved properties 5,625
Other, net 807
Tax effect of adjustments(1) 86,710
Adjusted net income (Non-GAAP) $8,175
Diluted net income per common share (GAAP) $2.81
Net derivative loss 0.07
Derivative settlement loss (0.22)
Net gain on divestiture activity (3.41)
Abandonment and impairment of unproved properties 0.05
Other, net 0.01
Tax effect of adjustments(1) 0.76
Adjusted net income per diluted common share (Non-GAAP) $0.07
Diluted weighted-average common shares outstanding (GAAP): 112,879
Note: Amounts may not calculate due to rounding
Adjusted net income excludes certain items that the Company believes affect the comparability of operating results. Items excluded generally are non-recurring items or are items whose
timing and/or amount cannot be reasonably estimated. These items include non-cash and other adjustments, such as derivative gains and losses net of settlements, impairments, net (gain)
loss on divestiture activity, materials inventory loss, and gains or losses on extinguishment of debt. The non-GAAP measure of adjusted net income (loss) is presented because management
believes it provides useful additional information to investors for analysis of SM Energy's fundamental business on a recurring basis. In addition, management believes that adjusted net
income (loss) is widely used by professional research analysts and others in the valuation, comparison, and investment recommendations of companies in the oil and gas exploration and
production industry, and many investors use the published research of industry research analysts in making investment decisions. Adjusted net income (loss) should not be considered in
isolation or as a substitute for net income (loss), income (loss) from operations, cash provided by operating activities, or other income, profitability, cash flow, or liquidity measures prepared
under GAAP. Since adjusted net income (loss) excludes some, but not all, items that affect net income (loss) and may vary among companies, the adjusted net income (loss) amounts
presented may not be comparable to similarly titled measures of other companies.
(1) The tax effect of adjustments is calculated using a tax rate of 21.9%, for the three-month period ended March 31, 2018. This rate approximates the Company's
statutory tax rate adjusted for ordinary permanent differences.
31DISCRETIONARY CASH FLOW
RECONCILIATION TO NET CASH PROVIDED
BY OPERATING ACTIVITIES (GAAP)
Reconciliation of net cash provided by operating activities Three Months
(GAAP) to discretionary cash flow (Non-GAAP)(1) Ended
(in millions) March 31, 2018
Net cash provided by operating activities (GAAP): $140.1
Changes in current assets and liabilities 16.1
Exploration(2)(3) 12.4
Discretionary cash flow (Non-GAAP): $168.7
Note: Amounts may not calculate due to rounding
(1) Discretionary cash flow is defined as net cash provided by operating activities excluding changes in assets and liabilities, and exploration (included in
our capital spend guidance). Discretionary cash flow is widely accepted as a financial indicator of an oil and gas company’s ability to generate cash
which is used to internally fund exploration and development activities, pay dividends, and service debt. Discretionary cash flow is presented because
management believes it provides useful information to investors when comparing our cash flows with the cash flows of other companies that use the
full cost method of accounting for oil and gas producing activities, or have different financing and capital structures or tax rates. Discretionary cash
flow is not a measure of financial performance under GAAP and should not be considered as an alternative to cash flows from operating activities, as
defined by GAAP, or as a measure of liquidity, or an alternative to net income.
(2) Exploration expense is added back in the calculation of discretionary cash flow because for peer comparison purposes, this number is included in our
reported total capital spend.
(3) Stock-based compensation expense is a component of exploration expense and general and administrative expense on the statements of operations.
Therefore, the exploration line items shown in the reconciliation above will vary from the amount shown on the statements of operations for the
component of stock-based compensation expense recorded to exploration expense.
32Inventory and Returns
33HOWARD COUNTY WOLFCAMP A
EVOLUTION OF SM SWEET SPOT MAPPING
January 2017 February 2018
Higginbotham Unit B 30-19 1AH Cassidy 26-23 1H
Tall City – 6,397’ Tall City – 7,314’
Hyden 47-38 WA 1H 24hrIP = 403 BOEPD
24hrIP = 398 BOEPD
Grenadier – 9,639’
24hrIP = 848 BOEPD Viper 14-9 1WA
SM – 10,422’
24hrIP = 1,316 BOEPD
Oldham Trust 40-25 WA 1H
Grenadier – 10,426’
24hrIP = 1,274 BOEPD
Thumper 14-23 1AH
Sabalo – 10,105’
24hrIP = 1,357 BOEPD
Midland 15-10 1WA
Hannathon – 7,726’
24hrIP = 1,259 BOEPD
Broughton Wise 18-19 WA 1H
Grenadier – 7,012’
24hrIP = 875 BOEPD
Morgan Ranch 38-47 1WA
Hannathon – 7,727’
24hrIP = 713 BOEPD
34HOWARD COUNTY WOLFCAMP B
EVOLUTION OF SM SWEET SPOT MAPPING
January 2017 February 2018
Sundown 4566WB
SM – 10,336’
24hrIP = 1,435 BOEPD
Prichard J 10BH
Legacy – 7,644’
24hrIP = 602 BOEPD
Maverick 0361WB
SM – 10,412’
24hrIP = 1,683 BOEPD Prichard J 9BH
Legacy – 7,641’
24hrIP = 655 BOEPD
International Unit 9H
Callon – 7,579’
24hrIP = 887 BOEPD
Fletch C 1368WB
SM – 10,287’
24hrIP = 1,700 BOEPD
Tubb 1WA
Crownquest – 9,873’
24hrIP = 1,178 BOEPD
35HOWARD COUNTY LOWER SPRABERRY
EVOLUTION OF SM SWEET SPOT MAPPING
January 2017 February 2018
Sundown 4524 LS
Moby Dick 31-30 8SH
SM – 10,352’
Surge – 7,362’
24hrIP = 959 BOEPD
24hrIP = 319 BOEPD
Mr. Phillips 11-2 1SH
Sabalo – 10,047’
24hrIP = 1,032 BOEPD
Papagiorgio 33-40 B1LS
SM – 10,370’
24hrIP = 1,006 BOEPD
Allar LS
Hannathon – 7,580’
24hrIP = 1,135 BOEPD
36MIDLAND BASIN DRILLING INVENTORY
INCREASING INVENTORY AND NPV PER SECTION
4,000
3,500
Average Lateral Average Working
3,000 Length Interest
9,600’ 72%
Drilling Locations
(gross operated)
2,500
2,000
(up 13% from 2016) (up 10% from 2016)
1,500 Economic lateral feet 10% IRR threshold
increased economic locations:
1,000
17% 1,640(2)
~1,250
500
(from 2016) (comparable to peers)
0
(1)
Economic Resource Additional Resource
(1) Economic Resource represents 3P inventory within the confirmed contours and 20% IRR at $60/Bbl oil, $3/MMBtu natural gas, $30/Bbl NGLs
(2) 3P inventory inside and outside the confirmed contours; 10% IRR
37DRILLING INVENTORY
~15 YEARS AT CURRENT ACTIVITY LEVEL
APPROXIMATELY 45 YEARS INCLUDING UPSIDE RESOURCES
Midland Basin and Eagle Ford
6,000
5,000
Drilling Locations
4,000
(gross operated)
3,000
2,000
1,000
0
Economic Resource(1) Additional Resource
Note: Eagle Ford 2017 average lateral length = 9,000’; up 18% from 2016
(1) Economic Resource represents 3P inventory within the confirmed contours for Howard and Martin Counties and 20% IRR at $60/Bbl oil,
$3/MMBtu natural gas, $30/Bbl NGLs
38TOP TIER ASSETS REGIONAL WELL PROJECTED ECONOMICS
RockStar Sweetie Peck
Wells(1) across all intervals (WCA, WCB, LS) in the 2018 drilling program Wells(1) across all intervals (WCA, WCB, LS) in the 2018 drilling program
120% 100%
100%
80%
80%
60%
IRR
IRR
60%
40%
40%
20% 20%
0% 0%
$50 $55 $60 $65 $50 $55 $60 $65
NYMEX WTI NYMEX WTI
Well Cost: $8.3MM Well Spacing: 513’ – 660’ Well Cost: $7.5MM Well Spacing: 660’
Sand loading: 1,900 lbs/ft; Stage Spacing: 167’; Length: 10,000’ Sand loading: 1,900 lbs/ft; Stage Spacing: 167’; Length: 8,333’
Eagle Ford
Wells(1) across UEF/LEF in East, South and North Area in the 2018 drilling program
60%
50%
40%
IRR
30%
1Q18 Average
20%
Mt. Belvieu ($/Gal)
10%
0%
$0.60 $0.70 $0.80
Mt. Belvieu $/Gal
Well Cost: $6.8MM, Lateral Length: 8,800’, Well Spacing: 625’-900’, Sand Loading: 2,000 lbs/ft, Stage Spacing: 150’
Note: well costs include drill, complete, and equip; sensitivities at $3.00/MMBtu NYMEX; Eagle Ford oil flat at $60/Bbl WTI, excludes JV wells
(1) Weighted average by interval 39Maps
40ROCKSTAR OPERATORS
SM Energy
Callon
Encana
Surge/Yantai Xinchao
Diamondback
Oxy
Energen
Endeavor
Sabalo
Grenadier
Note: Peer acreage obtained from 1Derrick
41SWEETIE PECK OPERATORS
SM Energy
Apache
Chevron
Concho
Devon
Diamondback
Discovery
Endeavor
Exxon
Legacy
Oxy
Pioneer
Summit
Note: Peer acreage obtained from 1Derrick
42EAGLE FORD OPERATORS
Dimmit
Maverick
Dimmit
Webb
Area
North
Fasken
Area
East
Area
South
43DEFINITIONS OF NON-GAAP,
FORWARD LOOKING METRICS
The following metrics are forward-looking non-GAAP financial measures. The Company believes these measures are commonly
used in the E&P industry, and other industries, by shareholders, professional research analysts and others in valuation,
comparison and investment recommendations. Certain forward-looking metrics cannot be presented in conjunction with a
reconciliation to the closest GAAP measure, because certain portions of the forecast calculation would are inherently
unpredictable. Accordingly, investors are cautioned not to place undue reliance on these numbers.
1) Projected cash flow per debt adjusted share:
For purposes of forward-looking cash flow from operations, it is not possible to project changes in working capital. The Company calculates
forward-looking cash flow as projected adjusted EBITDAX (reconciled above to GAAP Net Loss and GAAP Net cash provided by operating
activities for actual results) less projected cash interest expense and cash taxes.
The calculation of debt adjusted shares is the sum of average fully diluted common shares outstanding plus the quotient of total principal value
of long-term debt outstanding (including senior notes, convertible stock, credit facility) less cash and cash equivalents divided by the price of
common stock. In the case of the current 2-year plan, the price of common stock used is the closing price at year-end 2017.
2) Capital spend:
For purposes of forward-looking capital spend, it is the sum of projected capital expenditures for drilling and completion of wells, capitalized
geologic and geophysical work, exploration costs excluding dry hole expenses, facilities and infrastructure, allocated overhead and land costs
exclusive of acquisitions.
Capital spend as reported for actual results is reconciled above to GAAP costs incurred in oil and gas activities.
3) Net debt:EBITDAX:
Net debt is total principle value of long-term debt outstanding less cash and cash equivalents. Projected net debt:EBITDAX is projected net debt
divided by projected adjusted EBITDAX. Adjusted EBITDAX is reconciled above to GAAP Net Loss and GAAP Net cash provided by operating
activities for actual results.
4) Discretionary cash flow
Discretionary cash flow is defined as net cash provided by operating activities excluding changes in assets and liabilities, and exploration
(included in our capital spend guidance).
44CONTACT INFORMATION
Jennifer Martin Samuels
Vice President - Investor Relations
303-864-2507
jsamuels@sm-energy.com
45You can also read