Strong Foundations and Financial Discipline in a Volatile Environment - Investor Presentation
←
→
Page content transcription
If your browser does not render page correctly, please read the page content below
Strong Foundations and Financial Discipline in a Volatile Environment

Investor Presentation                 TSX: AAV                           January 2021
Advantage at a Glance

 TSX 52-week trading range                                              $0.98 to $2.72
                                                                                                                                                 6 M iles

 Shares Outstanding (basic)                                                   188 million
 Market Capitalization                                                     $325 million                                                                                          P rogress

 Enterprise Value                                                          $575 million                                                Glacier

 2020 Estimates                                                                                                                                                       Valhalla

  Capital (1)                                                   $147 to $162 million
                                                        (Q4 - $22 to $37 million)
                                                                                                                                                                                           P ipestone/
                                                                                                                                                                                         Pipestone/
  Total Production (liquids ~10%)                                      ~44,900 boe/d                                                                                                       W embley
                                                                                                                                                                                         Wembley

 2021 Guidance (2)
  Capital                                                       $125 to $150 million
  Total Production (liquids ~8% to 9%)                    47,000 to 49,000 boe/d

      Advantage holds 134,400 net acres (210 net sections) in the                                                                         Advantage
      condensate/light oil-rich Montney Glacier/Pipestone fairway                                                                         Montney Assets

                         Notes:
                         (1) Forward-looking information. Refer to Advantage news releases dated May 6, 2020 and Advisory for material assumptions and risk factors.
                         (2) Forward-looking information. Refer to Advantage news releases dated October 29, 2020 and Advisory for material assumptions and risk factors.                                2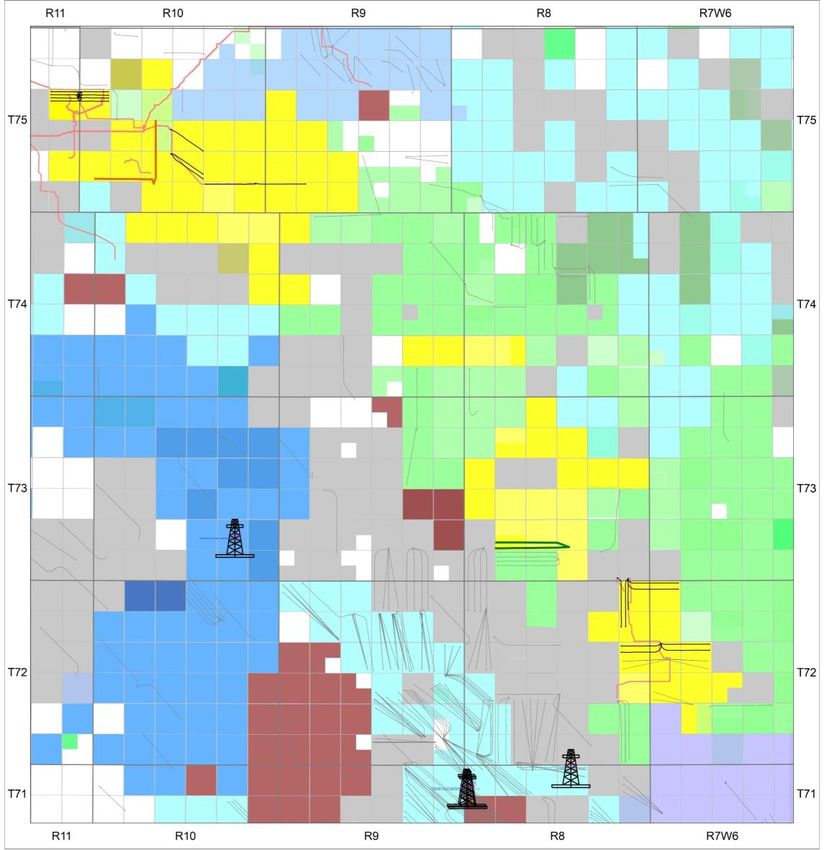
Shareholder-Focused Strategy for the New Energy Market
                                                                                                     Clean
                                                                                                Sustainable
                                                                                                    Energy
                                            Relentless
                                          Focus on Asset                                              High
                                           Quality and                                              Quality
                                                                                                    Liquids
                                          Cost Structure

                                                                          Tactical Elements
                                                                                                   Prolific
                                                                                                     Gas
                                                                                               Foundation
  Focusing on Financial   Continuously       Deliver         In-Depth                             Low-cost
                            Evolving,     Sustainable      Fundamentals                             Owned
     Discipline While     Adapting and   Adjusted Funds      and Risk                         Infrastructure
                           Competing      Flow Growth      Management                              Resilient
   Markets are Volatile                                                                              In All
                                                                                                    Cycles

                                                                                               Disciplined
                                                                                                 Financial
                                          Foundation of
                                                                                              Management
                                            Financial
                                             Stability

                                                                                                         3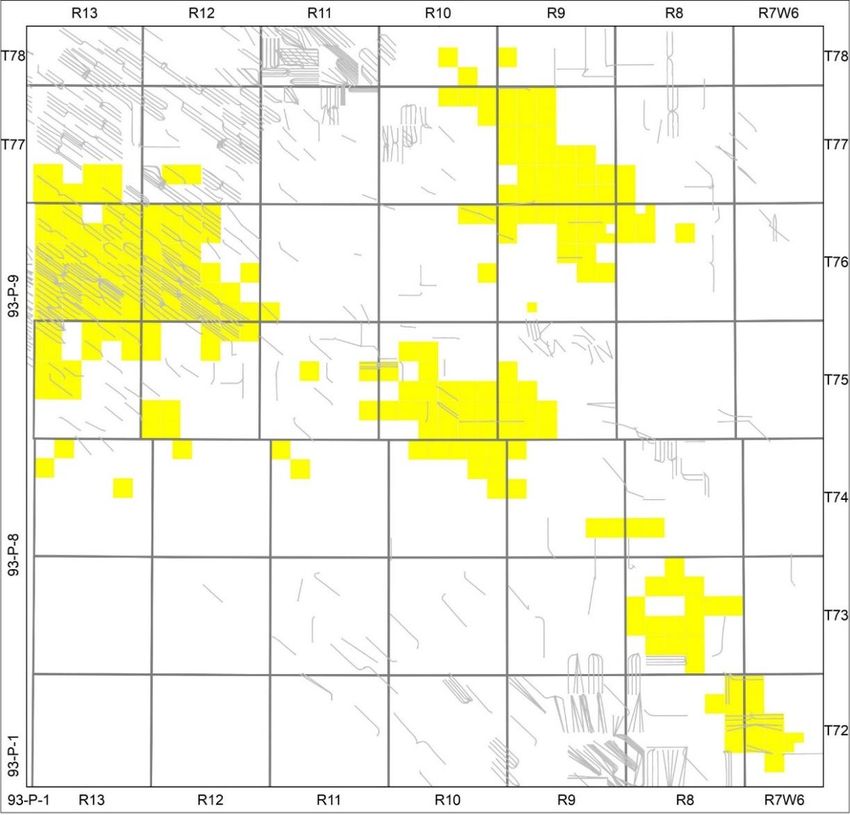
Top-Tier Resources and Cost Structure For A Strong Foundation

                                          High Quality                    Low-Cost Owned                  Disciplined Financial
     Prolific Gas Foundation
                                            Light Oil                       Infrastructure                   Management

      Free cash generation with     Deep inventory of high quality    Controlled, efficient, innovative    Self funded growth with
       lowest declines and cost              resource                                                            free cash flow

            2021 Strategy: Focus on Highest Return, Gas-Weighted Projects

    Sustain and invest in highest      Modest investment to          Smaller infrastructure projects      D/AFF ratio target
2021 Capital Investment Thesis (1)

                                                                           Glacier focused, ~10 wells +
                                    $75 million                                                                                                                     Production Growth
                                                                           facilities maintenance costs,                                                                 5-10%
                                      Sustaining                                   other corporate
  $125 - $150                          Capital
                                                                                                                                                                            D/AFF
    million                                                                                                                                                             Target $100 million
                            ~$30 million                                       new tie-ins and facility
                                                                                   enhancements
                            Growth Capital                                                                                                                            Corporate Decline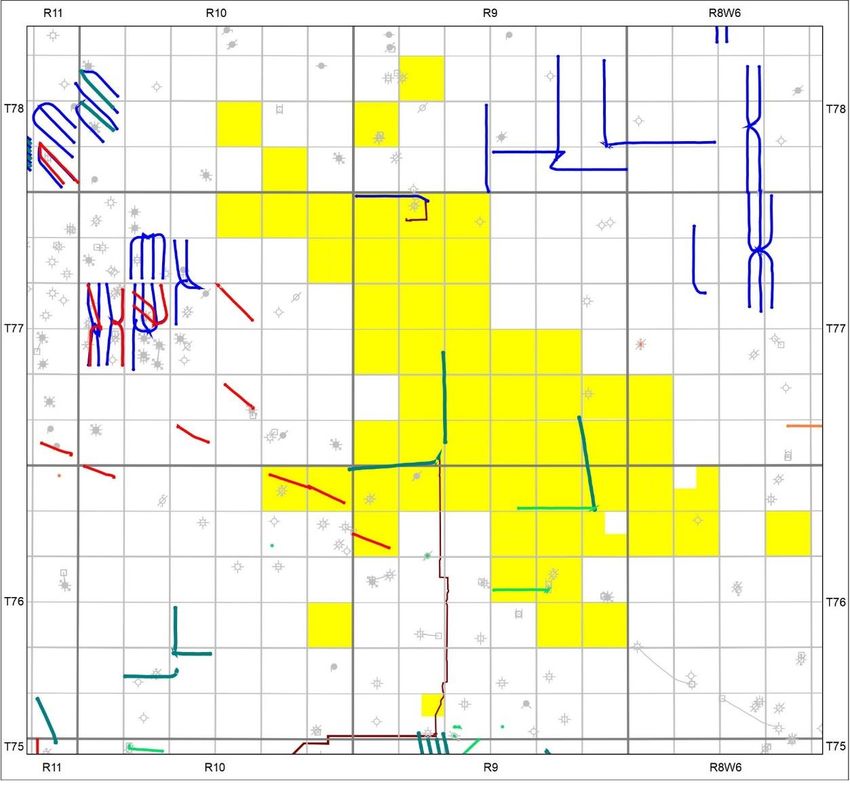
Low Cost Structure Defines The Competitive Advantage
                                                                                                                                                   Clean
 $30                                                                                                                                          Sustainable
           Transport (1)                                                                                                                          Energy
           Finance & Other                                                                                                                          High
 $25                                                                                                                                              Quality
           G&A
                                                                                                                                                  Liquids
           Royalties
 $20       Operating
                                                                                                                                                 Prolific
                                                                                                                                                   Gas
                                                                                                                                             Foundation
 $15                                                                                                                                            Low-cost
                                                                                                                                                  Owned
                                                                                                                                            Infrastructure
 $10
                                                                                                                                                 Resilient
                                                                                                                                                   In All
  $5                                                                                                                                              Cycles

                                                                                                                                             Disciplined
                                                                                                                                               Financial
  $-
                                                                                                                                            Management
           AAV

                                                                                             I

                                                                                                        J
                                                            F

                                                                                                                                L
       A

                 B

                                                 E

                                                                                                                   K
                           C

                                                                       G

                                                                                  H
                                      D

                                                                                                                                        N
                                                                                                                                    M
                  Notes:
                  (1) Transportation is not a typical cost as it is generally associated with accessing higher priced markets

                  Source: Scotiabank, December 11, 2020, third quarter 2020 cash costs $/boe
                                                                                                                                                       6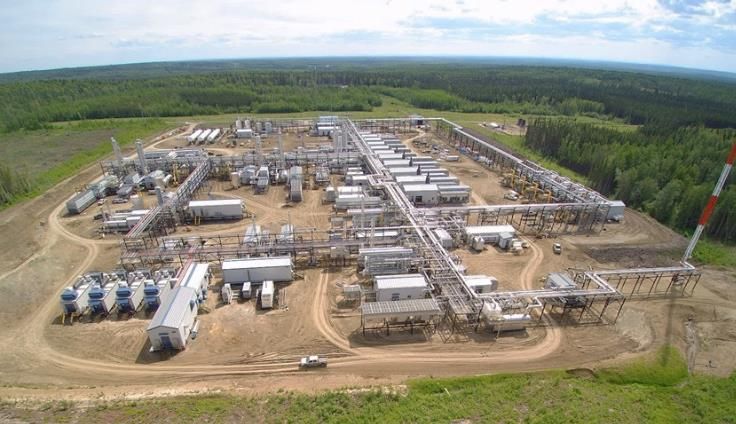
Canada – Leading Jurisdiction for Responsible Energy Investment
           “A Proud          Clean Energy Producer – The World Needs More of Our Energy”                                                                                         Clean
                                                                                                                                                                            Sustainable
                                        Aggregate Independent ESG Scores                                                                                                        Energy

                                                                                                     High ESG Score                                                               High
                                                                                                     High Reserves                                                              Quality
                                                                                                                                                                                Liquids

                                                                                                                                                                               Prolific
                                                                                                                                                                                 Gas
                                                                                                                                                                           Foundation

                                                                                                                                                                              Low-cost
                                                                                                                                                                                Owned
                                                                                                                                                                          Infrastructure

                                                                                                                                                                               Resilient
                                                                                                                                                                                 In All
                                                                                                                                                                                Cycles

                                    Low ESG Score                                                                                                                          Disciplined
                                     Low Reserves                                                                                                                            Financial
                                                                                                                                                                          Management

             Sources: ESG Scores are aggregation of Yale Environmental Performance Index, Social Progress Imperative and World Bank Govern ance Index; reserves from BP
             Statistical Review of World Energy 2019 based on government and published data; Canada Action. *Iraq scores unavailable
                                                                                                                                                                                     7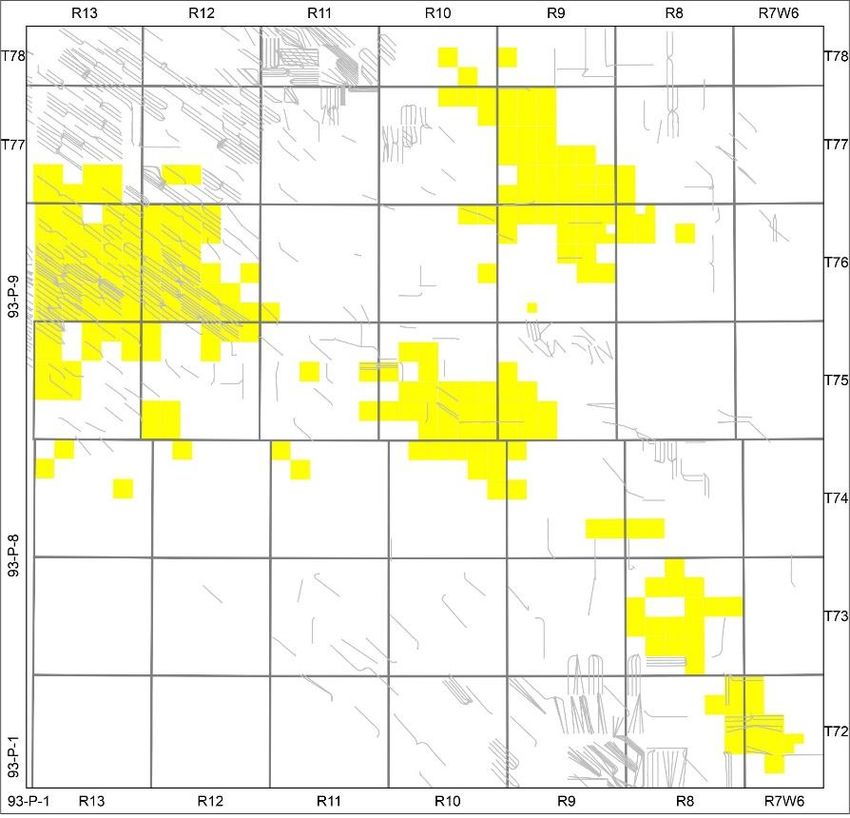
Environmental Leadership and Sustainability
                                                                                                                                                                                Clean
                                                                                                                                                                           Sustainable
   Advantage is an Environmental, Social and Governance (ESG) leader
                                                                                                                                                                               Energy
   •     Natural gas is the best way to reduce global CO 2 emissions - by displacing coal
                                                                                                                                                                                 High
   •     Advantage emissions intensity is very low, in part due to carbon capture and storage at Glacier
                                                                                                                                                                               Quality
   •     Created 650 full-time jobs/year over the last 5 years                                                                                                                 Liquids
   •     Contributed >$1 million to community programs/charities since inception
                                                                                                                                                                              Prolific
   •     See Sustainability Report on AAV website                                                                                                                               Gas
                                                                                                                                                                          Foundation
                 Glacier CO2 Sequestration Project                                                          Advantage Net Carbon Intensity(2)                                Low-cost
                         (tonnes CO2e accredited)                                                                     (tonnes CO2e per BOE)                                    Owned
                                                                   113,835                                           0.0093                                              Infrastructure
   114,000 tonnes CO2e equates                                                                  0.0079
                                              90,367
    to approx. 25,000 vehicles (1)                                                                                                                                            Resilient
                                                                                                                                                                                In All
       57,410            56,999                                                                                                            0.0049               0.0045         Cycles

                                                                                                                                                                          Disciplined
                                                                                                                                                                            Financial
                                                                                                                                                                         Management
        2016               2017                2018                  2019                        2016                  2017                 2018                 2019

                            (1) Based on estimates per Environmental Protection Agency emissions per vehicle
                            (2) Independent study prepared by Envirosoft Corp. effective Jan 1 2020; Scope 1 and 2 emissions, net of Glacier sequestration credits                  8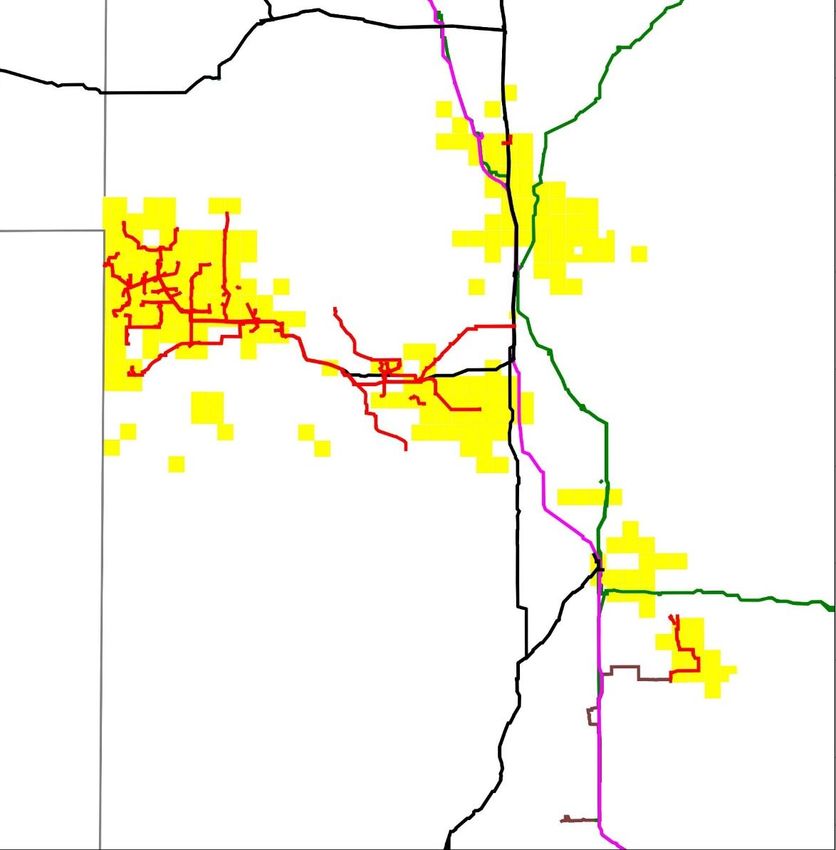
Balanced Commodities Profile, Poised For Flexibility & Efficient Growth
                                                                                                       Clean
                                                    State of the art emissions engineering        Sustainable
                                                                                                      Energy
                                    6 miles
                              Progress                                                                  High
                                                   Liquids growth limited only by markets             Quality
                                                                                                      Liquids

                                                                                                     Prolific
    Glacier
                                              Free cash focused on highest return projects             Gas
                                                                                                 Foundation

                                                                                                    Low-cost
                                                  Efficient gas plant, new oil infrastructure         Owned
                Valhalla                                                                        Infrastructure

                                                                                                     Resilient
                                                 Balanced commodities, market exposure                 In All
                       Pipestone/                                                                     Cycles
                       Wembley
                                                                                                 Disciplined
                                                Balance sheet drives pace of development           Financial
                                                                                                Management

                                                                                                           9
Advantage Montney – Multizone Oil, Liquids and Gas Throughout
Clean
Sustainable
Energy
High
Quality
Liquids
Prolific
Gas
Foundation
Low-cost
Owned
Infrastructure
Resilient
In All
Cycles
Disciplined
Financial
Advantage Operated HZ Management
Offset Operator HZ
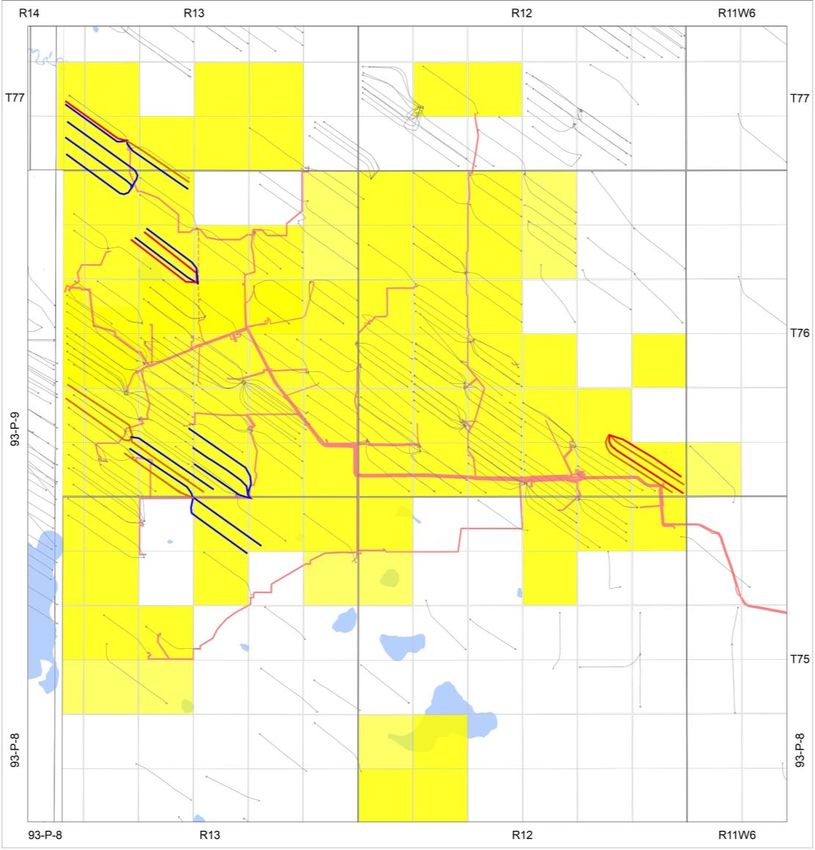
Current Drilling and 2021 Targets 10Glacier – Foundational Asset Setting a New Standard
Clean
• Six new D1 wells drilled and on stream in 2020
08-05 four well pad;
Sustainable
spud Q1 2021 • Eight wells to be completed during Q1 2021: Energy
• 02-11 pad (two D4 wells and two Upper wells) High
Quality
09 -32 three well pad; • 13-34 pad (three D1 and one D4 wells)
onstream Q4 2020 Liquids
• Final Q1 pad at 08-05 will be completed in Q3 2021
Prolific
• Achievements from H2 2020 program: Gas
0 1 -03 three well pad; ✓ Total well costs reduced 10% Foundation
onstream Q4 2020
✓ Revised frac designs delivering 87% higher IP30 vs Low-cost
prior two programs Owned
✓ Non-productive time required for equipping Infrastructure
reduced to 3 days vs ~21 days in prior programs Resilient
• All wells will produce into existing plant capacity at In All
1 3 -34 four well pad;
to be completed Q1 2021
02 -11 four well pad;
to be completed Q1 2021
negligible incremental operating cost Cycles
Montney D1 Tier 1 Half-cycle Economics(1) Disciplined
Current/Planned Locations
U p per Montney
( Oct 1 4 Strip; 2021 avg AECO C$2.78/gj & US$42.75/bbl WTI) Financial
Mo ntney D4
Type Well Rate of Return Payout Management
Mo ntney D1
10.1 Bcf, 7.4 bbl/mmcf 108% 1.1 years
(1) Management estimates. Rate of Return is assuming initial capital of $5.0 million per well
DCE+T and 1.5% escalation
11Pipestone/Wembley/Valhalla - Oil and Liquids-Rich Gas
Clean
Sustainable
Valhalla
Energy
• Facility running at capacity High
Valhalla
Quality
• 2 well pad planned to maintain volumes Liquids
• 4 delineated zones Prolific
1 4-04 two D4 wells Gas
• Offset drilling continues to validate Foundation
undeveloped lands Low-cost
Wembley Battery
Owned
0 3 -10 two D3 wells Pipestone/Wembley Infrastructure
• Advantage oil battery operational since Resilient
Q2 2020 In All
Pipestone/Wembley Cycles
• 8 producing Montney wells and 1 Disciplined
Active Drilling Rig
disposal well, performance meeting Financial
expectations Management
• 2 well pad to be drilled late 2021
12Progress – Prolific Oil and Gas Development
Clean
Sustainable
Kelt Oil Wells
Up to 153,000 bbls CTD
Tourmaline Oil Wells
Up to 152,000 bbls CTD
• 6 wells on production Energy
13-31 Montney (2017)
High
• 16-36: Produced 286 mboe (36% Quality
liquids) in 230 days Liquids
Prolific
• Pipeline connected to Glacier Gas
08-17 D2 - Producing plant; up to 2,000 bbl/d pipeline Foundation
capacity Low-cost
0 1-11 D2 Producing
1 6-36 producing Owned
• Progress competitive with Infrastructure
Pipestone/Wembley, and higher
Resilient
4 -21 Battery Site netbacks In All
2-34 Montney Cycles
(2018)
• Four intervals targeted for
Disciplined
Tie in to AAV
Glacier Plant 5-22 Montney
development Financial
(2018)
Management
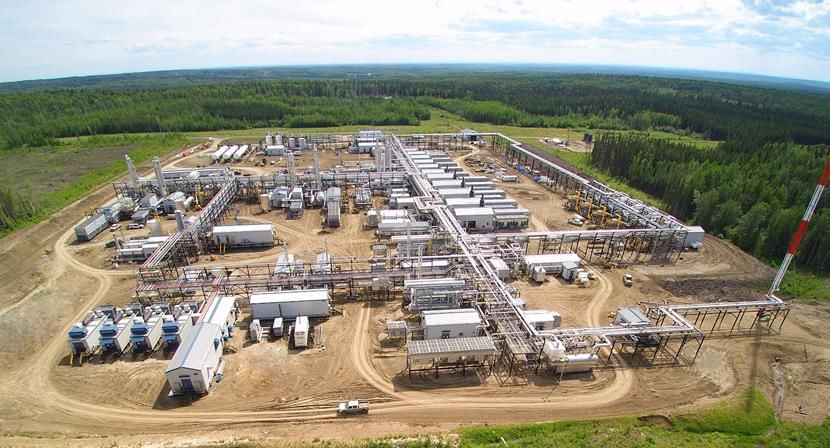
13Strategic Infrastructure Control, Flexible Pipeline Access
Clean
Sustainable
• 400 mmcf/d + 6,800 bbl/d capacity Glacier Plant; Energy
TCPL Groundbirch >120 mmcf/d surplus capacity available
L a teral
High
BC AB Advantage Glacier
• 45 mmcf/d + 2,000 bbl/d Valhalla hub Quality
Gas Plant
• 30 mmcf/d + 5,000 bbl/d Wembley hub Liquids
• 25 mmcf/d + 5,000 bbl/d Progress hub on hold Prolific
Gas
AAV Progress Liquids Hub
5 ,000 bbls/d on hold Foundation
Glacier Gas Plant (87.5% Owned) Low-cost
Owned
Key era
Pip estone Plant
Infrastructure
AAV Valhalla Liquids
Handling Hub
2 ,000 bbls/d Resilient
In All
Cycles
Disciplined
AAV Wembley Liquids Hub Financial
Tidewater Pipestone
Pla nt
5 ,000 bbls/d Q2 2020
Management
6 miles
14Natural Gas Transportation Portfolio
Clean
Sustainable
27 MMcf/d of TC Prairies Energy
Mainline to Nov 2032
27 MMcf/d of Great Lakes PL High
transport capacity Apr 2021 to Quality
Oct 2022 Liquids
Prolific
Gas
Foundation
Low-cost
Owned
Up to 48 MMcf/d of Empress capacity Infrastructure
net of downstream commitments –
varying term durations Resilient
54 MMcf/d of AECO to Dawn
LTFP Capacity to Oct 2027
In All
Cycles
Disciplined
Financial
Management
15Market Hedging Activities
Clean
Physical Flows Q1-20 Q2-20 Q3-20 Q4-20 2021 2022-2027 Sustainable
Energy
AECO 63% 49% 48% 30% 34% 30% - 70%
High
Empress 0% 0% 0% 7% 11% 10% - 20%
Quality
Emerson (TC Prairies Mainline) 0% 0% 0% 8% 3% 5% - 10% Liquids
Dawn 21% 22% 23% 24% 28% 5% - 30% Prolific
U.S. Midwest 16% 29% 29% 31% 24% 0% - 15% Gas
Foundation
Current Natural Gas Hedging Current Crude Oil Hedging
(MMcf/d) Low-cost
160 80% (bbls/d)
1400 60% Owned
Infrastructure
140 70%
$1.76 $1.76 1200 $44.82 $44.82 50%
120 60% $44.82 $44.82
100
$2.72 $2.72 50%
1000
$57.91 $56.53 $55.44 $55.44 40% Resilient
80
$3.16 $2.24 $2.24
40%
800
30%
In All
60
$2.33 $2.61
30%
600 Cycles
$2.24
$3.32 20%
$1.49 $1.49 $1.72 400
40 $2.26 $2.40 $2.40
$2.40
20%
10%
Disciplined
Financial
20 10% 200
Management
$2.30 $2.30 $2.30 $2.30 $2.73 $2.77 $2.77 $2.75 0 0%
- 0%
Q1-20 Q2-20 Q3-20 Q4-20 Q1-21 Q2-21 Q3-21 Q4-21 Q1-20 Q2-20 Q3-20 Q4-20 Q1-21 Q2-21 Q3-21 Q4-21
Henry Hub AECO Dawn Chicago % of Production Hedged WTI ($US/bbl) % of Liquids Production Hedged
16Financial Discipline Operationally Nimble Returns Focus
APPENDIX

           18
Area Overview – Deep Inventory of Gas, NGLs and Oil
Deep Inventory (1)(2)(3)
Booked Undeveloped Unbooked Upside
Progress
Glacier TOTAL future
location inventory
~1,400 to 1,500
743
Valhalla
89
301
Pipestone/ 199 25
123
Wembley
100 bbls/mmcf
• Total of ~210 net sections (134,400 net acres)
• Middle Montney is liquids-rich throughout (25 to 280 bbls/mmcf)
• Only 77 liquids-rich wells drilled to date – 5% of inventory
Liquids-rich
Middle Montney • Glacier Gas Plant (87.5% Owned)
– 400 mmcf/d raw gas capacity, 6,800 bbls/d liquids handling
(1) Management Estimates. Refer to Advisory.
(2) Based on Sproule December 31, 2019 Reserves Report.
(3) C + shallow cut recoveries. 19
3Advisory
Forward-Looking Information and Statements
The information in this presentation contains certain forward-looking information and forward-looking statements (collectively, "forward-looking statements") within the meaning of
applicable securities laws relating to the Corporation's plans and other aspects of its anticipated future operations, management focus, strategies, financial, operating and production
results and business opportunities. These statements relate to future events or our future intentions or performance. All statements other than statements of historical fact may be
forward-looking statements. The statements have been prepared by management to provide an outlook of the Corporation's activities and results and may not be appropriate for other
purposes. Forward-looking statements are often, but not always, identified by the use of words such as “seek”, “anticipate”, “plan”, “continue”, “estimate”, “guidance”, “demonstrate”,
“expect”, “may”, “can”, “will”, “project”, “predict”, “potential”, “target”, “objectives”, “intend”, “could”, “might”, “should”, “believe”, “would” and similar expressions and include statements
relating to, among other things, Advantage's focus, strategy and development plans; timing for wells to come on-stream; number of wells planned for the remainder of 2021; the
anticipated timing of wells being brought on production; the anticipation that the Valhalla compressor and liquids hub will be full for the remainder of 2021; developing additional
operational and infrastructure capability and how this will be achieved; annual liquids and gas production and the anticipated amount thereof; the Corporation's estimated net capital
expenditures for 2020 and 2021, including the expected allocation and timing of such expenditures and the anticipated effect of such expenditures on revenue and adjusted funds flow;
Advantage’s estimates of base decline rate and sustaining capital; Advantage’s ability to grow 2021 adjusted funds flow based on current natural gas futures pricing; the expected amount
of adjusted funds flow; anticipation that for 2021, anticipated debt repayment amount for 2021 and net debt to adjusted funds flow by the end of 2021; Advantage’s ability to reduce its
net debt to adjusted funds flow in 2021; royalty rate; operating expense; transportation expense and G&A/Finance expense for 2021; resource development potential of the Corporation's
assets and the Corporation's future drilling inventory; the Corporation's plans to continue to be a low-cost supplier of natural gas, increase free cash flow generation and strengthen
netback margins; the Corporation’s hedging activities and the benefits to be derived therefrom and other matters. Advantage’s actual decisions, activities, results, performance or
achievement could differ materially from those expressed in, or implied by, such forward-looking statements and accordingly, no assurances can be given that any of the events
anticipated by the forward-looking statements will transpire or occur or, if any of them do, what benefits that Advantage will derive from them.
With respect to the forward-looking statements contained in this presentation, Advantage has made a number of material assumptions regarding, but not limited to: conditions in
general economic and financial markets; the impact and duration thereof that the COVID-19 pandemic will have on (i) the demand for crude oil, NGLs and natural gas, (ii) the supply
chain including the Corporation’s ability to obtain the equipment and services it requires, and (iii) the Corporation’s ability to produce, transport and/or sell its crude oil, NGLs and natural
gas; effects of regulation by governmental agencies; current and future commodity prices; the Corporation's current and future hedging program; future exchange rates; future
production and composition including natural gas and liquids; royalty regimes and future royalty rates; future operating costs; future transportation costs and availability of product
transportation capacity; future general and administrative costs; the estimated well costs including frac stages and lateral lengths per well; the number of new wells required to achieve
the objectives of the 2020 and 2021 calendar years; that the Corporation will have sufficient adjusted funds flow, debt or equity sources or other financial resources required to fund its
capital and operating expenditures and requirements as needed.
20Advisory
Management has included the summary of assumptions and risks related to forward-looking information in order to provide shareholders with a more complete perspective on
Advantage's future operations and such information may not be appropriate for other purposes. Advantage’s actual results, performance or achievement could differ materially from
those expressed in, or implied by, these forward-looking statements and, accordingly, no assurance can be given that any of the events anticipated by the forward-looking statements
will transpire or occur, or if any of them do so, what benefits that Advantage will derive therefrom. Readers are cautioned that the foregoing lists of factors are not exhaustive. The
Corporation and management believe that the statements have been prepared on a reasonable basis, reflecting management's best estimates and judgments. However, because this
information is highly subjective and subject to numerous risks including the risks discussed above, it should not be relied on as necessarily indicative of future results. These forward-
looking statements are made as of the date of this presentation and Advantage disclaims any intent or obligation to update publicly any forward-looking statements, whether as a result
of new information, future events or results or otherwise, other than as required by applicable securities laws.
These statements involve substantial known and unknown risks and uncertainties, certain of which are beyond Advantage’s control, including, but not limited to: changes in general
economic, market and business conditions; industry conditions; impact of significant declines in market prices for oil and natural gas; actions by governmental or regulatory authorities
including increasing taxes and changes in investment or other regulations; changes in tax laws, royalty regimes and incentive programs relating to the oil and gas industry; the effect of
acquisitions; Advantage's success at acquisition, exploitation and development of reserves; failure to achieve production targets on timelines anticipated or at all; unexpected drilling
results; risk and assumptions used in estimating the 2020 and 2021 calendar year financial and operating results, including commodity prices, timing of expenditures and the focus of such
expenditures, change from current expectations; risk that the Corporation does not achieve the anticipated increases to production and revenues expected from the 2020 and 2021 net
capital expenditures; changes in commodity prices, currency exchange rates, net capital expenditures, reserves or reserves estimates and debt service requirements; the occurrence of
unexpected events involved in the exploration for, and the operation and development of, oil and gas properties, including hazards such as fire, explosion, blowouts, cratering, and spills,
each of which could result in substantial damage to wells, production facilities, other property and the environment or in personal injury; changes or fluctuations in production levels;
individual well productivity; lack of available capacity on pipelines; delays in anticipated timing of drilling and completion of wells; delays in completion of infrastructure; lack of available
capacity on pipelines; individual well productivity; competition from other producers; the lack of availability of qualified personnel or management; credit risk; changes in laws and
regulations including the adoption of new environmental laws and regulations and changes in how they are interpreted and enforced; our ability to comply with current and future
environmental or other laws; stock market volatility and market valuations; liabilities inherent in oil and natural gas operations; uncertainties associated with estimating oil and natural gas
reserves; competition for, among other things, capital, acquisitions of reserves, undeveloped lands and skilled personnel; incorrect assessments of the value of acquisitions; geological,
technical, drilling and processing problems and other difficulties in producing petroleum reserves; ability to obtain required approvals of regulatory authorities; and ability to access
sufficient capital from internal and external sources. Many of these risks and uncertainties and additional risk factors are described in the Corporation’s Annual Information Form dated
February 27, 2020 which is available at www.sedar.com and www.advantageog.com.
21Advisory
Oil and Gas Information
Barrels of oil equivalent ("boe") and thousand cubic feet of natural gas equivalent ("mcfe") may be misleading, particularly if used in isolation. Boe and mcfe conversion ratios have been
calculated using a conversion rate of six thousand cubic feet of natural gas equivalent to one barrel of oil. A boe and mcfe conversion ratio of 6 mcf: 1 bbl is based on an energy
equivalency conversion method primarily applicable at the burner tip and does not represent a value equivalency at the wellhead. Given that the value ratio based on the current price of
crude oil as compared to natural gas is significantly different from the energy equivalency of 6:1, utilizing a conversion on a 6:1 basis may be misleading as an indication of value.
This presentation discloses drilling inventory in the Glacier, Valhalla, Progress and Pipestone/Wembley areas in three categories: (i) proved locations; (ii) probable locations; and (iii)
unbooked locations. Proved locations and probable locations are derived from Sproule Associates Limited reserves evaluation effective December 31, 2019 and account for drilling
locations that have associated proved and/or probable reserves, as applicable. Unbooked locations are internal estimates based on our prospective acreage and an assumption as to the
number of wells that can be drilled per section based on industry practice and internal review. Unbooked locations do not have attributed reserves or resources. Of the 1,400 to 1,500
total drilling locations identified herein, 309 are proved locations, 38 are probable locations and 1,053 to 1,153 are unbooked locations. Unbooked locations have been identified by
management as an estimation of our multi-year drilling activities based on evaluation of applicable geologic, seismic, engineering, production and reserves information. There is no
certainty that the Corporation will drill all unbooked drilling locations and if drilled there is no certainty that such locations will result in additional oil and gas reserves, resources or
production. The drilling locations on which we actually drill wells will ultimately depend upon the availability of capital, regulatory approvals, seasonal restrictions, oil and natural gas
prices, costs, actual drilling results, additional reservoir information that is obtained and other factors. While certain of the unbooked drilling locations have been de-risked by drilling
existing wells in relative close proximity to such unbooked drilling locations, other unbooked drilling locations are farther away from existing wells where management has less
information about the characteristics of the reservoir and therefore there is more uncertainty whether wells will be drilled in such locations and if drilled there is more uncertainty that
such wells will result in additional oil and gas reserves, resources or production.
References in this presentation to production test rates, initial production rates, IP30 rates, flow rates, yields and other short-term production rates are useful in confirming the presence
of hydrocarbons; however, such rates are not determinative of the rates at which such wells will commence production and decline thereafter and are not indicative of long-term
performance or of ultimate recovery. Additionally, such rates may also include recovered "load oil" fluids used in well completion stimulation. While encouraging, readers are cautioned
not to place reliance on such rates in calculating the aggregate production of Advantage. Advantage cautions that the test results should be considered to be preliminary.
Advantage has presented certain type curves and well economics for its Montney areas. The type curves presented are based on Advantage's historical production. Such type curves and
well economics are useful in understanding management's assumptions of well performance in making investment decisions in relation to development drilling in the Montney area and
for determining the success of the performance of development wells; however, such type curves and well economics are not necessarily determinative of the production rates and
performance of existing and future wells and such type curves do not reflect the type curves used by our independent qualified reserves evaluator in estimating our reserves volumes.
The type curves differ as a result of varying horizontal well length, stage count and stage spacing. The type curves represent the average type curves expected. In this presentation,
estimated ultimate recovery represents the estimated ultimate recovery associated with the type curves presented; however, there is no certainty that Advantage will ultimately recover
such volumes from the wells it drills.
22Advisory
In presenting such type curves, inputs and economics information and in this presentation generally, Advantage has used a number of oil and gas metrics which do not have
standardized meanings and therefore may be calculated differently from the metrics presented by other oil and gas companies. Such metrics include DCE+T, "EUR", "NPV10", "payout",
"rate of return" or "ROR", "half cycle ROR", “operating netback“, “sustaining capital”, “growth capital”, and “base decline rate.” EUR represents the estimated ultimate recovery of
resources associated with the type curves presented. NPV10 represents the anticipated net present value of the future net revenue discounted at a rate of 10% associated with the type
curves presented. Payout means the anticipated years of production from a well required to fully pay for the DCE+T of such well. ROR means the rate of return of a well or the discount
rate required to arrive at a NPV equal to zero. Half cycle ROR means the rate of return of a well or the discount rate required to arrive at a NPV equal to zero when taking into account
"half cycle" costs, which include drilling, completion, equip and tie-in capital expenditures. Base decline rate is Management’s estimated annual reduction in corporate production from
currently producing wells that is expected to occur in the subsequent year. Sustaining capital is Management’s estimate of the capital required to drill, complete, equip and tie-in new
wells to existing infrastructure thereby offsetting the corporate base decline rate and maintain production at existing levels.
Production estimates contained herein are expressed as anticipated average production over the calendar year. In determining anticipated production for the year 2020 and 2021
Advantage considered historical drilling, completion and production results for prior years and took into account the estimated impact on production of the Corporation’s 2020 and 2021
expected drilling and completion activities.
Non-GAAP Measures
The Corporation discloses several financial and performance measures that do not have any standardized meaning prescribed under International Financial Reporting Standards ("IFRS"
or “GAAP”). These financial and performance measures include “net capital expenditures”, “adjusted funds flow”, “adjusted funds flow per share”, “net debt”, “net debt to adjusted funds
flow” and “free cash flow”. Such financial and performance measures should not be considered as alternatives to, or more meaningful than measures determined in accordance with
GAAP including “net income”, “comprehensive income”, “cash provided by operating activities”, or “cash used in investing activities”. Management believes that these measures provide
an indication of the results generated by the Corporation’s principal business activities and provide useful supplemental information for analysis of the Corporation’s operating
performance and liquidity. Advantage’s method of calculating these measures may differ from other companies, and accordingly, they may not be comparable to similar measures used
by other companies. “Net capital expenditures” include total capital expenditures related to property, plant and equipment and exploration and evaluation assets incurred during the
period. Management considers this measure reflective of actual capital activity for the period as it excludes changes in working capital related to other periods. The Corporation considers
“adjusted funds flow” to be a useful measure of Advantage’s ability to generate cash from the production of natural gas and liquids, which may be used to settle outstanding debt and
obligations, and to support future capital expenditures plans. Changes in non-cash working capital are excluded from adjusted funds flow as they may vary significantly between periods
and are not considered to be indicative of the Corporation’s operating performance as they are a function of the timeliness of collecting receivables or paying payables. Expenditures on
decommissioning liabilities are excluded from the calculation as the amount and timing of these expenditures are unrelated to current production, highly variable and discretionary. “Net
debt” is the total of bank indebtedness and working capital deficit. “Net debt to adjusted funds flow” is a ratio calculated as net debt divided by adjusted funds flow for the previous four
quarters. Net debt to adjusted funds flow is considered by management to be a useful measure as it is commonly used to evaluate the leverage of a company and the ability to settle
outstanding debt and obligations with cash generated from operations. Refer to the Corporation’s most recent Management’s Discussion and Analysis, which is available at
www.sedar.com and www.advantageog.com, for additional information about certain financial measures, including reconciliations to the nearest GAAP measures, as applicable.
23Advisory
Abbreviations
The following abbreviations used in this presentation have the meanings set forth below.
bbl barrel
bbl/d barrel per day
bbls/d barrels per day
bbls/mmcf barrels per million cubic feet
boe barrels of oil equivalent of natural gas, on the basis of one barrel of oil or natural gas liquids for six thousand cubic feet of natural gas
boe/d barrels of oil equivalent per day
GJ Gigajoule
mcf thousand cubic feet
mcfe thousand cubic feet equivalent on the basis of six thousand cubic feet of natural gas for one barrel of oil or natural gas liquids
mmcf/d million cubic feet per day
mmcfe/d million cubic feet equivalent per day
NGL natural gas liquids
DCE+T drill, complete, equip and tie-in
C3+ propane plus
C5+ pentanes plus
24Advantage Contact Information
Investor Relations
1.866.393.0393
ir@advantageog.com
www.advantageog.com
Listed on TSX: AAV
Advantage Oil & Gas Ltd.
Suite 2200, 440 – 2nd Avenue SW
Calgary, Alberta T2P 5E9
Main: 403.718.8000
Facsimile: 403.718.8332
Advantage Glacier Gas Plant
Andy Mah, P.Eng. Director, Chief Executive Officer
Mike Belenkie, P.Eng. President & Chief Operating Officer
Craig Blackwood, CPA, CA Chief Financial OfficerYou can also read