MULTIVARIATE MODELLING OF EFFECTIVENESS OF LUBRICATION OF Ti-6Al-4V TITANIUM ALLOY SHEET USING VEGETABLE OIL-BASED LUBRICANTS - Sciendo
←
→
Page content transcription
If your browser does not render page correctly, please read the page content below
ADVANCES IN MATERIALS SCIENCE, Vol. 21, No. 2(68), June 2021

 DOI: 10.2478/adms-2021-0009

Tomasz Trzepieciński 1,*, Marcin Szpunar 2
1
 Rzeszow University of Technology, Department of Materials Forming and Processing,
 Rzeszów, Poland
2
 Rzeszow University of Technology, Doctoral School of Engineering and Technical Sciences,
 Rzeszów, Poland
* tomtrz@prz.edu.pl

 MULTIVARIATE MODELLING OF EFFECTIVENESS OF
 LUBRICATION OF Ti-6Al-4V TITANIUM ALLOY SHEET USING
 VEGETABLE OIL-BASED LUBRICANTS

 ABSTRACT
The article presents the results of modelling the friction phenomenon using artificial neural networks and analysis
of variance. The test material was composed of strip specimens made of 0.5-mm-thick alpha-beta Grade 5
(Ti-6Al-4V) titanium alloy sheet. A special tribotester was used in the tests to simulate the friction conditions
between the punch and the sheet metal in the sheet metal forming process. A test called the strip drawing test has
been conducted in conditions in which the sheet surface is lubricated with six environmentally friendly oils (palm,
coconut, olive, sunflower, soybean and linseed). Based on the results of the strip drawing test, a regression model
and an artificial neural network model were built to determine the complex interactions between the process
parameters and the friction coefficient. A multilayer perceptron with one hidden layer and eight neurons in this
layer showed the best fit to the training data. The network training was conducted using three algorithms, i.e.
Levenberg-Marquardt, back propagation and quasi-Newton. Taking into consideration both the coefficient of
determination R2 (0.962) and S.D. ratio (0.272), the best regression characteristics were presented by the network
trained using the Levenberg-Marquardt algorithm. From the response surfaces of the quadratic regression model
it was found that an increase in the density of lubricant at a specific pressure causes a reduction in the coefficient
of friction. Low density and high kinematic viscosity of the oil leads to a high coefficient of friction.

Keywords: coefficient of friction; sheet metal; sheet metal forming; Ti-6Al-4V; titanium alloy

 INTRODUCTION

 The friction occurring during plastic working is a very complicated phenomenon because
the real contact surface is not equal to the nominal [1]. The real contact area consists of many
micro-areas of contact, the total area of which increases with increasing pressure [2]. Contact
surfaces are covered with layers of oxides and so-called adsorption layers with a thickness of
approx. 10-7–10-6 mm that consist of atoms or molecules of substances existing in the earth's
atmosphere held on material surfaces by the interaction of atomic forces [3, 4]. During the sheet
metal forming (SMF) process, the properties of the surfaces of the tool and the workpiece in
contact with each other may change. The temperature formed in the micro-areas of the contact
T. Trzepieciński, M. Szpunar: Multivariate modelling of effectiveness of lubrication of Ti-6Al-4V 27
titanium alloy sheet using vegetable oil-based lubricants

may lead to plasticisation of the roughness asperities and oxidation of the material [5, 6]. Tool
wear and workpiece layer abrasion processes take place, generally with different intensity
[7, 8]. In this way, wear products can disturb friction conditions and lower the surface finish of
products. In the case of the forming of titanium and its alloys, the minimisation of friction is
crucial because these sheets exhibit a great susceptibility to galling [9, 10].
 The basic parameter that describes the phenomenon of friction in sheets subjected to plastic
working is the coefficient of friction (COF). The COF should be treated as a certain
proportionality factor between the tangential and normal stress on the area of contact surface in
a specific forming process. Its value may vary widely depending on the type of lubricant,
properties of the friction surfaces, sliding speed, lubrication method, unit pressure and
processing temperature.
 The basic way to ensure the good quality of the surface of tools is to apply coatings with
appropriate functional properties. The effectiveness and durability of the coating depend on the
method of its preparation. The adhesion of the lubricating coating, surface roughness and
hardness of the substrate define the preliminary conditions in the tribological evaluation of the
cooperating friction pair. The surfaces of the SMF tools are also subjected to surface treatment,
such as polishing, grinding or texturing. Laser or photochemical texturing enables the control
of the number of lubricant pockets constituting reservoirs of lubricant. By texturing the surface,
the range of loads and sliding speeds for which hydrodynamic lubrication is extended. Due to
the presence of different conditions with regard to the pressure forces in the individual areas of
the drawpiece, a series of tribological tests were developed. Two main groups of tribological
tests were developed. The tests simulating tribological conditions model the geometrical
interactions of the friction pair. The process simulation tests are designed to manipulate plastic‐
forming operations while maintaining process kinematics. There are many friction tests
simulatingreal contact conditions in SMF: strip drawing test, draw-bead test, strip-tension test,
bending under tension and strip-reduction testing.
 One of the most effective ways of reducing friction in SMF is to lubricate the sheet surface.
In SMF various types of lubricants are used, which to a greater or lesser extent separate the
surfaces of the tool and the shaped material from each other. The type of lubricant also has a
decisive influence on the type of friction that occurs, i.e. boundary and mixed. The change of
the COF value depends on the type of lubricant and the ratio of film thickness to roughness
height and is expressed by Stribeck's curve [11]. As the industrial community moves towards
green manufacturing processes, there is an increased demand for bio-degradable lubricants [12].
Apart from conventional synthetic lubricants, lubricants based on vegetable oils are more and
more frequently used in SMF practice [13]. Due to high unit pressures and large friction
displacements of materials, it is not always possible to maintain a continuous layer of lubricant,
which results in the occurrence of various friction mechanisms in individual areas of the
drawpiece.
 The above-mentioned factors influencing the friction phenomenon show a synergistic
effect and therefore it is very difficult to determine their influence on COF without statistical
analysis. Multivariate methods are used to evaluate and collect the statistical data to clarify and
explain relationships between different variables that are associated with this data [14].
Ikpambese and Lawrence [15] applied multiple linear regression and an artificial neural
network (ANN) to predict the friction of brake pads. Both methods were found suitable for the
prediction of the COF. Sudheer et al. [16] performed analysis of variance (ANOVA) to obtain
the contribution of control parameters on the coefficient of friction of epoxy/glass/potassium
titanate whisker composites in pin-on-disk tests. The results of the polynomial models
developed by ANOVA agree well with the experimental values. ANOVA reveals the physically
and statistically significant factors which influence the COF of AA6061/B4C composites
28 ADVANCES IN MATERIALS SCIENCE, Vol. 21, No. 2 (68), June 2021

determined in a pin-on-disk type tribotester [17]. The tribological behaviour of fibre-reinforced
epoxy composites predicted using ANN-single hidden layer and regression analysis has been
studied by Egala et al. [18]. It was found that an ANN with multi-hidden layers predicts the
tribological performance accurately and was then followed by the regression model. Yunus and
Alsoufi [19] used ANOVA to evaluate the significance of each process parameter (sliding
speed, applied pressure, sliding velocity) to minimise the COF of thermally sprayed industrial
ceramic coatings.
 In view of the above, it is evident that ANOVA and artificial neural networks are utilised
to predict the friction of both metallic and composite sheets. Less work has been carried out on
the study of the effect of the physico-chemical parameters of the lubricant on the value of the
COF in SMF. Accordingly, this work is aimed at studying the performance of different synthetic
and environmentally friendly lubricants using ANOVA and ANNs. The data set is comprised
of the results of the strip drawing test (SDT) of alpha-beta Grade 5 (Ti-6Al-4V) titanium alloy
sheet. The process parameters are lubricant type and nominal pressure.

 EXPERIMENTAL

Material
 Alpha-beta Grade 5 titanium alloy sheets with a thickness of 0.5 mm were used in the
investigations. The chemical composition of the tested alloy is listed in Table 1. According to
the ASTM B348 [20], some selected mechanical properties of Grade 5 titanium alloy are as
follows: yield stress Rp0.2 = minimum 827 MPa, ultimate tensile stress Rm = minimum 896 MPa,
elongation A = 10%.
 Basic surface roughness parameters (Table 2) of the Grade 5 sheet surface are determined
using Bruker Contour GT 3D optical measuring tool. Surface topography of the Grade 5 sheet
surface is shown in Fig. 1.

 Table 1. Chemical composition of the Grade 5 titanium alloy (wt.%) [21]

 Al V C Fe O N H Ti
 5.5-6.75 4.5-5.5
T. Trzepieciński, M. Szpunar: Multivariate modelling of effectiveness of lubrication of Ti-6Al-4V 29
titanium alloy sheet using vegetable oil-based lubricants

 Fig. 1. Surface topography of the Grade 5 sheet surface

Tribological test
 COFs were determined using the strip drawing test as a friction simulator (Fig. 2). The
frame of the friction simulator was mounted in the lower bracket of a Zwick/Roell Z100
uniaxial tensile testing machine. The specimens, in the form of strips with length l = 200 mm
and width w = 18 mm, were mounted in an upper bracket of the testing machine. The pressure
of the cylindrical countersamples with a radius of R = 10 mm was exerted on the specimen
through a working spring and was achieved by a reduction of the height of the spring through
a bolt. Based on the load-displacement linear characteristics of the spring, the values of the load
have been determined and six levels of load between 50 and 200 N were considered. The
average surface roughness of the set of rollers was Ra = 0.32 μm. Surface topography of the
countersamples is shown in Fig. 3.

 Fig. 2. Schematic diagram of friction simulator: 1 – bottom grip of testing machine, 2 – base, 3 – upper grip of
 testing machine, 4 – specimen, 5 – spring, 6 – bolt, 7 – mandrel, 8 – fixing pin, 9 – teflon insert,
 10 – working rollers
30 ADVANCES IN MATERIALS SCIENCE, Vol. 21, No. 2 (68), June 2021

 Fig. 3. Surface topography of the rolls with Ra = 0.32 mm
 The value of the coefficient of friction was estimated according to the following equation

 = (1)
 2
where Ft is the tangential (friction force), Fc is the normal (clamping) force.
 The nominal contact pressure in the contact of the cylindrical countersample and strip sheet
metal has been calculated according to formula [2]:

 0.4182 ∙ ∙
 =√ (2)
 ∙

where E = 115 GPa is the Young’s modulus of Grade 5 titanium alloy, w is the specimen width
and R is the radius of the countersample.
 The countersamples and strip specimens were cleaned with acetone. The friction test was
carried out in lubricated conditions. Six vegetable oils, i.e. palm oil, coconut oil, olive oil,
linseed oil, soybean oil, and sunflower oil, were selected according to the relevant literature
[13, 22-25]. The basic physical properties of these oils are listed in Table 3. The sheet metals
were lubricated using a teflon shaft. The lubricant was applied in an amount of 2 g/m2.

 Table 3. Basic physical properties of the oils used in the test [25]

 Kinematic viscosity ηk,
 Oil type Density ρ, kg/m3
 mm2/s
 olive 892 4.52
 linseed 890 3.74
 sunflower 878 4.45
 palm 875 5.72
 soybean 885 4.05
 coconut 805 2.75

ANOVA analysis
 Quadratic multivariate ANOVA analysis was performed based on the results of the SDT.
The nominal pressure, oil density, and kinematic viscosity parameters of the oil were included
in the regression model (Table 4). The explained variable was the coefficient of friction.
T. Trzepieciński, M. Szpunar: Multivariate modelling of effectiveness of lubrication of Ti-6Al-4V 31
titanium alloy sheet using vegetable oil-based lubricants

 Table 4. Factors and levels for ANOVA analysis

 Factor Name Unit Type Minimum Maximum Mean Std. Dev.
 A Density kg/m3 Numeric 837 891 875.22 15.00
 Kinematic
 B mm2/s Numeric 4.05 105.3 31.24 34.42
 viscosity
 C Pressure MPa Numeric 50 200 125 51.72

 Based on backward elimination regression analysis, explanatory variables A, B, C were
introduced into the model with the assumed significance level of α = 0.05. The backward
elimination method, using the analysis of variance in regression, allows for the selection of
statistically significant variables, i.e. those whose influence on the dependent variable being
analysed is the strongest. At each step, the independent variable with the highest probability
corresponding to Fisher's parameter F is removed from the model, if the probability (P-value)
is sufficiently high (in this research not less than 0.10). The significance of the regression
coefficients obtained was assessed on the basis of the F-test.

ANN modelling
 In the research included in this paper, the feedforward multilayer perceptron is applied. It
consists of an input layer, a hidden layer, and an output layer. In each of these layers there is a
specific number of neurons. The number of neurons in the input and output layers is determined
by the number of explanatory and explained variables, respectively. There are no connections
between neurons inside the layers. A set of data, both the input data and the corresponding
output data, is called the training set. The load pressure and physical parameters of vegetable
oil-based lubricants were used as the training set, i.e. kinematic viscosity and density. The
output parameter was the COF. The min-max function was used to normalise the training data:

 ( − )
 = ( − ) + (3)
 −

where D - value of the variable subjected to normalisation, and (min, max) is the interval in
which the original data are contained and (Nmin = −1, Nmax = 1) is the new interval.
 The results of the experimental tests have been assigned to the training set. In order to
independently check the convergence of the training algorithm, 20% of the data included in the
training set was assigned to the verification set.
 The network training process was carried out using back propagation (BP), the Levenberg-
Marquardt (LM) algorithm and the quasi-Newton (qN) algorithm.
 The back propagation learning cycle consists of the following stages:
• determination of the response of the output layer neurons and hidden layers to a given input
 signal,
• determining the error made by neurons located in the output layer and sending it towards the
 input layer,
• adaptation of weights.
 The back propagation algorithm defines the procedure of weight correction in a multilayer
network using gradient optimisation methods. The correction of the net weight vector is based
on the minimisation of the error measure function (objective function), which was defined as
the sum of squared errors at the network outputs. If the weights of learned neurons are updated
after each element is presented, then the objective function has the form:
32 ADVANCES IN MATERIALS SCIENCE, Vol. 21, No. 2 (68), June 2021 1 2 (4) = ∑( ( ) − ( )) 2 =1 where E is the loss for the output, zk(t) is an output and yk(t) is the target. The weights were corrected after the presentation of the entire learning sequence. In order to minimise the mean square error, the steepest descent rule was used: ∆ = − (5) where Δwkj is the new weight, E is the loss for the output, is the training coefficient and wkj is the old weight. The LM second-order optimisation algorithm is currently one of the most commonly used methods for training unidirectional neural networks. This is mainly due to its simple implementation, quick convergence, and not very high computational complexity. It is based on solving the nonlinear problem using the least squares method. The qN algorithm is an alternative to the LM algorithm. The idea behind the method is to approximate Hessian or its reciprocal using first derivatives. The following parameters were adopted as network quality indicators: root mean square (RMS) error and determination coefficient R2: 1 2 = √ ∑| − | (6) =1 2 2 ∑ =1( − ) = 1−( 2 ) (7) ∑ =1( ) where p is the predicted value, a is the actual value and n is the number of vectors in training sets. RESULTS AND DISCUSSION Results of ANOVA High levels of the factors are coded as +1, while low levels are coded as −1. Then the quadratic regression equation in terms of coded factors is as follows: COF = 0.2344 − 0.0158 + 0.0125 − 0.0179 − 0.0228 + 0.0012 − 0.0014 + 0.0005 2 + 0.0208 2 (8) − 0.0028 2
T. Trzepieciński, M. Szpunar: Multivariate modelling of effectiveness of lubrication of Ti-6Al-4V 33
titanium alloy sheet using vegetable oil-based lubricants

 The F-value of 26.85 (Table 5) implies the model is significant. There is only a 0,01%
chance that an F-value this large could occur due to noise. The total coefficient of determination
R2 of the regression model is 0.9131 (Table 6). The predicted R2 of 0.8303 is in reasonable
agreement with the adjusted R2 of 0.8791 because the difference is less than 0.2. An adequacy
precision greater than 4 indicated an adequate regression model.

 Table 5. Results of ANOVA for the response surface reduced quadratic model

 Source Sum of squares Mean square F-value p-value Meaning
 Model 0.0070 0.0008 26.85 < 0.0001 significant

 Table 6. Fit statistics of the quadratic regression model

 Parameter Value
 Std. Dev. 0.0054
 Mean 0.2257
 Coefficient of variation % 2.38
 R2 0.9131
 Adjusted R2 0.8791
 Predicted R2 0.8303
 Adequacy precision 20.4776

 The relationship between the predicted and actual values of the COF lies along a straight
line (Fig. 4a). The proportional distribution of the COF values along the regression line prove
a good correlation of data across the entire range of variability of input parameters. The normal
probability plot of residuals is also represented by a straight line (Fig. 4b). The analysis of the
distribution of regression residuals is one of the most important steps in regression analysis.
The residuals are a series of negative and positive differences between the observed dependent
variable and the analytical observations obtained from the regression model. The proportional
distribution of studentised residuals along the baseline (Fig. 5) confirms the normal distribution
of the data. The normal distribution of the residuals is necessary for the performance of the F-
test, depending on the assumption of the normal distribution.

 Fig. 4. (a) predicted versus actual values of COF and (b) normal probability plot.
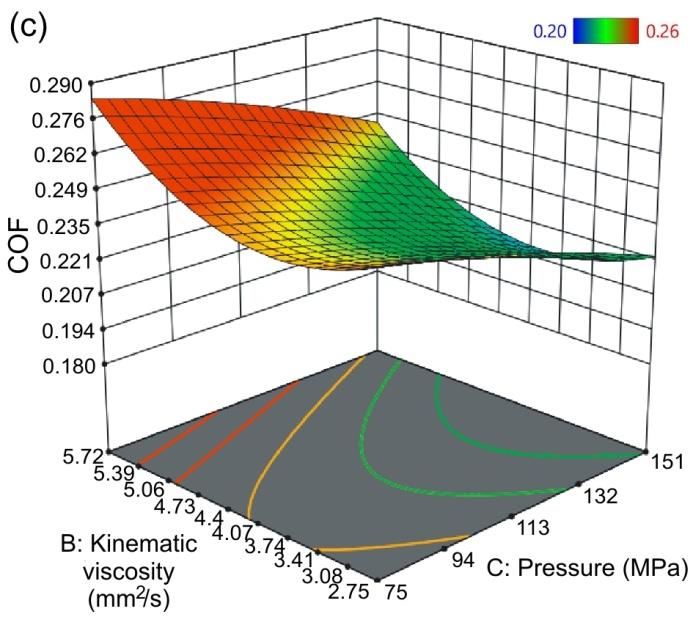
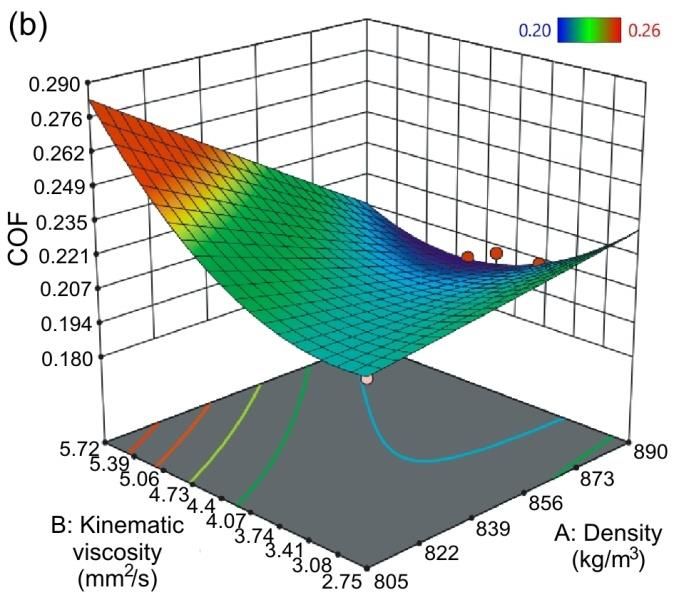
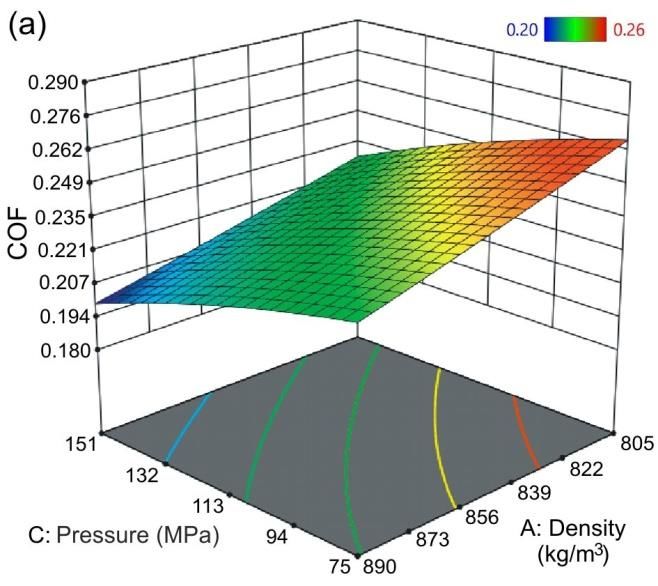
34 ADVANCES IN MATERIALS SCIENCE, Vol. 21, No. 2 (68), June 2021

 Fig. 5. Distribution of studentised residuals

 As the nominal pressure increases, the value of the COF decreases (Figs. 6a and 6c). In the
SDT the tangential (friction) force does not change proportionally with the normal force. This
phenomenon is also observed in a previous papers of the authors [2, 13]. Therefore, the COF
value determined from Eq. (1) is not constant over a wide range of clamping force changes.
According to the well-known classic Amontons-Coulomb friction law, the COF does not
depend on the area of contact. In SMF, where the tool comes into contact with a relatively soft
body (workpiece), the pressures may exceed the yield point of the sheet material many times
over. Under these conditions, the value of the COF depends on the mechanical interactions
between surface asperities of the bodies in contact.
 An increase in the density of the lubricant at a specific pressure reduces the value of the
COF (Fig. 6a). Denser oil provides a suitable lubricant pad that effectively separates the
contacting surfaces. If oil is deposited in the closed valleys of the surface topography,
favourable conditions are created for the formation of "oil pockets" [2, 26]. The highest values
of COF were observed during lubrication with vegetable oil-based lubricants with low density
and high kinematic viscosity. By contrast, the lowest values of COF are produced with oils with
high density and medium kinematic viscosity (Fig. 6b). This requirement is met by olive oil.
The relationship between the kinematic viscosity of oil and pressure takes a saddle shape (Fig.
6c). The optimal range of changes in the kinematic viscosity value to ensure effective
lubrication over the entire range of applied pressures is between 3.41 and 4.07 mm2/s. The tests
conducted on the dry friction of the test sheets in the same pressure range found values of the
COF in the range 0.28-0.34 depending on the pressure applied.

Results of ANNs
 Due to the lack of universal guidelines for the selection of the network architecture for
modelling a specific problem, a number of experiments were carried out in the Statistica
program to find the network structure producing the lowest value of network error and the
highest value of determination coefficient. For this purpose, the automatic algorithm built into
the Statistica program performs many experiments to select the network structure on the basis
of the set of input data presented and the corresponding COF values. As a result of searching
for the optimal network, the ANN with the architecture 3:3-8-1:1 (Fig. 7) with eight neurons in
the hidden layer was selected.
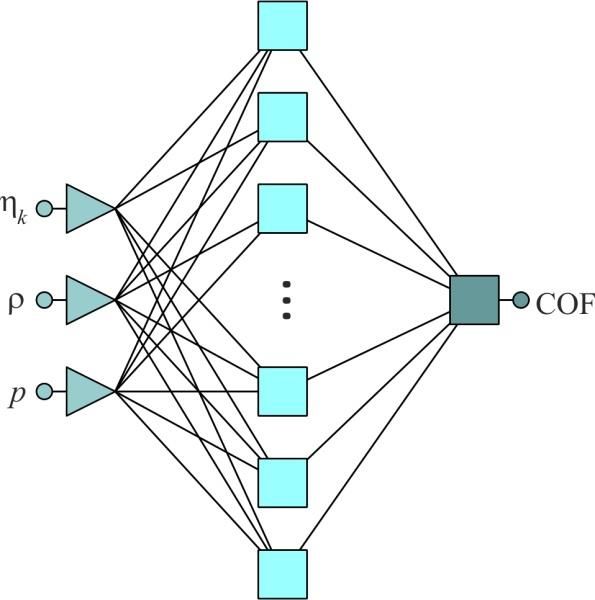
T. Trzepieciński, M. Szpunar: Multivariate modelling of effectiveness of lubrication of Ti-6Al-4V 35
titanium alloy sheet using vegetable oil-based lubricants

 Fig. 6. Surface responses for COFs: effect of (a) pressure and oil density, (b) kinematic viscosity of oil and oil
 density and (c) kinematic viscosity of oil and pressure on the value of the COF

 Fig. 7. Architecture of a neural network 3:3-8-1:1
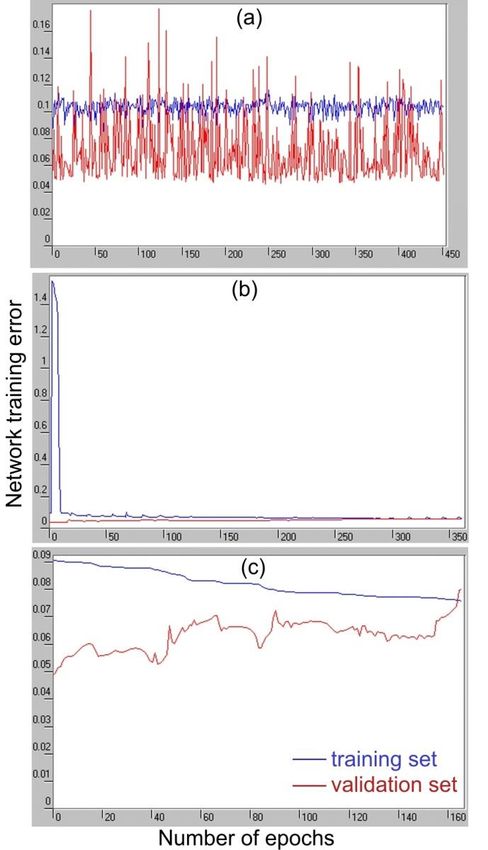
36 ADVANCES IN MATERIALS SCIENCE, Vol. 21, No. 2 (68), June 2021

 Graphs of changes in the network training errors are presented independently for the
training set (blue line) and validation set (red line) in Fig. 8. To prevent overlearning, the
training process was completed after observing no further decrease in error for the training set
(Fig. 8a and 8c) or when the network training error value for the validation set was greater than
for the training set (Fig. 8b). For all learning algorithms, the value of the training error for the
validation set was lower than for the training set. This testifies well to the convergence of the
learning process based on the training set.
 During the learning process using the BP algorithm, large fluctuations in the error value
were observed (Fig. 8a). This is typical for this algorithm because the error is minimised from
the last layer to the input layer in the direction opposite to the information flow in the network.
The trend of network error for the training set is very stable and only minimally decreases with
an increasing number of epochs (blue line in Fig. 8a).
 The best convergence is provided by the qN algorithm for which only about 160 epochs
were sufficient to reach the minimum RMS error for the training set (Fig. 8c) equal to 0.1441
(Table 7). The LM algorithm required more epochs to complete the learning process (Fig. 8b),
but at the same time the RMS error value for the training set is the smallest among all the
algorithms (RMS = 0.1378).

 Fig. 8. Variation of network training errors vs. number of epochs during network training with the BP (a), LM (b)
 and qN (c) algorithms
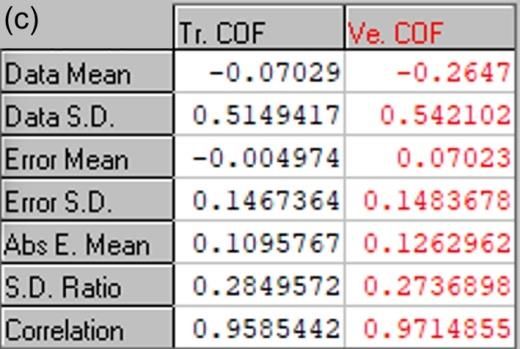
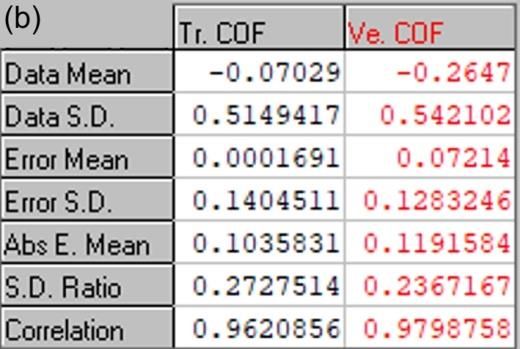
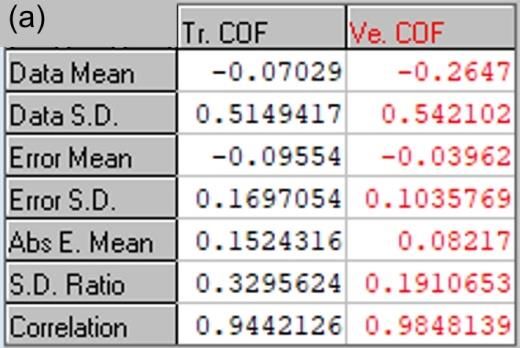
T. Trzepieciński, M. Szpunar: Multivariate modelling of effectiveness of lubrication of Ti-6Al-4V 37
titanium alloy sheet using vegetable oil-based lubricants

 Table 7. Values of RMS errors of the networks trained using different algorithms

 Training algorithm
 Source
 BP LM qN
 RMS error (training set) 0.1920 0.1378 0.1441
 RMS error (validation set) 0.1025 0.1376 0.1526

 The network with the minimum RMS error for the training set is the network trained using
the LM algorithm. This network also provided the highest coefficient of determination for the
training set (Fig. 9b). However, it should be emphasised that the remaining networks had a
similar R2-value. The R2-values for the networks trained with BP and qN algorithms were higher
by 1.86% (Fig. 9a) and 0.4% (Fig. 9c), respectively. Apart from the coefficient of
determination, an important parameter of ANN performance is the standard deviation ratio
(S.D. ratio), which defines the quality of the network as the ratio of the standard deviation of
the error of the explained variable (Error S.D.) to the standard deviation of the data (Data S.D.).
A value of this parameter which is lower than 0.3 demonstrates a very good quality of ANN
model [27]. The smallest value of this parameter is provided by the network learned with the
Levenberg-Marquardt algorithm (Fig. 9b).

 (a) (b)

 (c)

 Fig. 9. Basic regression statistics of the ANNs investigated which were trained using the BP (a), LM (b) and qN
 (c) algorithms

 CONCLUSIONS

 The ANN experiments conducted confirmed that it was possible to use them for modelling
the COF of Grade 5 titanium alloy sheets in lubricated conditions. The coefficients of
determination of all the networks investigated were higher (R2 > 0.94) than that of the regression
model (R2 = 0.9131). Taking into account both the coefficient of determination R2 and S.D.
38 ADVANCES IN MATERIALS SCIENCE, Vol. 21, No. 2 (68), June 2021

ratio, the best regression characteristics were presented by the network trained using the
Levenberg-Marquardt algorithm. An increase in the density of lubricant at a specific pressure
reduces the value of the COF. The highest values of COF were observed during lubrication with
vegetable oil-based lubricants with low density and high kinematic viscosity. The change in the
value of the COF for all the oils tested in the pressure range 75-151 MPa was in the range of
approx. 0.19-0.26. This gives a positive premise for the use of vegetable oil-based lubricants in
SMF, taking into account that the COF of the titanium sheets tested, determined under dry
friction conditions, was 0.28-0.34 depending on the pressure applied.

 ACKNOWLEDGEMENT

The authors of this paper would like to kindly thank Dr. Romuald Fejkiel from Carpatian State
School in Krosno for the help in conducting the tribological experiments.

 REFERENCES

1. Trzepiecinski T., Lemu H.G.: Recent developments and trends in the friction testing for
 conventional sheet metal forming and incremental sheet forming. Metals 10 (2020) 47.
2. Trzepieciński T., Fejkiel R.: On the influence of deformation of deep drawing quality steel sheet
 on surface topography and friction. Tribology International 115 (2017) 78–88.
3. Zafaruddin F., Dolas D.R.: Experimental investigation of organic brake pad. International Journal
 of Advance Research and Innovative Ideas in Education 2(6) (2016) 213–219.
4. https://mail.pk.edu.pl/~kmiernik/dydaktyka/materialy/obrplast/lab3.pdf (dostęp: 25.03.2021).
5. Dou S., Xia J. Analysis of sheet metal forming (stamping process): A study of the variable friction
 coefficient on 5052 aluminum alloy. Metals 9 (2019) 853.
6. Dyja K., Adamus J.: Badania nad doborem smarów technologicznych do tłoczenia blach
 aluminiowych i tytanowych. Tribologia 3 (2014) 19-28.
7. Jaworski J., Trzepiecinski T.: Research on durability of turning tools made of low-alloy high-speed
 steels. Kovove Materialy-Metallic Materials 54(1) (2016) 25–17.
8. Jaworski J., Kluz R., Trzepiecinski T.: Operational tests of wear dynamics of drills made of low-
 alloy high-speed HS2-5-1 steel. Eksploatacja i Niezawodnosc-Maintenance and Reliability 18(2)
 (2016) 271–277.
9. Ma J., Yang H., Li H., i in.: Tribological behaviors between commercial pure titanium sheet and
 tools in warm forming. Transactions of Nonferrous Metals Society of China 25 (2015) 2924–2931.
10. Martínez C., Briones F., Araya N. i in.: Influence of the synthesis technique on tribological behavior
 of a Ti-6Al-4V alloy. Materials Letters 281 (2020), 128627.
11. Makhkamov A.: Tribology in sheet metal forming. PhD Thesis, Universidade do Porto, Porto 2017.
12. Lovell M.R., Kabir M.A., Menezes P.L. i in.: Influence of boric acid additive size on green lubricant
 performance. Philosophical Transactions of the Royal Society A. 368 (2010) 4851–4868.
13. Trzepieciński T.: Tribological performance of environmentally friendly bio-degradable lubricants
 based on a combination of boric acid and bio-based oils. Materials 13 (2020) 3892.
14. Fydrych D., Świerczyńska A., Rogalski G. i in.: Application of multivariate analysis methods in
 welding engineering. Biuletyn Instytutu Spawalnictwa 5 (2018) 137–145.
T. Trzepieciński, M. Szpunar: Multivariate modelling of effectiveness of lubrication of Ti-6Al-4V 39
titanium alloy sheet using vegetable oil-based lubricants

15. Ikpambese K.K., Lawrence E.A. Comparative analysis of multiple linear regression and artificial
 neural network for predicting friction and wear of automotive brake pads produced from palm
 kernel shell. Tribology in Industry 40(4) (2018) 565–573.
16. Sudheer M., Prabhu R., Raju K. i in.: Modeling and analysis for wear performance in dry sliding
 of epoxy/glass/PTW composites using full factorial techniques. International Scholarly Research
 Notices 2013 (2013) 624813.
17. Monikandan V.V., Jacob J.C., Joseph M.A. i in.: Statistical analysis of tribological properties of
 aluminum matrix composites using full factorial design. Transactions of the Indian Institute of
 Metals 68 (2015) 53–57.
18. Egala R., Jagadeesh G.V., Setti S.G.: Experimental investigation and prediction of tribological
 behavior of unidirectional short castor oil fiber reinforced epoxy composites. Friction 9 (2021)
 250–272.
19. Yunus M., Alsoufi M.S.: Multi-output optimization of tribological characteristics control factors
 of thermally sprayed industrial ceramic coatings using hybrid Taguchi-grey relation analysis.
 Friction 4(3) (2016) 208–216.
20. ASTM B348. Standard specification for titanium and titanium alloy bars and billets.
21. ASTM F1108 – 14. Standard specification for titanium-6Aluminum-4Vanadium alloy castings for
 surgical implants.
22. Bahari A., Lewis R., Slatter T.: Friction and wear phenomena of vegetable oil-based lubricants with
 additives at severe sliding wear conditions. Tribology Transactions 61 (2018) 207–219.
23. Karmakar G., Ghosh P., Sharma B.K. Chemically modyfying vegetable oils to prepare green
 lubricants. Lubricants 5 (2017) 44.
24. Mobarak H.M., Mohamad E.N., Masjuki H.H. i in.: The prospects of biolubricants as alternatives
 in automotive applications. Renewable and Sustainable Energy Reviews 33 (2014) 34–43.
25. Trzepiecinski, T. Effect of the plastic strain and drawing quality on the frictional resistance of steel
 sheets. Acta Metallurgica Slovaca 26(2) (2020) 42–44.
26. Sulaiman M.H., Christiansen P., Bay N.: Influence of tool texture on friction and lubrication in
 strip reduction. Procedia Engineering 207 (2017) 2263–2268.
27. Puc M. Artificial neural network model of the relationship between Betula pollen and
 meteorological factors in Szczecin (Poland). International Journal Biometeorology 56 (2012) 395–
 401.
You can also read