PRESENTATION OF FY2019 RESULTS - Arvida Group Limited Year Ended 31 March 2019 27 May 2019
←
→
Page content transcription
If your browser does not render page correctly, please read the page content below

PRESENTATION OF
  FY2019 RESULTS

          Arvida Group Limited
      Year Ended 31 March 2019

                    27 May 2019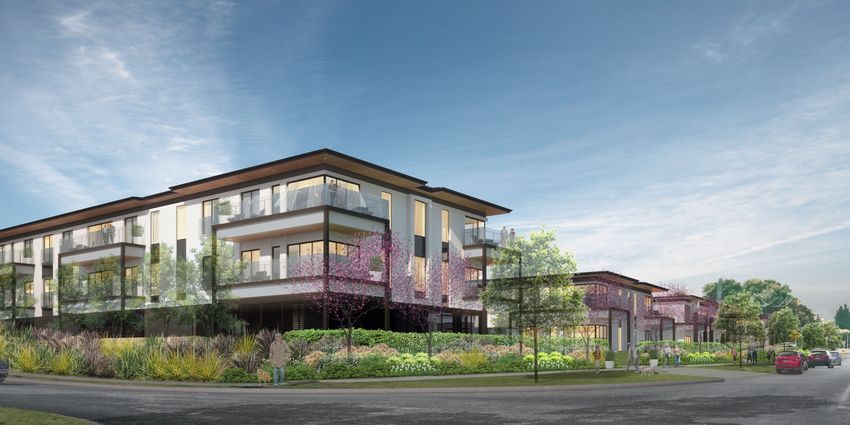
FY2019 RESULT HIGHLIGHTS
Continued strong financial and operational performance
$5.6m lift in Underlying Profit1 to $38.6m
Continued high care occupancy at 96% underpins strong cash flows
Lengthening of MoH certification periods to an average of 3.7 years with 17 (65%) now
attained gold standard 4 year certification
Resale margin of 23%, up from 20% in FY18
Resale volumes up 19%; total resale proceeds up 30% to $87.1m
Delivered 113 new units for FY19 in line with guidance, lifting to 170 new units in FY20
Annual delivery rate to exceed 200 units in FY21
Development margin of 18% on $44.3m new unit sales in period
Increased development pipeline with new greenfield site acquired in Kerikeri
Engagement survey recorded 96% staff give their best everyday
Continued improvement in resident NPS scores
1. Underlying Profit is a non-GAAP unaudited financial measure and differs from NZ IFRS net profit after tax. A reconciliation to Reported Net Profit after Tax is provided in the
financial section of this presentation and definition appended.
FY19 RESULTS PRESENTATION
2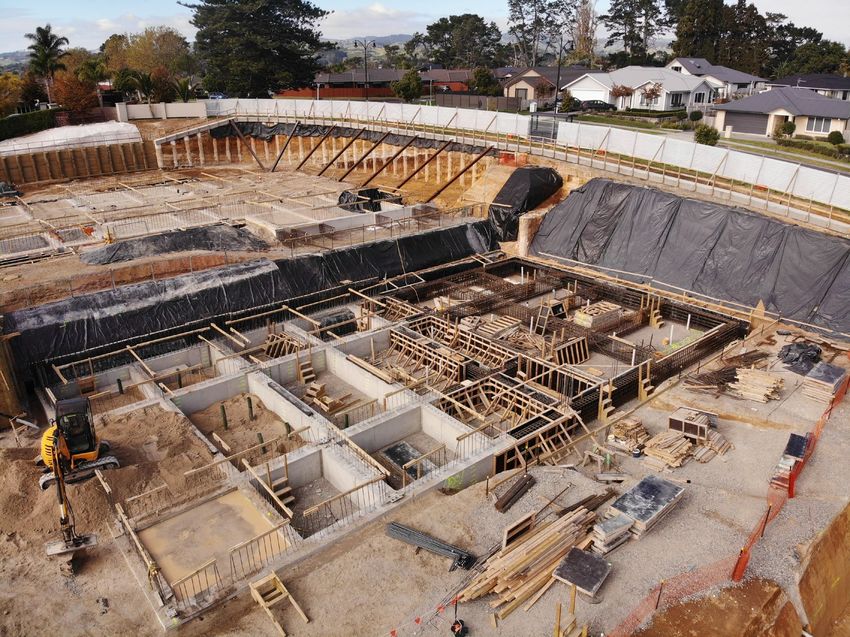
CONTINUED UNDERLYING GROWTH

Revenue ($m)                                                                                                       Underlying Profit1 ($m)

                                                                                      152.4                                                                                                       38.6
                                                             132.3                                                                                                              33.0

                                   101.4
                                                                                                                                                       23.1
          82.5
                                                                                                                              15.8

  FY        16                        17                       18                       19                           FY        16                        17                       18                19

Operating Cash Flow ($m)                                                                                          Total Assets ($m)

                                                                                                                                                                                                  1,300
                                                                                       69.1
                                                                                                                                                                                1,132
                                                             53.9
                                                                                                                                                       796
                                    39.7

          24.2                                                                                                                461

  FY        16                        17                       18                       19                           FY        16                       17                        18                19

1. Underlying Profit is a non-GAAP (unaudited) financial measure and differs from NZ IFRS net profit after tax. A reconciliation to Reported Net Profit after Tax is provided in the
financial section of this presentation and definition is appended.
                                                                                                                                                                                        FY19 RESULTS PRESENTATION
                                                                                                                                                                                                                3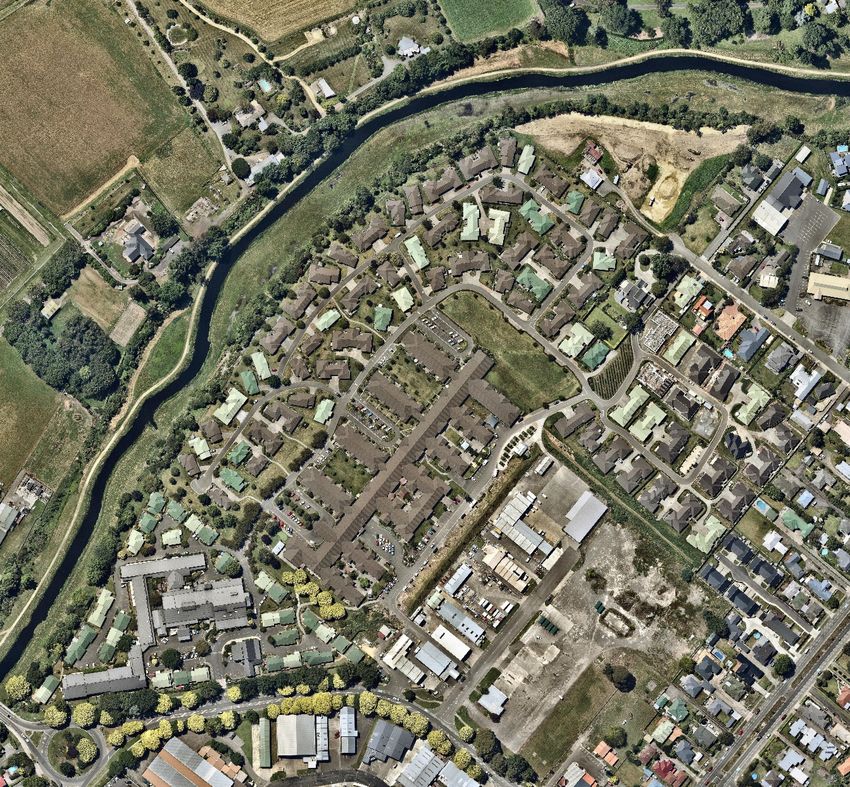
BUSINESS
OVERVIEW

           4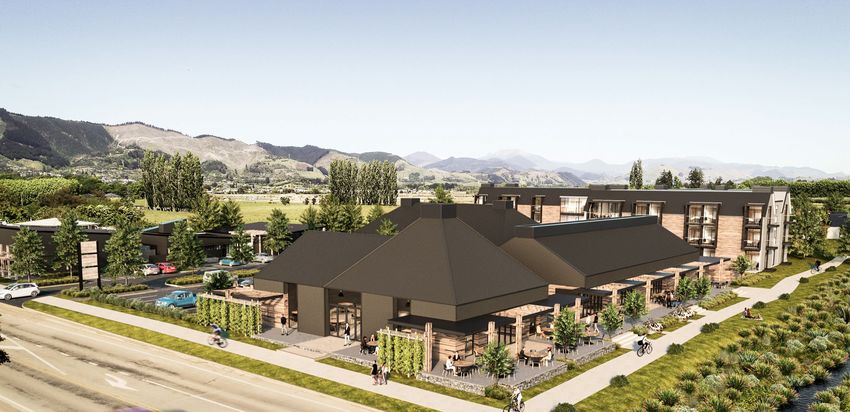
ARVIDA IS CARE FOCUSED

                                        CARE                              VILLAGE

                                         Assisted                  Assisted                 Independent
                                          Living                    Living
                                                                                                                      29 Villages
                                            Beds                  SAs/Care                     ILUs        Total
                                                                                                                      21 integrated villages
North Island                                 887                       308                     990         2,185      5 care facilities
                                                                                                                      3 retirement villages
South Island                                 835                        381                    276         1,492
                                                                                                                      2 Greenfield Sites
Total existing stock                        1,722                      689                    1,266        3,677

Brownfield                                    69                       292                     441          802

Greenfield                                     -                        155                    400          555

Development pipeline                          69                       447                     841         1,357

Decommissions                               (121)                       (9)                      -         (130)

Total built                                 1,670                      1,127                  2,107       4,904

                                        Standard                  Subject to                 Subject to     66%
                                          (govt                   ORA with                   ORA with      needs-
                                       funded) &                     DMF                        DMF        based                          Existing Village
                                           PAC                    structure;                 structure;    stock;
                                       (premium                      care                     villas &    target is                       Existing Village with Development Activity
                                         charge)                   services                 apartments     60%+
                                          beds                    delivered                                                               Future Village (greenfield site)

     1. Portfolio metrics include Village at the Park in which Arvida has a 50% interest.

                                                                                                                                                  FY19 RESULTS PRESENTATION
                                                                                                                                                                          5
OUR STATED STRATEGY

                      FY19 RESULTS PRESENTATION
                                              6
EXCELLENT OUTCOMES
                                                              Our Vision:
Annual NPS resident satisfaction survey                       To improve the lives and wellbeing of our residents
                                                              by transforming the ageing experience

                Same as                               +5      Introduced customer-led model of care called
                  FY18                              on FY18   ATTITUDE OF LIVING WELL that brought about
                                                              cultural change across organisation
    Care NPS                            Village NPS

    +51                                  +58
Inaugural staff engagement survey
                                                              Benefits measured:
>   96% determined to give best                                                                                        96%
>   83% motivated to go beyond                                >   Industry leading care occupancy, significantly      Occupancy
                                                                  above the sector
                                          Engagement
                                            index at          >   17 or 65% of care facilities now hold the gold

                                           78%                    standard 4-year certification from Ministry of
                                                                  Health; balance all 3-years
                                                                                                                       65%
                                                                                                                      4-year cert

                                                              >   Wellness Team invited to present at domestic and
                                                                  industry conferences

                                                              >   Industry recognition and accolades for
>   Approximately 4,000 residents and 2,500 staff                 programmes

                                                                                                     FY19 RESULTS PRESENTATION
                                                                                                                             7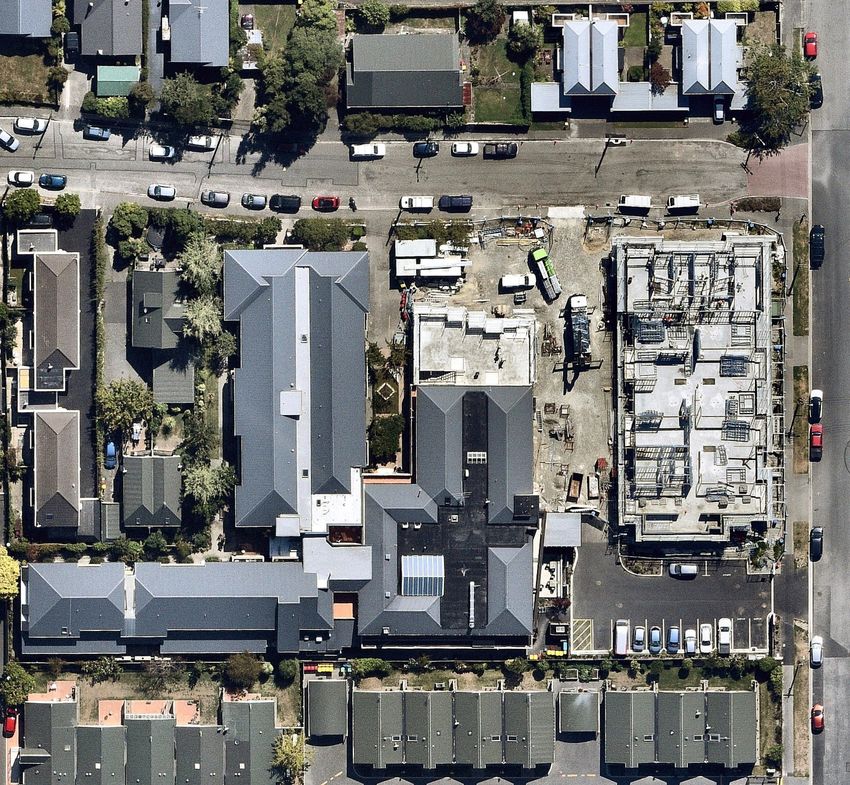
OPERATIONAL HIGHLIGHTS
Rollout of resident management system now implemented across all care facilities in the Group:
− We are now at the stage of assessing other modules within the system with a view to enhancing the functionality
and assisting staff to further increase their productivity
Over 26,000 training modules completed by staff through the Altura remote learning platform:
− There is an increasing trend for overall course completions
− Career development and talent programmes are a key area of focus
− During the year we updated and implemented comprehensive induction processes for all staff
No significant health and safety incidents during the period, with operational and development sites being well managed. A
total of six incidents were notified to Worksafe NZ. Two of these related to incidents that occurred at villages, however no
further action resulted from any of these notifications:
− Our Health and Safety Plan has ten goals to be completed before 30 June 2020
− Arvida aims for continual improvement in health & safety with a zero tolerance target for notifiable incidents in
operations
IT roadmap includes investment in enabling technology such as WiFi and connected services so that our villages and new
developments are future-proofed with key IT infrastructure
All FY18 acquisitions now fully integrated into Arvida systems, policies and operating model
FY19 RESULTS PRESENTATION
8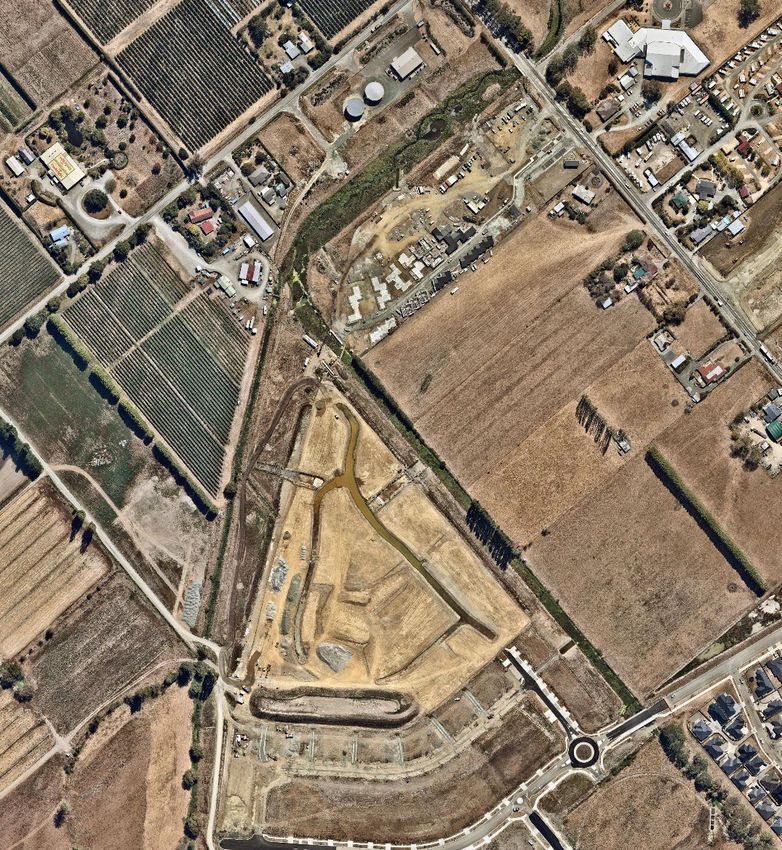
DEVELOPMENT

Waimea Plains
8 hectares in Richmond

                         Boundary line indicative only
FY19 NEW UNIT SALES & DELIVERY
Sales Analysis1 FY19 FY18 YoY change FY17 Commentary
New Sales Of the 70 units sales:
64 73 (12%) 16 − 41 were from units delivered in FY19
ILUs
− 24 related to units delivered prior to FY19
Serviced apartments 1 2 (50%) 16
− 5 were care suite conversions
Care suites 5 4 25% -
Despite lower sales volumes, gross proceeds up 6%
Total new units sold 70 79 (11%) 32 Average values per new sale settlement grew to
44.3 41.7 6% 14.0 $633k, a 20% increase on last year
Value $m
113 new units delivered across 5 villages, in line with
Av. value per new sale $000 633 528 20% 439
guidance provided November 2018 that 112 new
Development gain $m 7.5 6.5 15% 2.4 units expected to be delivered
Development margin % 18% 19% (100bp) 17% Of the 113 new units delivered in FY19, 42 were
delivered in the last quarter
New Units and Beds delivery FY19 Unit Delivery Units Av. $000
200+ Copper Crest 27 772
Mary Doyle 14 782
170 Aria Bay 25 956
Park Lane 29 595
113
97 Rhodes on Cashmere 18 947
FY19 New Units 113 796
FY19 Sales $000 ILUs SAs Suites
FY 18 19 20e 21e Av. Sales Value 674 230 183
1. The figures above include Village at the Park , which is 50% owned by Arvida. The “Value $m” line includes 100% of the value and the “Development gain $m” line includes 50%
of gains. A table is appended that excludes Village at the Park from the above.
FY19 RESULTS PRESENTATION
10PROJECTS COMPLETED IN FY19
PARK LANE, CHRISTCHURCH COPPER CREST TAURANGA RHODES ON CASHMERE, CHRISTCHURCH
Apartments (only 26 able to be Final stage of villas Apartments delivered March 2019 (of
29 occupied until next stage complete)
17 contracted (of which 14 are settled)
27 14 contracted (of which 11 are settled)
18 which 2 are contracted)
Fitout of 5 Care Suites in next stage
2 to be built post care completion
ARIA BAY, AUCKLAND MARY DOYLE, HAVELOCK NORTH
Apartments Villas
25 12 contracted (of which 9 are settled)
14 12 contracted (of which 8 are settled)
FY19 RESULTS PRESENTATION
11KEY PROJECTS IN FY20
VILLAGE AT THE PARK, WELLINGTON WAIMEA PLAINS, RICHMOND
Construction progressing well Bulk earthworks on the 8 hectare site are now complete
Building envelope is nearing completion, with fitout in Construction of Stage 1 (26 villas plus 12 townhouses) is
24 progress and finishing trades well advanced
The apartment block is due for completion mid FY20
38 progressing well with completion expected late FY2020
In total, the development of the site will deliver 160 villas, 40
Apts Villas
delivering 24 apartments apartments, 75 care suites
Contracts are held for 23 apartments Contracts held for 10 out of the 38 units in the first stage
FY19 RESULTS PRESENTATION
12KEY PROJECTS IN FY20
ST ALBANS, CHRISTCHURCH LAURISTON PARK, CAMBRIDGE
Extension of the village is progressing well with floors Construction is progressing well and is on track for
complete and framing advancing completion later this year
25 The extension delivers 25 apartments
Delivery is expected late FY20, with sales launch mid-year
12 Framing is largely complete, windows and cladding are
ongoing and roofing on
Apts Villas
New care wing is proposed for the next development stage The stage delivers 12 apartment-style villas with contracts
held for all 12 villas
FY19 RESULTS PRESENTATION
13KEY PROJECTS IN FY20
PARK LANE, CHRISTCHURCH MARY DOYLE, HAVELOCK NORTH
Construction continues to progress at pace and is ahead of Bulk earthworks are complete
schedule, with delivery now expected late FY20 This stage delivers 18 villas of which 9 are scheduled for
49 This stage completes the apartment development
Planning is underway for the common facilities/wellness
12 delivery in FY20 and the remaining 3 from the prior stage
Apts Villas
centre which is scheduled to commence construction 2H20
FY19 RESULTS PRESENTATION
14WAIMEA PLAINS RETIREMENT COMMUNITY
Artist impression. Subject to final investment decision approval.
WAIMEA PLAINS, RICHMOND
Waimea Plains will be developed in stages over the next 5-6 years. A launch event was recently held to unveil the village to the local community.
This received an outstanding reception with several hundred people visiting the village over the course of the weekend. There was plenty of interest
275 in our outwardly facing community concept, which is a key offering incorporated in all our new villages. It forms part of the village and helps make
Units that connection to the community by creating a neighbourhood that includes a range of hospitality, health and recreational facilities. Contracts are
already held for 10 of the 38 villas available in the first stage
FY19 RESULTS PRESENTATION
15COPPER CREST CARE FACILITY
Artist impression.
COPPER CREST, TAURANGA
With completion of the villa programme, construction of the care facility commenced and is progressing well with in-ground works largely complete
84 The in-house construction management team successfully established last year provides a blueprint for expansion of in-house construction functions to
Care/ other developments, providing greater oversight and potential for enhanced margins
Apts In total, the development will include 29 serviced apartments and 55 care suites. Delivery is expected late FY21
FY19 RESULTS PRESENTATION
16LAURISTON PARK CARE FACILITY
Artist impression. Subject to final investment decision approval.
LAURISTON PARK, CAMBRIDGE
Design for a care suite and serviced apartment facility to be developed on bare land within the existing village
90 Resource consent lodged
Care/
Apts
FY19 RESULTS PRESENTATION
17KERIKERI GREENFIELD SITE
Boundary line indicative only.
HALL RD, KERIKERI
In August 2018, we announced 18 hectares of land in Kerikeri had been acquired. Kerikeri is a thriving rural township that is experiencing rapid
280 population growth particularly in the 65+ aged bracket.
On completion the village will comprise 200 homes and 80 care beds (up to dementia level care). The planned care facility will be a welcome
Units
addition to the current limited care capacity in the region. Consent for development of the first 28 villas and enabling works have been lodged.
FY19 RESULTS PRESENTATION
18CURRENT DEVELOPMENT PROGRAMME
Projected delivery of 170 new units in FY20, lifting to 200+ from FY21
Village Location Status FY20 FY21+ (In Progress)
Aria Bay Auckland Under construction; delivery from FY22 - 117 ILUs/Care (37 decoms)
Lauriston Park Cambridge Under construction; completion 1H20 12 ILUs -
Lauriston Park Cambridge Construction to commence 1H20 (consenting) - 90 ILUs/Care
Copper Crest Tauranga Under construction; completion FY21 - 84 ILUs/Care
Glenbrae Rotorua Under construction 10 SAs 12 ILUs
Mary Doyle Havelock North Construction to commence 1H20 (consented) 12 ILUs 9 ILUs
Village at the Park Wellington Under construction; completion 1H20 24 ILUs -
Waimea Plains Richmond Stage 1 under construction; next stage of 32 ILUs will follow 38 ILUs Multiple stages
St Albans Christchurch Under construction 25 ILUs 20 Care
Park Lane Christchurch Under construction; completion late FY20 49 ILUs -
Rhodes on Cashmere Christchurch Stage 2 to commence 1H20 and include fit out of 5 care suites - 40 ILUs, 5 Care
Total In Progress Development 170 units 377 units (37 decoms)
Development pipeline comprises a total of 1,357 units
Note, figures are gross units expected to be delivered (nil decommissions in current programme other than noted at Aria Bay). Care packages are delivered into some ILUs.
FY19 RESULTS PRESENTATION
19FY2019 FINANCIALS
CARE OPERATIONS
NZ$m FY19 FY18 YoY change Aged Care Strategy
Rest home fees 37.6 35.5 6%
1 Retain high needs-based portfolio composition
Dementia fees 14.8 11.5 29%
2 Excellence in care: Arvida’s Attitude of Living Well
Hospital fees 48.5 44.6 9%
Premium fees 4.5 - nm 3 Increase PAC rates on care beds
Other revenue 2.9 3.1 (6%)
Introduce premium care suite offering in key urban
4 areas
Care revenue 108.3 94.7 14%
Conversion of existing care beds and certification of
Serviced apartment fees 10.7 10.1 6% 5 serviced apartments
Total care revenue 119.0 104.8 14%
Care Facility Occupancy Care Facility Commentary
The Group considers integrated sites as one business
2,000 94% 94% 95% 96% 96% 100% unit, rather than segmented care and retirement
businesses
1,743 1,722 Dementia fees increased 29% with change in mix of
1,500 75%
beds from FY18 acquisitions
1,446
Premium fees at $4.5m; now separately accounted
1,000
1,246 50%
The five standalone care facility sites with a total of
944 435 beds (25% of beds) generated $7.6m of EBITDA
500 25% (2018: $6.8m).On an annualised basis, this equates to
$17.4k EBITDA per bed, which compares to $17.8k per
bed assumed by the valuers as at 31 March 2018 across
- 0% these sites.
15 16 17 18 19
We expect our integrated care facilities to deliver
Number of beds Occupancy average EBITDA in a range of $10,000-14,000 per bed
FY19 RESULTS PRESENTATION
21VILLAGE OPERATIONS
NZ$m FY19 FY18 YoY change Retirement Village Strategy
RV weekly fees 9.3 6.9 35% Invest in scale and quality adding value through
1 brownfield development
Deferred management fees 21.4 18.1 18%
Develop greenfield villages that offer a
2
Other revenue 2.1 1.7 24% continuum and cater for future residents’ needs
Operating revenue 32.8 26.7 23% Build a development pipeline to deliver
3 200+ units p.a
Realised gains on resales 19.5 13.3 47%
Engagement with communities to promote
4
Realised development margin 7.5 6.5 15% retention of active links
Total income 59.8 46.5 29% 5 Fair approach to contracts
Embedded Value1 ($000 per unit) Embedded Value Composition ($000 per unit)
Average Embedded Value ILUs SAs Total
150
130 Resale gains 99 42 78
117 78
62 DMF 85 47 72
63
62 67 Total embedded value 184 89 150
24 68 72 Total portfolio Embedded Value (EV) was up
20
54 $41m since 31 March 2018 to $263m
42 43
On a per share basis, EV represents 63 cents per
share, 17% increase on FY18
15 16 17 18 19
EV is an indicator of the potential future cash
DMF Resale Gains flows from realised resale gains and deferred
management fee receivables
1. Embedded Value (“EV”) per unit is an internal calculation based on the data in the independent valuation reports for all occupied units: Resale Gain EV is calculated by
reference to the current unit price less the ingoing unit price less any capital gain sharing; DMF EV is calculated by reference to the contractual amount owed at valuation date
FY19 RESULTS PRESENTATION
22ORA RESALES
Sales Analysis FY19 FY18 YoY change FY17 Commentary
Resales Resale of 258 units, 19% up on FY18
90 72 25% 47 Occupancy remains high, with around 40 units
Villas / apartments
available for resale or less than 2% of total portfolio
Serviced apartments 159 144 10% 119 Gross proceeds of $87.1m, with average value per
Care suites 9 - nm - resale up 9% to $338k
Realised $19.5m of resale gains and an
Total resales 258 216 19% 166
improvement in resale margins to 23%
Value $m 87.1 67.0 30% 45.5 Resales price achieved was 7% above the unit
pricing assumed in 31 March 2018 independent
Av. value per resale $000 338 310 9% 274
valuations
Resale gains $m 19.5 13.3 47% 8.9 DMF realised on resales was $13.1m
Resale margin % 23% 20% 300bp 19%
Resale Volumes and Margins Average Resale Prices ($000)
200 23% 25% 500
20%
19% 477
20% 400 454
150
159
14% 144 15% 300 358
336
100 114 119
10% 264 248
90 200 241 238
223
50 72
5% 100
47 9
35
0 0% 0
FY 16 17 18 19 FY 16 17 18 19
ILUs SAs CS Margin ILUs SAs CS
Note, the figures above include Village at the Park. A table is appended that excludes Village at the Park from the above.
FY19 RESULTS PRESENTATION
23REPORTED PROFIT (IFRS)
NZ$m FY19 FY18 YoY change FY17 Commentary
Care & village service fees 125.6 109.9 14% 72.4 Revenue grew 15% to $152.4m on
continuing strong core financial
Deferred management fees 21.4 18.1 18% 7.8
performance and FY18 acquisitions
Other revenue 5.4 4.3 27% 2.3 Care fee revenue up 14% to $108.2m
underpinned by high care occupancy
Total revenue 152.4 132.3 15% 82.5
DMF up 18% which included full year
Changes in fair values 46.4 42.0 10% 16.0 contributions from FY18 acquisitions
Share of profit arising from JV (net of tax) 3.4 5.1 (34%) 0.0 Strong fair value increases reflect the
delivery of new units and the increase in
Total income 202.2 179.4 13% 98.5
existing unit pricing during the year
Operating expenses (129.9) (108.8) 19% (65.1) Operating expenses increased 19% due
to the acquired villages, higher nursing
Depreciation (5.0) (4.3) 19% (2.9)
costs, inbuilt increases in care giver
Total expenses (134.9) (113.0) 19% (68.0) rates, higher minimum wages,
increasing insurance costs and higher
Operating profit 67.3 66.4 1% 30.5
resident capital gain sharing payments
Financing costs (3.6) (2.3) 60% (0.9) Income tax expense is benefiting from a
higher tax shield
Impairment of goodwill (1.5) (1.2) 25% 0.0
One-off items (0.3) (1.0) (72%) (1.4) Head Office Costs FY19 FY18
Profit before income tax 61.9 61.9 (0%) 28.2 Employee costs 6.2 5.3
Income taxation (2.8) (4.3) (35%) (4.1) Other 3.1 2.9
Net profit after tax 59.1 57.6 2% 24.0 Total expense 9.3 8.2
Capitalised wages 1.6 0.7
FY19 RESULTS PRESENTATION
24UNDERLYING PROFIT RECONCILIATION
NZ$m (Unaudited) FY19 FY18 YoY change FY17 Commentary
Net profit after tax 59.1 57.6 2% 24.0 Underlying Profit increased 17% to
$38.6m
Less: Change in fair values (49.1) (47.0) 4% (16.0)
On a cents per share basis, the
Add: Deferred tax (0.2) 0.3 (161%) (0.1) increase in Underlying Profit was 5%,
representing a CAGR of 16% over the
Add: Impairment of goodwill 1.5 1.2 25% 0.9
last 4 years
Add: One-off costs 0.3 1.0 (72%) 1.4 The key drivers were:
Underlying operating profit 11.6 13.2 (12%) 10.2 − The acquisition of new villages in
the prior years strongly
Add: Gains on resales 19.5 13.3 47% 5.0 contributed to the underlying
7.5 6.5 15% 1.5 profit; and
Add: Gain on sale of new units
− 328 sales (up 11% on FY18) and
Underlying profit1 38.6 33.0 17% 16.7 higher resale margins drove
1. Underlying Profit is a non-GAAP unaudited financial measure and differs from NZ IFRS net profit after tax. A definition is increase in total gains
appended.
Movements in Underlying Profit NZ$m Underlying Profit (cents per share)
6.2 +5%
+16%
(2.4) 1.8 38.6 9.3
+27% 8.9
33.0
7.7
6.1
FY18 Underlying Corporate & Interest Existing portfolio FY18 Acquisitions FY19 Underlying FY 16 17 18 19
Profit Profit
FY19 RESULTS PRESENTATION
25BALANCE SHEET
NZ$m FY19 FY18 Commentary
Cash and cash equivalents 4.6 3.1 Total asset base now $1.3b, with
over $1.0b of investment property
Property, plant and equipment 168.7 169.1
Valuations of retirement villages
Investment property 1,021.6 862.6 completed by CBRE and JLL:
Investment in JV 24.3 21.2 − A comparison of the assumptions
used is contained within the
Intangibles 54.0 55.7 appendix
Other assets 26.4 20.8 − There were no material changes
to the valuers assumptions
Total assets 1,299.6 1,132.5
The value of Investment Property
External debt 190.1 122.2 increased $159m (vs FY18) as a
result of:
Residents’ loans 466.1 415.2
− $69m of development activity
Deferred tax liability 27.7 30.6 − $49m of fair value increases
Other liabilities 66.0 54.0 − $27m of land acquisitions
Total liabilities 749.9 622.0
Net assets 549.7 510.5
Movements in Investment Property (NZ$m)
49 1,022
27
69
863 14
FY18 Capex Development Land Existing village FY19
spend acquisitions revaluations
FY19 RESULTS PRESENTATION
26CAPITAL STRUCTURE
NZ$m FY19 FY18 YoY change FY17 Commentary
Investment property 1,022 863 18% 590 Total net debt of $186m includes development
project work in progress of $48m, development
Less: ORA / DMF (490) (436) 12% (306)
land of $53m and inventory of $62m
Retirement villages 532 427 25% 284 An extension to the bank debt facility limit and
tenure was implemented in June 2018 with BNZ
Add: Care facilities 201 201 0% 178
introduced to the syndicate alongside ANZ (as
Independent valuation 733 628 17% 463 the lead bank & agent)
24 21 14% 0 The facility of $250m is split evenly between two
Add: Investment in JV
tranches with expiry dates of June 2021 and June
Implied value 757 649 17% 463 2023. Currently in discussions with our banking
(186) (119) 56% (72) syndicate to provide a further tranche of debt
Less: Net debt
capacity
Net implied value 571 530 8% 391
Interest rate hedges at balance date equated to
Net implied value per share $1.38 $1.28 8% $1.17 34% of drawn debt. Hedges have a weighted average
maturity of 3.4 years and a fixed rate of 2.8%
Bank Debt Facilities Bank Covenants
NZ$m FY19 FY18 YoY change FY17 Actual Covenant
Debt per accounts 190.1 122.2 56% 73.5 Interest cover 4.2x 2.25x
Plus: Capitalised costs 0.4 0.3 33% 0.0 Loan to value 28.3% 50%
Drawn debt 190.5 122.5 56% 73.5
Less: Cash 4.6 3.1 48% 1.3
Total Net Debt 185.9 119.4 56% 72.2
Gearing (ND / ND + E) 25% 19% 600bp 16.%
FY19 RESULTS PRESENTATION
27CASH FLOWS
NZ$m FY19 FY18 YoY change FY17 Capital Expenditure
Receipts from residents for care fees and
130.9 113.1 16% 90.3 NZ$m FY19
village services
Residents’ loans from resales 76.3 63.3 21% 53.2 Acquisitions 27.4
Residents’ loans from new sales 39.6 27.9 42% 9.2 Purchase of furniture & fittings 3.4
Development capital expenditure 68.6
Repayment of residents’ loans (46.3) (37.7) 23% (26.0)
ILU refurbishment 3.5
Payments to suppliers and employees (124.3) (106.3) 17% (76.8)
SA unit refurbishment 2.1
Other operating cash flows 0.0 0.0 nm (3.3)
Care facility refurbishment 0.4
Financing costs (net) (3.3) (1.8) 83% (1.1) General building works 2.9
Taxation (3.8) (4.6) (17%) (5.8) EQ Remedial Works 1.0
Net cash flow from operating activities 69.1 53.9 28% 39.7 Care suite upgrades 0.1
Bank overdraft acquired from subsidiaries 0.0 3.0 (100%) (0.2) Unit title buybacks 4.3
Adjustment for accruals (0.7)
Purchase of investment property (105.5) (68.4) 54% (19.2)
Total capital expenditure 113.0
Purchase of property, plant and equipment (4.3) (9.9) (57%) (23.3)
Payments for investments in subsidiaries 0.0 (43.8) (100%) (66.5)
Is represented by:
Net advances to joint venture 0.0 (11.9) (100%) 0.0 Purchase of PPE 4.3
Net insurance claim proceeds 0.0 0.0 0.0 0.9 Purchase of investment property 105.5
Capitalised interest paid (3.2) (1.9) 68% 0.3 Capitalised interest 3.2
Net cash from investing activities 113.0
Net cash flow from investing activities (113.0) (132.9) (15%) 108.6
Net cash flow from financing activities 45.3 80.9 (44%) 68.3
FY19 RESULTS PRESENTATION
28DIVIDEND AND OUTLOOK
Commentary Dividend (cents per share)
4Q dividend for FY19 of 1.45 cps declared:
5.35
− Brings total dividend for FY19 to 5.35 cps, 7% up on 5.01
the corresponding prior period 4.45
Record date for entitlement is 12 June 2019, payment on 20 4.25
4.12
June 2019:
− Ordinary dividend partially imputed with 0.10 cps of
imputation credits and supplementary dividend of
0.045 cps payable for non-resident shareholders
Current quarterly dividend is expected to be sustainable
1
for FY20 FY 15 16 17 18 19 20e
The business is continuing to perform well, with a growing Ordinary dividend Special dividend
base of recurring earnings underpinning performance
Sector Challenges Business Outlook
Labour supply, particularly in relation to nurses. The recent The increasing build rate from development activities will
announcement of the addition of nurses to the long-term skills deliver future growth in earnings and shareholder value. With
shortage is a welcome development a large development pipeline in place and a proven
Cost pressures in relation to wages and insurance. We are active development capability, we are confident with our ability to
with industry bodies to ensure funding levels fairly compensate deliver an increasing number of units
increased wage costs Benefits of the Attitude of Living Well care model are now
Softened residential housing market, particularly in Auckland becoming embedded and will result in maintaining our high
and Christchurch. We continue to monitor the impacts on the level of care occupancy and ability to charge premium rates.
construction market and land prices Strong net promoter scores show the delivery of care can be
a real point of difference
The increase in new units provides the platform for the sales
team to deliver earnings growth through an increasing
development margin contribution to underlying profit
1. Annualised. Arvida paid a dividend of 1.03 cps in respect of the FY15
FY19 RESULTS PRESENTATION
29APPENDIX Stairwell at Park Lane, Christchurch
PORTFOLIO AT 31 MARCH 2019

         Village                                         Region               Villas       Apts        SA          CS         RH         H     D       FY20      FY21     FY22+^
1      Kerikeri site                                   Kerikeri                  -          -           -           -           -         -     -        -        30       250
2      Aria Bay                                        Auckland                  -          34          17          -          37         -     -        -         -      117(37)
3      Aria Gardens                                    Auckland                  -          -           -           -          42        91    20        -         -         -
4      Aria Park                                       Auckland                  -          -          46           -          40        44     -        -         -      95(93)
5      Cascades                                        Hamilton                  -          5          32           -          45        32     -        -         -        90
6      Lauriston Park                                  Cambridge                171         -           -           -           -         -     -        12        -        90
7      Views                                           Tauranga                  -          -           -           -          30        38    20        -         -         -
8      Copper Crest                                    Tauranga                 156         -           -           -           -         -     -        -        84        2
9      Glenbrae                                        Rotorua                  78          -          26           -          17        21     -        10        8        4
10     Mary Doyle                                      Havelock North           158         48         38           8          26        60    64        12        9         -
11     Olive Tree                                      Palmerston North         95          -          48           -          28         -    17        -         -         -
12     Molly Ryan                                      New Plymouth             35          -          28           -          20        13     -        -         -         -
13     Waikanae Country Lodge                          Kapiti                    4          -          20           -          21        36     -        -         -         -
14     Lansdowne Park                                  Masterton                69          -          28           -          29        21     -        -         -         -
15     Village at the Park                             Wellington               38          99          -          17                    42    33       24        10        6
16     Ashwood Park                                    Blenheim                 18          -          36           -          47        48    26        -         -         -
17     The Wood                                        Nelson                    5          -          37           -          30        46     -        -         -         -
18     Oakwoods                                        Nelson                   116         -          45           -          26        22     -        -         -        30
19     Waimea Plains                                   Tasman                    -          -           -           -           -         -     -       38        32       205
20     Bainlea House                                   Rangiora                  -          -           -           -           -         -    27        -         -         -
21     Bainswood on Victoria                           Rangiora                  -          -           -           -          26        32     -        -         -         -
22     Bainswood                                       Rangiora                  4          -           14          -          26         -     -        -         -         -
23     Wendover                                        Christchurch              -          -           11          -          43         -     -        -         -        60
24     St Albans                                       Christchurch              -          -          53           -           -        18     -       25        20         -
25     Ilam                                            Christchurch              -          -          45           -          22        34    20        -         -         -
26     Mayfair                                         Christchurch              11         -          23           -          27        36     -        -         -         -
27     Maples                                          Christchurch              -          -          25           -          49         3     -        -         -         -
28     St Allisa                                       Christchurch              -          -           -           -          55        34    20        -         -         -
29     Park Lane                                       Christchurch              8          29         45           -          26        16     -       49         -         -
30     Rhodes on Cashmere                              Christchurch              -          34          -           -           -         -     -        -        45         -
31     Strathallan                                     Timaru                   51          -          47           -          10        46    20        -         -         -
         TOTALS                                                                1,017       249        664          25         722        733   267      170       238      949

     ^ Gross units expected to be delivered (expected decommissions shown in brackets). Subject to final investment decision approval.
     # Arvida has a 50% interest in Village at the Park.
                                                                                                                                                     FY19 RESULTS PRESENTATION
                                                                                                                                                                             31
RV VALUATION SUMMARY 31 MARCH 2019
$000
Fair Value Discount Embedded
Village Region Valuer RV Valuation Movement Rate Value
Aria Bay Auckland CBRE 34,350 3,245 14.50% 7,110
Aria Gardens Auckland - - - - -
Aria Park Auckland JLL 18,650 1,625 13.50% 10,003
Cascades Hamilton CBRE 14,950 600 14.25% 6,085
Lauriston Park Cambridge JLL 46,100 2,585 13.50% 39,502
Views Lifecare Tauranga - - - - -
Copper Crest Tauranga CBRE 56,500 11,921 14.00% 34,140
Glenbrae Rotorua CBRE 15,000 1,177 16.00% 11,969
Mary Doyle Havelock North CBRE 62,485 15,851 15.00% 45,569
Olive Tree Palmerston North CBRE 11,610 (687) 15.50% 10,661
Molly Ryan New Plymouth JLL 9,630 1,493 15.50% 6,162
Waikanae Country Lodge Kapiti CBRE 3,100 305 16.00% 1,292
Lansdowne Park Masterton JLL 20,760 2,202 13.75% 13,441
Ashwood Park Blenheim JLL 8,470 342 13.75% 3,240
The Wood Nelson CBRE 8,400 (294) 13.50% 3,024
Oakwoods Nelson JLL 35,925 2,252 13.25% 21,362
Bainlea House Rangiora - - - - -
Bainswood on Victoria Rangiora - - - - -
Bainswood Rangiora CBRE 1,700 (40) 15.50% 710
Wendover Christchurch CBRE 2,500 (170) 16.50% 658
St Albans Christchurch CBRE 14,900 (670) 14.50% 3,255
Ilam Christchurch JLL 10,725 170 12.25% 3,588
Mayfair Christchurch JLL 6,370 247 14.50% 5,676
Maples Christchurch JLL 4,280 (429) 15.50% 2,159
St Allisa Christchurch - - - - -
Park Lane Christchurch CBRE 24,750 1,114 14.50% 5,394
Rhodes on Cashmere Christchurch CBRE 25,150 2,233 15.00% 4,370
Strathallan Timaru JLL 16,120 3,104 15.00% 11,986
Total for developed villages 456,915 48,175 251,356
Waimea Plains Richmond CBRE 12,400 502 n.a n.a
Kerikeri Site Kerikeri CBRE 14,375 9 n.a n.a
Total for consolidated villages 483,690 48,686 251,356
Joint Venture:
Village at the Park # Wellington CBRE 46,100 5,308 14.50% 22,951
# Arvida has a 50% interest in Village at the Park.
FY19 RESULTS PRESENTATION
32VALUATION INPUTS FOR ILUs
$000 Ave. Ave. Valuer Growth Rate Assumptions Ave.
No. Ingoing Current Resident
Village of Units Price Price Yr 1 Yr 2 Yr 3 Yr 4 Yr 5+ Age Tenure
Aria Bay 34 879 925 0.00% 1.00% 2.00% 3.00% 3.50% 79.5 8.1
Aria Gardens - - - - - - - - - -
Aria Park - - - - - - - - - -
Cascades 5 472 619 0.00% 0.00% 1.00% 2.00% 3.50% 83.9 8.0
Lauriston Park 171 416 569 1.00% 1.25% 2.00% 2.75% 3.50% 79.2 8.8
Views - - - - - - - - - -
Copper Crest 156 538 701 0.00% 1.00% 2.00% 2.50% 3.50% 77.3 9.0
Glenbrae 78 270 389 0.50% 1.00% 1.50% 2.50% 3.00% 85.5 7.7
Mary Doyle 206 404 563 0.00% 1.00% 2.00% 2.50% 3.50% 83.4 8.3
Olive Tree 95 375 424 0.00% 0.50% 0.50% 2.00% 3.00% 81.8 8.4
Molly Ryan 35 336 423 1.00% 1.50% 2.00% 2.75% 3.30% 86.6 6.8
Waikanae Country Lodge 4 410 464 0.00% 1.00% 1.50% 2.00% 3.00% 82.4 8.2
Lansdowne Park 69 413 521 1.00% 1.50% 2.00% 2.75% 3.30% 81.5 8.0
Ashwood Park 18 298 336 1.00% 1.50% 2.00% 2.75% 3.30% 85.0 6.3
The Wood 5 437 516 0.50% 1.00% 2.00% 3.00% 3.50% 86.3 6.2
Oakwoods 116 385 479 1.00% 1.25% 2.00% 2.75% 3.50% 81.2 7.8
Bainlea House - - - - - - - - - -
Bainswood on Victoria - - - - - - - - - -
Bainswood 4 253 261 0.00% 1.00% 2.00% 2.50% 3.00% 85.6 6.9
Wendover - - - - - - - - - -
St Albans - - - - - - - - - -
Ilam - - - - - - - - - -
Mayfair 11 375 429 0.50% 1.00% 1.75% 2.50% 3.50% 83.6 6.5
Maples - - - - - - - - - -
St Allisa - - - - - - - - - -
Park Lane 37 580 589 0.00% 1.00% 2.00% 3.00% 3.50% 80.6 7.5
Rhodes on Cashmere 34 505 818 0.50% 1.00% 1.50% 3.00% 3.50% 84.2 8.2
Strathallan 51 373 463 0.50% 1.00% 2.00% 2.50% 3.30% 83.5 8.0
Waimea Plains n.a. n.a. n.a. n.a. n.a. n.a. n.a. n.a. n.a. n.a.
Kerikeri Site n.a. n.a. n.a. n.a. n.a. n.a. n.a. n.a. n.a. n.a.
Village at the Park # 137 436 534 0.5% 1.5% 2.0% 2.5% 3.5% 81.8 7.5
# Arvida has a 50% interest in Village at the Park.
FY19 RESULTS PRESENTATION
33VALUATION INPUTS FOR SAs/CARE SUITES
$000 Ave. Ave. Valuer Growth Rate Assumptions Ave.
No. Ingoing Current Resident
Village of SAs Price Price Yr 1 Yr 2 Yr 3 Yr 4 Yr 5+ Age Tenure
Aria Bay 17 395 555 0.00% 1.00% 2.00% 3.00% 3.50% 90.6 4.4
Aria Gardens - - - - - - - - - -
Aria Park 46 453 561 1.00% 1.00% 1.50% 2.50% 3.50% 85.0 4.8
Cascades 32 309 389 0.00% 0.00% 1.00% 2.00% 3.50% 84.8 4.6
Lauriston Park - - - - - - - - - -
Views - - - - - - - - - -
Copper Crest - - - - - - - - - -
Glenbrae 26 193 231 0.00% 0.00% 1.00% 2.50% 3.00% 87.9 4.3
Mary Doyle 46 166 213 0.00% 1.00% 2.00% 2.50% 3.00% 87.2 4.5
Olive Tree 48 194 205 0.00% 0.50% 0.50% 2.00% 2.50% 88.6 4.3
Molly Ryan 28 196 218 1.00% 1.50% 2.00% 2.75% 3.30% 89.1 4.3
Waikanae Country Lodge 20 220 258 0.00% 1.00% 1.50% 2.00% 2.50% 84.7 5.0
Lansdowne Park 28 236 278 1.00% 1.50% 2.00% 2.75% 3.30% 86.9 4.8
Ashwood Park 36 192 203 1.00% 1.50% 2.00% 2.75% 3.30% 87.2 4.0
The Wood 37 207 227 0.50% 1.00% 2.00% 3.00% 3.50% 86.7 4.1
Oakwoods 45 238 260 1.00% 1.25% 2.00% 2.75% 3.50% 86.8 4.2
Bainlea House - - - - - - - - - -
Bainswood on Victoria - - - - - - - - - -
Bainswood 14 144 154 0.50% 1.00% 2.00% 2.00% 2.50% 88.8 4.3
Wendover 11 192 210 0.50% 1.00% 2.00% 3.00% 3.00% 88.9 4.3
St Albans 53 222 274 0.50% 1.00% 2.00% 3.00% 3.50% 88.3 4.4
Ilam 45 257 288 0.50% 1.00% 1.75% 2.50% 3.50% 87.1 3.9
Mayfair 23 240 274 0.50% 1.00% 1.75% 2.50% 3.50% 87.9 4.0
Maples 25 204 245 0.50% 1.00% 1.75% 2.50% 3.50% 88.8 4.2
St Allisa - - - - - - - - - -
Park Lane 45 241 265 0.50% 1.00% 1.50% 2.50% 3.00% 86.4 4.6
Rhodes on Cashmere - - - - - - - - - -
Strathallan 47 246 282 0.50% 1.00% 2.00% 2.50% 3.30% 85.7 4.0
Waimea Plains n.a. n.a. n.a. n.a. n.a. n.a. n.a. n.a. n.a. n.a.
Kerikeri Site n.a. n.a. n.a. n.a. n.a. n.a. n.a. n.a. n.a. n.a.
Village at the Park # 17- 240 254 0.50% 1.50% 2.00% 2.50% 3.00% 82.4 4.4
# Portfolio metrics presented as if a 100% interest held. Arvida has a 50% interest in Village at the Park.
FY19 RESULTS PRESENTATION
34ADDITIONAL DISCLOSURE
Sales Analysis excluding Village At The Park
FY19 Resales New Sales
Units $000 Units $000
Villas / apartments 84 39,624 61 41,964
Serviced apartments 151 38,615 1 230
Care suites 3 565 1 175
Total Sales 238 78,804 63 42,369
Value $m 78.8 42.4
Av. value per sale $000 331 673
Gains $m 18.7 7.3
Margin % 24% 17%
FY19 RESULTS PRESENTATION
35DEFINITIONS
Underlying Profit (or Underlying NPAT)
Underlying Profit is a non-GAAP unaudited financial measure used by Arvida to monitor financial performance and determine dividend distributions.
Arvida calculates Underlying Profit by making the following adjustments to Reported Net Profit after Tax:
Removing the change in fair value of investment properties, property, plant and equipment and derivatives (from the Statement of Comprehensive
Income);
Removing any impairment of goodwill;
Removing any loss on disposal of chattels from the decommissioning of development sites;
Removing any gains on acquisition of subsidiaries;
Adding back the Directors’ estimate of realised gains on occupation right agreement units;
Adding back the Directors’ estimate of realised development margin on the cash settlement of the first sale of new ORA units following the development
or conversion to an ORA unit;
Adding back the deferred taxation component of taxation expense so that only current tax expense is reflected; and
Adding back transaction costs.
Resale Gain
The Directors’ estimate of realised gains on resales of ORA is calculated as the net cash flow received by Arvida on the settlement of the resale of pre-existing
ORAs (i.e. the difference between the ORA licence payment received from the incoming resident and the ORA licence payment previously received from the
outgoing resident).
Development Margin
The Directors’ estimate of realised development margin is calculated as the cash received on settlement of the first sale of new ORA units less the development
costs associated with developing the ORA units.
Development costs include:
Construction costs directly attributable to the relevant project, including any required infrastructure (e.g. roading) and amenities related to the units (e.g.
landscaping) as well as any demolition and site preparation costs associated with the project. The costs are apportioned between the ORA units, in
aggregate, using estimates provided by the project quantity surveyor. The construction costs for the individual ORA units sold are determined on a pro-
rated basis using gross floor areas of the ORA units;
An apportionment of land valued based on the gross floor area of the ORA units and care suites developed. The value for brownfield development land is
the acquisition cost or the estimated fair value of land at the time a change of use occurred (from operating as a care facility or retirement village to a
development site), as assessed by an external independent valuer. Greenfield development land is valued at historical cost; and
Capitalised interest costs to the date of project completion apportioned using the gross floor area of ORA units developed.
Development costs do not include:
Construction, land (apportioned on a gross floor area basis) and interest costs associated with common areas and amenities or any operational or
administrative areas.
FY19 RESULTS PRESENTATION
36IMPORTANT NOTICE
Disclaimer
The information in this presentation has been prepared by Arvida Group Limited with due care and attention. However, neither the Company nor any of its
directors, employees, shareholders nor any other person shall have any liability whatsoever to any person for any loss (including, without limitation, arising from
any fault or negligence) arising from this presentation or any information supplied in connection with it.
This presentation may contain projections or forward-looking statements regarding a variety of items. Such projections or forward-looking statements are
based on current expectations, estimates and assumptions and are subject to a number of risks, uncertainties and assumptions. There is no assurance that
results contemplated in any projections and forward-looking statements in this presentation will be realised. Actual results may differ materially from those
projected in this presentation. No person is under any obligation to update this presentation at any time after its release to you or to provide you with further
information about Arvida Group Limited.
A number of non-GAAP financial measures are used in this presentation. You should not consider any of these in isolation from, or as a substitute for, the
information provided in the audited consolidated financial statements for the twelve months ended 31 March 2019, which will be made available at
www.arvida.co.nz.
Forward-looking statements are subject to any material adverse events, significant one-off expenses or other unforeseeable circumstances.
The information in this presentation is of a general nature and does not constitute financial product advice, investment advice or any recommendation. Nothing
in this presentation constitutes legal, financial, tax or other advice.
FY19 RESULTS PRESENTATION
37You can also read