Multi-year Outlook February 2018
←
→
Page content transcription
If your browser does not render page correctly, please read the page content below
www.nblenergy.com   NYSE: NBL

Multi-year Outlook
February 2018

www.nblenergy.com   NYSE: NBL

                   Strategy to Enhance Value
                   Blueprint to delivering leading total shareholder returns

Peer-leading Cash Flow Per Debt-adjusted Share Growth
........................................................................................

Relentless Focus on Capital Efficiency and Corporate Returns
........................................................................................

Incentive Plans Aligned with Shareholders
........................................................................................

Financial Strength – Low Leverage and High Flexibility
........................................................................................

Committed to Stakeholders and the Environment
                                                                                                                      2
NBL Strategy                                                                                                                                                                                 www.nblenergy.com                    NYSE: NBL

Assets. Execution. Results.
                                           Maintain Top Tier, High-quality Portfolio of Investment Options
        Delivering Value to Shareholders   • Actively manage portfolio to capture full value
                                           • Diversification of play type and geography for investment flexibility
                                           • High-impact exploration portfolio with low capital commitment
                                           ..................................................................................................

     • Peer-leading Debt-adjusted Per      Deliver Industry-leading Development of U.S. Onshore Assets (USO)
       Share Growth                        • Double-digit annual USO growth from multiple oil basins
                                           • Superior performance relative to peers
     • Double-digit Corporate Returns      • Enhanced value through midstream integration
       from High-margin Assets             ..................................................................................................

                                           Maximize Value From World-class EMed Assets
     • Reduce Outstanding Shares           • Doubling EMed volumes and cash flows by 2020
       Through Repurchase Program          • Fully funded Leviathan and generating asset-level free cash flow(1)
                                           • Visibility for capital efficient expansion
     • Dividend Growth with Cash Flow      . . . . . . . . . . . . . . . . . . . . . . . . . . . . . . . . . . . . . . . . . . . . . . . . . . . . . . . . . . . . . . . . . . . . . . . . . . . . . . . . . . . . . . . . . . . . . . . . . ..

     • Compensation Plans Aligned          Ensure Robust Financial Capacity
       with Shareholders                   • Disciplined capital investment to high-margin, high-return opportunities
                                           • Investment Grade Credit rating
                                           • Sustainable organic free cash flows(1)

(1) Term defined in appendix.                                                                                                                                                                                                                     3
Portfolio Transformation                                                                                                      www.nblenergy.com   NYSE: NBL

Enhanced focus on high-margin assets with strengthened financial position
                           Strategic Actions                                        Increased USO Liquids and EMed Mix
       Entered liquids-rich Eagle Ford and Delaware Basin                           from 40% to 70% of Total Production
                     through ROSE Merger
 ..............................................................................   2015                                                       USO Liquids
      Achieved Core Delaware Scale with CWEI Acquisition                                                                                     EMed
                                                                                  2018E
 ..............................................................................                                                              USO Gas

    Optimized DJ Basin Position through Acreage Exchanges                         2020E                                                      Other

     and Generated Over $1 B in Tail Inventory Proceeds
                                                                                          0%          25%    50%        75%          100%
 ..............................................................................

       Sanctioned Initial Phase of Leviathan Development
 ..............................................................................    $B     Reduced Debt ~$2 B Since 2015
                                                                                   10
          Exited Marcellus Upstream and Midstream,
       Accelerating Value of Assets Not Attracting Capital                          8
                                                                                                         CWEI
 ..............................................................................     6
                                                                                                        Assumed       Debt
          Exited Gulf of Mexico, Accelerating Cash Flows                            4                     Debt     Retirement
 ..............................................................................
                                                                                    2
            Maintained Investment Grade Credit Rating                                          YE15                                 YE17

                                                                                                                                                         4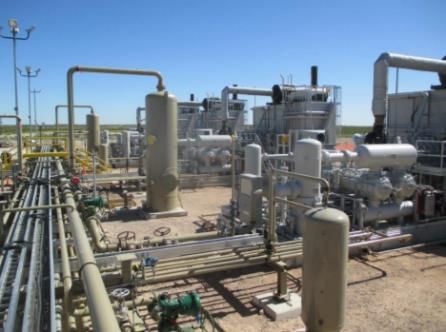
Multi-year Outlook Key Highlights                                                                                                www.nblenergy.com   NYSE: NBL

Delivering leading performance and strong returns to shareholders
Enhanced Shareholder Return
• Board authorized $750 MM share repurchase program
• Progressive dividend growth with cash flow expansion

              Leading Performance Outcomes (2018-2020)                                                           At $50           At Strip

                              Cumulative Excess Cash Flow(1)                                                     ~$1.5 B          ~$3.0 B

                         Cash Flow From Operations CAGR(2)                                                        ~35%              ~40%

                                          2020 Sales Volumes                                                  ~525 MBoe/d      ~525 MBoe/d

                                          Net Debt / EBITDA(1)                                                < 1.5x in 2020   < 1.5x in 2019

                                             ROACE(1) in 2020                                                     ~10%              ~11%

See price deck in appendix. (1) Term defined in appendix.
(2) For purposes of CAGR calculation, divestment-adjusted 2017 represents base for three-year plan outcome.                                                 5
Outlook Through 2020                                                                                                           www.nblenergy.com   NYSE: NBL

Key changes from January 2017 plan

  Planning for
                                                                           Liquids Now ~70%                     USO Type Curves Average
  $50 long-term                                                            USO Volumes
  Decrease of $5 WTI/Brent                                                 Exited Marcellus
                                                                                                                Increase 15-25%

Announced Share Repurchase                                                       Sanctioned                     2018-2020 Cash Flow From
Program Totaling
                                                                                 Leviathan                      Operations CAGR(1)

$750 MM                                                                          Increased 2020 gross volumes   Up ~10% points
                                                                                  to ~800 MMcf/d

(1) For purposes of CAGR calculation, divestment-adjusted 2017 represents base for three-year plan outcome.                                               6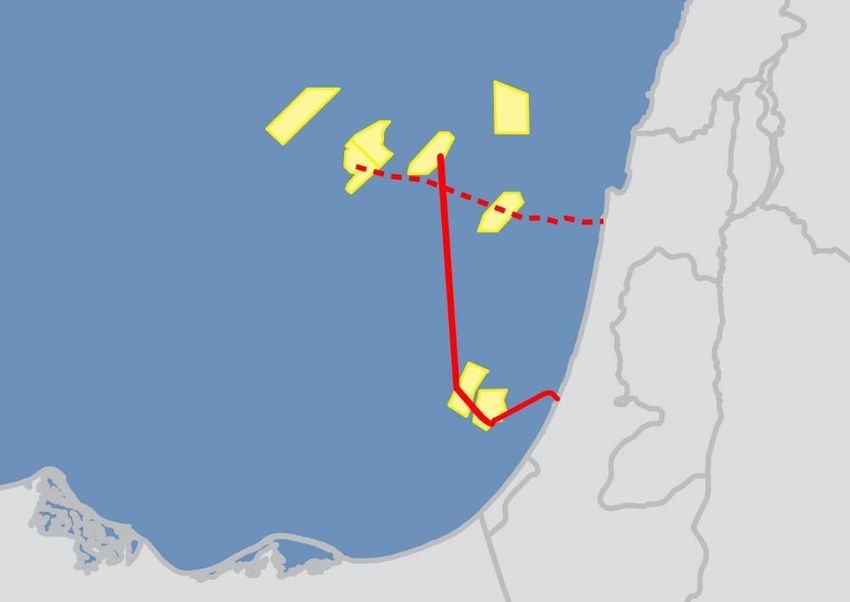
Portfolio Optimization and Execution Driving Margin Expansion                                                                                                            www.nblenergy.com   NYSE: NBL

Substantial enhancement from January 2017 plan
                                                                                                                   Capital Deployed to High-margin, High-return USO and EMed
    2020 Outcomes Improved: Current vs. Prior Plan                                                                 ................................................................................
                                   Price normalized to $50
                                                                                                                   Divestment of Lower-margin Marcellus Assets Which
                                                                                                                   Comprised 12% of 2020 Volumes in Prior Plan
                                                                                                                   ................................................................................
      Total Company Cash Margin(1)
                                                                                                                   Lease Operating Expense Trends Significantly Below $4 per
                                                                                      ~30% Increase
                                                                                                                   BOE from USO Efficiencies and EMed Mix

                                                                                                                           Productivity Increases Driving Same USO
      USO Liquids + EMed Volume (% of Total)                                                                                  Volume on $500 MM Less Capital
                                                     ~20% Increase                                              MBoe/d             (Excludes Marcellus from all periods)                     $B
                                                                                                                 450                                                                         7.0

                                                                                                                300
     Unit Operating Costs(2)                                                                                                                                                                 6.5
                                                                                                                150
                                    ~25% Reduction
                                                                                                                  0                                                                          6.0
                                                                                                                           2018E 2019E 2020E                2018E 2019E 2020E
                             Current Plan               January 2017 Plan                                                    January 2017 Plan                  Current Plan
                                                                                                                          Total USO Volumes         2018-2020 Cumulative Upstream Capital
(1) Term defined in appendix.
(2) Includes lease operating expenses, gathering and transportation, production taxes and marketing expenses.                                                                                       7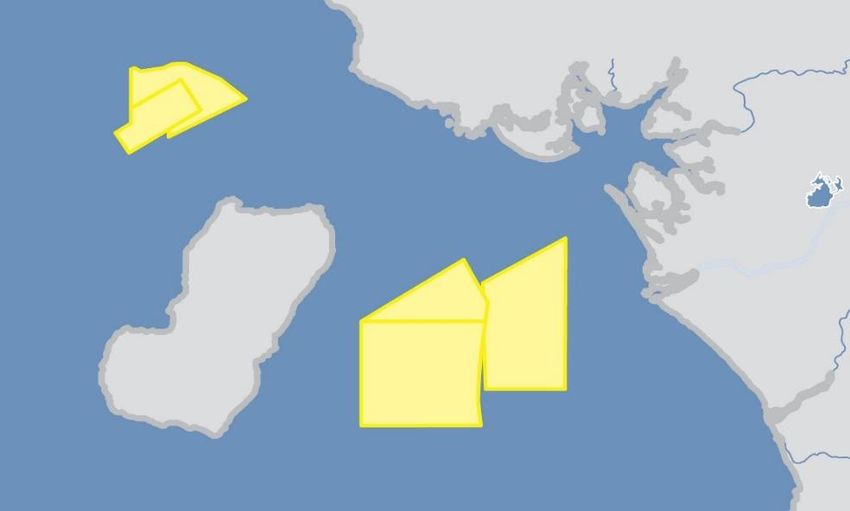
Total Company Outlook to 2020                                                                                                            www.nblenergy.com   NYSE: NBL

Cash flow accelerates faster than volumes

                                            Operating Cash Flow
    $MM
    4,500
                                                                                                                                         %
                                                                                                                                       35 at $50
    3,000

    1,500                                                                                                             Operating Cash     %
                                                                                                                                       40 at Strip
                                                                                                                       Flow CAGR(2)
          0
                        2017                          2018E                       2019E                       2020E
                     Proforma(1)                     At $50              At Strip Pricing

                                       Total Company Volumes
  MBoe/d
   600                                                                                                                                 20%             Total
      450                                                                                                     ~525
      300
      150
                          303                          348
                                                                                    ~400
                                                                                                                       Sales Volume
                                                                                                                                       26%              Oil
                                                                                                                          CAGR(2)
          0
                        2017                         2018E                          2019E                     2020E
                     Proforma(1)                    Guidance
                                                    Midpoint
Price deck defined in appendix.
(1) See proforma divestment table in appendix.                                                                                                                      8
(2) For purposes of CAGR calculation, divestment-adjusted 2017 represents base for three-year plan outcome.
Focused and Disciplined Capital Deployment                                                                                                                www.nblenergy.com   NYSE: NBL

USO and Leviathan driving growth to 2020
Over 95% of Total Capital Focused on High-margin, High-return USO and EMed Assets
......................................................................................................................................

Planned Capital Spend Assumes Same Activity at $50 and at Strip Pricing Scenarios
......................................................................................................................................

USO Volumes Expected to Grow at a 25% CAGR(1) to ~400 MBoe/d in 2020, Led by Delaware and DJ Basins

     $MM                                    NBL Capital(2)                                                    MBoe/d           USO and EMed Volumes
     3,000                                                                                                     500
                                                                                                                                     25% CAGR(1)
                                                                                                               375
     2,000
                                                                                                               250

     1,000
                                                                                                               125

            0                                                                                                    0
                        2017                2018E               2019E                2020E                               2017         2018E    2019E      2020E
                                                                                                                       Proforma(3)
                                  USO Upstream                 EMed          Other                                                       USO       EMed

(1) For purposes of CAGR calculation, divestment-adjusted 2017 represents base for three-year plan outcome.
(2) Excludes NBLX-funded capital.                                                                                                                                                    9
(3) See proforma divestment table in appendix.
2018-2020 Cash Flow Sources and Uses Outlook www.nblenergy.com NYSE: NBL
Returning substantial cash to shareholders
Uses Include Current Dividend, ~$600 MM Cumulative
Excess
ExcessCash
CashFlow
FlowCreated
Created
• Anticipate dividend growth with cash flow growth
...................................................................................
$3 B at Strip
~$11.5 B $1.5 B Excess Cash Flow(1) at $50 WTI
~$10 B • Returning 50% to shareholders through Board approved
$1.5 B at $50 $750 MM share repurchase plan
• $600 MM NBL debt reduction planned
...................................................................................
Actively Hedging Crude for 2018 and 2019
Sources Excess Cash ...................................................................................
at $50 Uses Flow(1)
With Additional Cash Flow, Will Prioritize Opportunities
to Maximize Shareholder Value:
Included in Consolidated Sources and Uses
• Additional share repurchases and dividend increases
Sources
Cash Flow From Operations (including existing hedges),
Planned Asset Proceeds and Midstream Monetizations
• Incremental activity that increases cash flow per debt-
adjusted share growth and NAV
Uses NBL Capital, NBLX Capital, Dividends/Distributions
Price deck defined in appendix.
(1) Term defined in appendix. 10Evolution of Executive Incentive Plan www.nblenergy.com NYSE: NBL
Compensation aligned with shareholder interests to drive superior returns
Short-term Incentive Plan
Quantitative Metrics (60%) Pre-downturn Current
Cash Costs 15% 20% Qualitative Metrics (40%) Include:
• Safety / Environmental Performance
Free Cash Flow 0% 15% • Total / Relative Shareholder Return
Onshore Rate of Return 0% 15% • ROACE / CROCI
• Cash Flow per Debt-adjusted Share
Sales Volumes 15% 10% • Strategic Initiatives
Discretionary Cash Flow 15% 0% • Reserves / Exploration
Relative TSR 15% 0%
Long-term Incentive Plan Based on Relative Total Shareholder Return
• Payout limited if no positive absolute TSR generated
• Increased performance unit weighting to 50%
See proxy for further details. 11Sustainable Potential Beyond 2020 www.nblenergy.com NYSE: NBL
Delivering long-term value for shareholders
Focused Outcomes at $50 NBL in 2020 NBL 2021-2023(2)
Organic Free Cash Flows(1) ~$750 MM ~$1.7 B
annual average
Double-digit Corporate Returns ~10% 11-15%
ROACE(1) ROACE(1) annually
Estimated Sales Volumes ~525 MBoe/d ~625 MBoe/d
in 2023
Balance Sheet Strength < 1.5x < 1.5x
net debt to EBITDA(1) net debt to EBITDA(1)
Price deck defined in appendix.
(1) Term defined in appendix. 12
(2) Does not currently include potential impact from additional offshore major project investments.www.nblenergy.com NYSE: NBL
Operations Outlook
13U.S. Onshore www.nblenergy.com NYSE: NBL
Premier assets and proven operational execution
Multiple Decades of High-return Inventory in
Liquids-rich, Low Cost Basins DJ Basin
..................................................................... 335,000 net acres; 79% avg. WI
2,350 gross locations
Industry-leading Well Performance: 2,000+ Horizontal 9,800’ average lateral length
Wells and Continuous Improvement Culture 1.7 BBoe net unrisked resources
.....................................................................
Integrated Upstream and Midstream Development
.....................................................................
Delaware, Permian Basin
Safety and Environmental Stewardship
117,000 net acres; 73% avg. WI
3,800 gross locations
7,800’ average lateral length
2 BBoe net unrisked resources
4+ BBoe ~6,500
net unrisked resources future drilling locations
Eagle Ford
~45-85 % 31 % 33,000 net acres; 100% avg. WI
320 gross locations
BTAX ROR at $50 across near-term oil CAGR(1) to 2020 6,400’ average lateral length
development areas 400 MMBoe net unrisked resources
Price deck defined in appendix.
(1) For purposes of CAGR calculation, divestment-adjusted 2017 represents base for three-year plan outcome. 14Robust USO Portfolio Outlook 2018-2020 www.nblenergy.com NYSE: NBL
~$900 MM cumulative free cash flow(2) at $50; incremental > $1 B at strip
Asset-level Upstream Capital Allocation
Volume CAGR(1)
USO Asset Portfolio to 2020 Free Cash Flow (2)
Cum. 2018-2020
~$6.5 B
Cumulative
2018-2020
Delaware:
Growth Engine > 75% Neutral Delaware
DJ Basin
Eagle Ford
DJ Basin:
Growth While > 15% ~$500 MM
Generating Cash
Total USO Volume
CAGR(1) to 2020 25%
Eagle Ford:
Flat ~$370 MM USO Oil Volume
Cash Engine
CAGR(1) to 2020 31%
Price deck defined in appendix.
(1) For purposes of CAGR calculation, divestment-adjusted 2017 represents base for three-year plan outcome. 15
(2) Term defined in appendix.Focused USO Portfolio Driving Capital Efficiency www.nblenergy.com NYSE: NBL
Significant enhancement in Texas and Colorado
Increased Productivity in DJ Basin Productivity Increases Driving Same USO
• Type curves up by 25% on average in Volume on $500 MM Less Capital
near-term focus areas (Excludes Marcellus from all periods)
• Optimizing completion design, cluster and stage MBoe/d $B
spacing 450 7.0
• Achieving same annual volume targets from
significantly fewer wells online
................................................................... 300
6.5
Enhanced Delaware Basin Capital Efficiency
• 20-25% increase in 3rd Bone Spring and 150
Wolfcamp A Upper type curves
• Maintained Wolfcamp A well costs, offsetting
inflation and higher concentration with 0 6.0
2018E 2019E 2020E 2018E 2019E 2020E
efficiencies and use of local sand
January 2017 Plan Current Plan
• Achieved operational efficiencies through
development mode Total USO Volumes 2018-2020 Cumulative Upstream Capital
16Delaware Basin www.nblenergy.com NYSE: NBL
Stacked pay development in peer-leading oil position
Contiguous Acreage Position in Core of the Southern Delaware
70
NBL Oil Avg.
%
Ward
.......................................................................................................
Near-term Focus on Wolfcamp A & 3rd Bone Spring Co-development
• Strong results from initial multi-zone tests confirm lateral and vertical spacing
• Continue to test Wolfcamp B & C, encouraging initial results
• 9,000 ft average lateral length over plan period
• Integrated midstream supports upstream growth plans while increasing
Pecos retained value
Boe/d per Basin Leading Oil Productivity
Reeves 1,000 ft Reeves County Wolfcamp A 3-Month Production(1)
NBL Acreage
200
NBL 58% Above
150
Delaware, Permian Basin NBL Peer Oil Average
117,000 net acres; 73% avg. WI 100
3,800 gross locations
7,800’ average lateral length
50
2 BBoe net unrisked resources
0
Oil Production Total Equivalent Production (20:1)
(1) Source: RS Energy Group, Inc. analysis of public operators 2017 wells with 3 months production in currently available state data. Reflects gross 2-stream production data.
Delaware Peers: BHP, CDEV, CXO, EOG, OXY, PDCE, PE, and REN 17Exceptional Delaware Basin Economics www.nblenergy.com NYSE: NBL
Enhanced completions driving type curve increase
3rd Bone Spring Wolfcamp A Upper Wolfcamp A Lower
1.1 MMBoe Type Curve – Up 20% 1.4 MMBoe Type Curve – Up 25% 1.1 MMBoe Type Curve
Cum. MBoe Cum. MBoe Cum. MBoe
200 200 200
~80% BTAX ROR at $50 ~85% BTAX ROR at $50 ~50% BTAX ROR at $50
7,500 ft lateral; 70% Oil 7,500 ft lateral; 70% Oil 7,500 ft lateral; 70% Oil
150 150 150
$6.5 MM D&C(1) $8.2 MM D&C(1) $8.2 MM D&C(1)
100 100 100
50 50 50
0 0 0
0 20 40 60 80 100 0 20 40 60 80 100 0 20 40 60 80 100
Days on Production Days on Production Days on Production
2017 Average 2017 Average 2017 Average
New Type Curve 1,100 MBoe New Type Curve 1,400 MBoe New Type Curve 1,100 MBoe
(2) (2)
Prior Type Curve 920 MBoe Prior Blended Type Curve 1,100 MBoe Prior Blended Type Curve 1,100 MBoe
Well economics based on 100% WI, 75% NRI. Well costs and economics fully burdened with allocated facilities.
Wolfcamp A assumes 3,000 lbs/ft proppant and slickwater completion. 3rd Bone Spring assumes 800 lbs/ft proppant and hybrid gel completion. 18
(1) Drilling and completion capital. (2) Blended Wolfcamp A type curve from CWEI and legacy NBL acreage.Driving Value from Delaware Expansion www.nblenergy.com NYSE: NBL
Delivering above CWEI acquisition case
NBL Execution Driving More Value per Well
Increased Wolfcamp A Recovery (MBoe)
Message
• Enhanced #1 delivering increased recovery and lower
completions While Maintaining Well Costs
development cost per BOE
• Increased BTAX NPV10 > 20% since CWEI acquisition (at $50) 1,400
..................................................................................... 1,000 1,100
825
Achieving Significant Operating Efficiencies in Development
Mode on CWEI Acreage ROSE CWEI Increased Increased
Acquisition Acquisition Wolfcamp A Wolfcamp A
• Reduced completion cost per foot by 10% while increasing Type Curves(2) Type Curves Lower Type Upper Type
proppant concentration(1) Curve Curve
• Reduced drilling cost per lateral foot(1) by 17% while increasing
average lateral length(1) by ~60% Drilling Advancements since CWEI Acquisition
..................................................................................... Drilling days per
1,000 ft lateral 50%
Infrastructure Build-out Supports Capital-efficient Growth 5 Reduction
4
• 3 new CGFs online in 2018 (2 located in legacy CWEI acreage) 3
including integrated water recycling and disposal 2
1
• Locked in competitive rates for long-haul crude transfer to 0
premium-priced markets, without volume commitments CWEI(1) NBL
(1) Compares NBL 2017 drilling data on CWEI acreage vs. pre-acquisition CWEI wells.
(2) Normalized to 7,500 ft lateral. 19DJ Basin www.nblenergy.com NYSE: NBL
Contiguous, liquids-rich position
Strategically Focused in Liquids-rich Area, Ideal for IDP Development
Weld • Acreage trades since 2013 blocked up core position in rural areas
• > $1 B divestment proceeds since 2016, accelerated value from tail-inventory
East ..................................................................................................
Pony
Enhanced Completions Increasing Recovery and Driving Oil
Wells
Ranch Outperformance
• Maximizing oil production in Wells Ranch and East Pony federal development
Mustang • First Mustang wells online mid-year 2018, focused on low GOR areas
Boe/d per Basin Leading Oil Productivity
1,000 ft
NBL Acreage Municipalities 100
Weld County 3-Month Production(1)
GOR: Low Mid High
75 NBL NBL > 150% Above
DJ Basin Peer Oil Average
335,000 net acres; 79% avg. WI 50
2,350 gross locations
9,800’ average lateral length 25
1.7 BBoe net unrisked resources
0
Oil Production Total Equivalent Production (20:1)
(1) Source: RS Energy Group, Inc. analysis of public operators 2017 wells with 3 months production in currently available state data. Reflects gross 2-stream production data.
DJ Basin Peers: APC, BBG, PDCE, SRCI, WLL, and XOG 20Increased DJ Basin Productivity www.nblenergy.com NYSE: NBL
Enhanced completions driving type curve increase
Type Curves Increased Across All Development Focus Areas Cum. MBoe Wells Ranch: 1.2 MMBoe Type Curve – Up 20%
200
• Wells Ranch type curve in-line with 2017 enhanced completion ~50% BTAX ROR at $50
results 150 9,500 ft lateral; 45% Oil
$6.7 MM D&C(1)
• Increased Mustang type curve from Moser results (prior design) 100
and learnings from similar reservoir characteristics in Wells Ranch 50
........................................................................................
0
0 50 100 150 200
2018-2020 Activity Focused in Wells Ranch and Mustang Days on Production
New Type Curve 1,200 MBoe Prior Type Curve 1,000 MBoe
• Concentrated in low GOR areas, maintain 50+% DJ oil mix 2016 Average 2017 Average
• Oil recovery per foot similar to or better than East Pony
Cum. MBoe
Mustang: 1.3 MMBoe Type Curve – Up 30%
• Expect significant volume ramp late 2018 and through 2019 250
~45% BTAX ROR at $50
........................................................................................ 200
9,500 ft lateral; 45% Oil
150
Mustang IDP Will Be Culmination of USO Learnings to Date $6.9 MM D&C(1)
100
• Utilizing row development concept executed in Eagle Ford 50
• Best in class, tankless facility design 0
0 50 100 150 200
Days on Production
• Gas system protected through compression, applying Wells Ranch New Type Curve 1,300 MBoe Prior Type Curve 975 MBoe
learnings 2016 Average - Moser Pad
Well economics based on 100% WI, 80% NRI. Well costs and economics fully burdened with allocated facilities.
Type curves assume 1,800 lbs/ft proppant and slickwater completion. 21
(1) Drilling and completion capital.Eagle Ford www.nblenergy.com NYSE: NBL
Multi-zone development driving free cash flow(1)
Maximizing Cash Flows for USO Capital Deployment
Dimmit
• $370 MM cumulative asset-level free cash flow(1) through 2020
............................................................................................
Production Flat Year Over Year Through 2020
• Cash flows benefitted by significant volume growth delivered in 2017
• Volumes expected to decline throughout 2018, and increase through
2019
NBL Acreage
............................................................................................
Webb Unlocking Upper Eagle Ford
Gates Ranch
• 2017 tests performing in-line with expectations
............................................................................................
Near-term Activity Focused in North Gates Ranch
Eagle Ford
33,000 net acres; 100% avg. WI
• Co-development of Lower and Upper Eagle Ford
320 gross locations
6,400’ average lateral length
400 MMBoe net unrisked resources
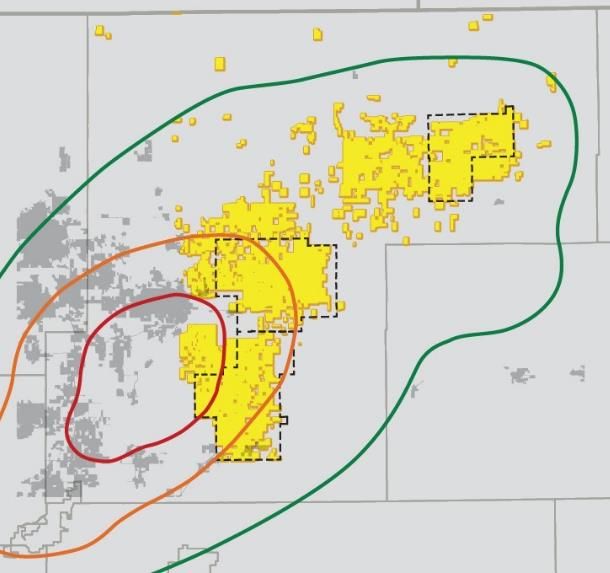
(1) Term defined in appendix. 22Integrated Business Approach Drives Low-risk, High-value Growth www.nblenergy.com NYSE: NBL
Midstream synergies + significant embedded midstream value potential in NBL
• Low-cost, reliable water infrastructure supports efficient development
Water • NBL’s ownership provides attractive drop down optionality
• Delaware: 60% NBL ownership produced water gathering
Services • NBL implementing fresh water delivery, water disposal and recycling
Business • DJ: 75% NBL ownership of water infrastructure in Mustang; 75% NBL
ownership in East Pony
• Enables scalable growth at strategic aggregation points
Centralized • Planned in-sync with upstream development, ensuring deliverability
• NBL’s ownership provides attractive drop down optionality
Gathering & • Delaware: 60% NBL ownership
Processing • DJ: 75% NBL ownership in Mustang; 100% East Pony gas processing
• Diversified marketing approach provides access to premium priced markets
• DJ Basin:
Basin • NBLX connects to key takeaway outlets
• Delaware:
Takeaway • NBLX’s Advantage crude pipeline provides access to Crane, TX and
Capacity multiple downstream outlets
• Acreage dedication to EPIC crude pipeline with access to Corpus Christi
• NBL retains 30% / 15% option for ownership stakes in crude
pipeline and NGL pipeline
23EMed Outlook through 2020 www.nblenergy.com NYSE: NBL
Exceptional assets, margins and growth
Aphrodite Tamar
Long-life Assets with Minimal Decline in High-demand Region 35% WI 32.5% WI(1)
......................................................................................
Leviathan
Tamar Reliably Fueling ~60% of Israel Power, with Leviathan Providing 39.7% WI Dor
Additional Gas Source by End of 2019 Tamar SW
32.5% WI(1)
...................................................................................... Tel Aviv
Increased Leviathan Gross Volume Expectation to 800 MMcf/d in 2020 NBL Interests
Producing
Discovery Ashdod
$MM
7.5% Tamar
Long-term Net Cash Flow Profile Field Development
Existing Pipeline
1,500
Sale ATAX from Tamar and Leviathan(2) Planned Pipeline Israel
Egypt
1,000
MMcfe/d
600 Israel Net Production Outlook
500 Through 2020
400
-
(500) 200
(1,000) 0
2018E 2019E 2020E 2021E 2022E 2023E 2024E 2025E 2017 2018E 2019E 2020E
Capex Corporate Tax Profit Tax BTAX Operating Cash Flow (3) Net Production Divestiture Adjustment
(1) Working interest as of February 20, 2018. Working interest will be 25% upon closing of the 7.5% sale by the end of the first quarter 2018.
(2) Working interest of 39.66% in Leviathan and 25% in Tamar. 24
(3) Term defined in appendix.EMed Regional Demand Outpaces Supply www.nblenergy.com NYSE: NBL
World-class resources in a high-demand region
Bcfe/d
Historic Israel Use Unfulfilled Regional Demand
7
Gas Production Displacing Reliance % of Power Significant Regional Deficit Beyond
MMcfe/d on Coal-fired Power Dispatch From Coal 6 Announced Developments
1,200 60%
5
1,000
Additional
4
800 50% Regional
3 Demand
600
400 40% 2
200 1
Leviathan
0 Contracts
0 30%
2013 2014 2015 2016 2017 2019E 2020E 2021E 2022E 2023E 2024E 2025E
Gross Production % Power Supplied by Coal
Leviathan Contracts Israel Deficit Egypt Deficit Cyprus Deficit Jordan Deficit
Israel Currently Utilizing Alternative Fuels (Coal, LNG, Existing Regional Discoveries Do Not Meet Projected
Diesel, HFO) for Power, Transportation and Industrial; Demand Growth
Potential for Significant Increased Gas Demand • > 2 Bcf/d deficit in Egypt in 2020 growing to > 6 Bcf/d
• Conversion of existing fuels to natural gas could add up to by 2025, despite recent developments
~350-500 MMcf/d • Latent Egypt domestic demand emerging
• Additional ~100-200 MMcf/d anticipated in industrial and • ~0.5 Bcf/d deficit in Jordan through 2025
power demand market growth within the next 3-5 years
Note: Data represents NBL estimates. Egypt forecast accounts for announced developments and discoveries. 25EMed Regional Marketing Progress www.nblenergy.com NYSE: NBL
Executed Tamar and Leviathan export contracts to Egypt
Secured New Volume Commitments to Egypt with Dolphinus Platforms
Existing INGL
• Combined up to 700 MMcf/d for 10 years and will supply
Under Construction INGL
Existing Tamar Pipeline
industrial and petrochemical customers, and power generation Existing Arab Gas Pipeline
Under Construction Arab Gas Pipeline
................................................................................. Existing EGAS Pipeline
Existing EMG Pipeline
Leviathan Contract for Firm 350 MMcf/d at Start-up;
Total Leviathan Volumes Under Contract Now 875 MMcf/d
• First sales agreement with Egyptian customer
Israel
• Total of all Leviathan contracts now estimated to be > $20 B in Jordan
gross revenues or > 5x expected capital invested Egypt
.................................................................................
Tamar Agreement Interruptible Up to 350 MMcf/d Targeting 1 Bcf/d at Leviathan Start-up
• Seller’s option to convert to firm contract, significant take or pay
• Dependent upon gas availability beyond existing customer Contracted 875
obligations in Israel and Jordan
[90]%
• Provides ability to fully utilize current installed Tamar capacity
with pipeline connection Target
Contracted 1,000
26West Africa Outlook through 2020 www.nblenergy.com NYSE: NBL
Maximizing value with new project upside
Significant Cumulative Asset-level Free Cash Flow(1) of
~$600 MM through 2020 at $50 Alba Field
33% WI
Equatorial Cameroon
• Incremental > $200 MM at strip pricing Guinea Alen
45% WI
• Strong global markets for methanol and liquefied products Methanol Plant 45% WI
LPG Plant 28% WI
...................................................................................... Yoyo
Bioko
Island Yolanda NBL Interests
Producing
2018 Maintenance at Alba Impacting 1Q18 Volumes Aseng Discoveries
40% WI
• Gas decline in EG following peak production from the Alba
compression project in 2016
Net Volume Outlook Through 2020
...................................................................................... MBoe/d
75 Natural Gas
Liquids
Progressing Negotiations with all Stakeholders to Monetize 60
Significant Discovered Gas in EG and Cameroon
45
• Potential monetization through existing or new regional LNG
infrastructure 30
15
0
2017 2018E 2019E 2020E
(1) Term defined in appendix. 272018 Capital and Volume Outlook www.nblenergy.com NYSE: NBL
High-margin, high-return investment focus
2018 Capital(1) Program
2018 Capital Program In-line with 2017, Excluding $2.7 - $2.9 B
Leviathan
USO
• ~$750 MM EMed program more than covered by Tamar
cash flows and divestiture proceeds EMed
Midstream
• Midstream capital more than covered by drop down plan
Other
................................................................................
USO Volumes(2) Up > 20% on Flat Capital and USO
MBoe/d
2018 Volumes up 12% Proforma
Oil(2) Up ~30%
400 381
10 343-353
• Growth driven primarily by Delaware Basin (78) 333-343
303
................................................................................ 300
GOM 26 GOM 8
EG Unitization 2 Tamar 7.5% 2
2018 Proforma Volumes In-line With Prior Expectations 200
Tamar 7.5% 10
• Announced divestitures account for 78 MBoe/d 100 Marcellus 34
impact to 2017 reported volumes Other USO 6
• West Africa lower by ~20% 0
• Israel sales volumes up slightly, after adjusting for 2017 Divestment 2017 2018 Divestment 2018
divestiture Actuals Impacts Proforma Proforma Impacts(3)
Guidance
USO EMed Other
(1) Excludes NBLX funded capital expenditures.
(2) See proforma divestment table in appendix. 28
(3) Reflects full year impact of volumes through anticipated transactions closings.www.nblenergy.com NYSE: NBL
Enhancing Value
Delivering leading performance
Committed to Return Value to Shareholders
• Over $1.3 B to shareholders through dividend and share repurchases – additional dividend potential
• Additional shareholder return potential at prices above $50
• 35% cash flow from operations CAGR(1) to 2020 at $50
....................................................................................................................................
Superior Operational Execution
• Improving ROACE(2) to ~10% in 2020 and growing
• 25% USO volume CAGR(1) to 2020, supported by peer-leading well performance
• Leviathan tracking on time and on budget for start-up late next year
....................................................................................................................................
High-quality Portfolio with Extensive Inventory Beyond 2020
• ~6,500 high-return, high-margin locations in onshore shale
• World-class EMed assets with expansion opportunities
See price deck in appendix.
(1) For purposes of CAGR calculation, divestment-adjusted 2017 represents base for three-year plan outcome. 29
(2) Term defined in appendix.www.nblenergy.com NYSE: NBL
Appendix
30www.nblenergy.com NYSE: NBL
Forward-Looking Statements and Other Matters
This presentation contains certain "forward-looking statements" within the meaning of federal securities laws. Words such as "anticipates", "believes“, "expects", "intends", "will", "should",
"may", and similar expressions may be used to identify forward-looking statements. Forward-looking statements are not statements of historical fact and reflect Noble Energy's current views
about future events. Such forward-looking statements may include, but are not limited to, future financial and operating results, and other statements that are not historical facts, including
estimates of oil and natural gas reserves and resources, estimates of future production, assumptions regarding future oil and natural gas pricing, planned drilling activity, future results of
operations, projected cash flow and liquidity, business strategy and other plans and objectives for future operations. No assurances can be given that the forward-looking statements
contained in this presentation will occur as projected and actual results may differ materially from those projected. Forward-looking statements are based on current expectations, estimates
and assumptions that involve a number of risks and uncertainties that could cause actual results to differ materially from those projected. These risks and uncertainties include, without
limitation, the volatility in commodity prices for crude oil and natural gas, the presence or recoverability of estimated reserves, the ability to replace reserves, environmental risks, drilling and
operating risks, exploration and development risks, competition, government regulation or other actions, the ability of management to execute its plans to meet its goals and other risks
inherent in Noble Energy's businesses that are discussed in Noble Energy's most recent annual reports on Form 10-K, respectively, and in other Noble Energy reports on file with the
Securities and Exchange Commission (the "SEC"). These reports are also available from the sources described above. Forward-looking statements are based on the estimates and opinions of
management at the time the statements are made. Noble Energy does not assume any obligation to update any forward-looking statements should circumstances or management’s
estimates or opinions change.
The SEC requires oil and gas companies, in their filings with the SEC, to disclose proved reserves that a company has demonstrated by actual production or conclusive formation tests to be
economically and legally producible under existing economic and operating conditions. The SEC permits the optional disclosure of probable and possible reserves, however, we have not
disclosed our probable and possible reserves in our filings with the SEC. We use certain terms in this presentation, such as “net unrisked resources” and “type curve” which are by their
nature more speculative than estimates of proved, probable and possible reserves and accordingly are subject to substantially greater risk of being actually realized. The SEC guidelines
strictly prohibit us from including these estimates in filings with the SEC. Investors are urged to consider closely the disclosures and risk factors in our and Clayton Williams’ most recent Form
10-K and in other reports on file with the SEC, available from Noble Energy’s offices or website, http://www.nblenergy.com.
This presentation also contains certain non-GAAP measures of financial performance that management believes are good tools for internal use and the investment community in evaluating
Noble Energy’s overall financial performance. These non-GAAP measures are broadly used to value and compare companies in the crude oil and natural gas industry. Please see the attached
schedules for reconciliations of the differences between any historical non-GAAP measures used in this presentation and the most directly comparable GAAP financial measures.
This presentation also contains a forward-looking non-GAAP financial measure, EBITDA (earnings before interest, taxes, depreciation and amortization). Due to the forward-looking nature of
the aforementioned non-GAAP financial measure, management cannot reliably or reasonably predict certain of the necessary components of the most directly comparable forward-looking
GAAP measure at this asset level. Accordingly, we are unable to present a quantitative reconciliation of such forward-looking non-GAAP financial measure to its most directly comparable
forward-looking GAAP financial measure. Amounts excluded from this non-GAAP measure in future periods could be significant. Management believes the aforementioned non-GAAP
financial measure is a good tool for internal use and the investment community in evaluating Noble Energy’s overall financial performance. This non-GAAP measure is broadly used to value
and compare companies in the crude oil and natural gas industry.
31www.nblenergy.com NYSE: NBL
Price Deck Assumptions And Defined Terms
Period Base Plan Strip Plan – as of end January, 2018
WTI, Brent ($/Bbl) Henry Hub ($/Mcf) WTI, Brent ($/Bbl) Henry Hub ($/Mcf)
2018 $50, $53 $3 $63, $68 $2.90
2019 $50, $53 $3 $58, $64 $2.80
2020 $50, $54 $3 $55, $61 $2.80
2021-2023 Avg. $52, $56 $3.10 $53, $58 $2.90
Term Definition
Excess Cash Flow GAAP cash flow from operations plus planned portfolio proceeds less organic capital investments less
dividends/distributions less capital lease payments
Free Cash Flow GAAP cash flow from operations less capital investments less dividends/distributions
Asset-level Free Cash Flow Before tax operating cash flow (not including corporate burden) less capital investments
EBITDA GAAP earnings before interest, taxes, depreciation, depletion, and amortization
ROACE Return on average capital employed. GAAP earnings before interest and taxes divided by (shareholders’ equity
plus long-term debt plus long-term capital leases).
Company Cash Margin (Revenues less lease operating expenses, production taxes, transport and gathering costs, marketing expenses,
general and administrative, and interest) divided by total volumes.
32www.nblenergy.com NYSE: NBL
Divestment – Adjusted Volumes (2017 and 2018)
2018 Midpoint
Impact of Impact of
Guidance – Pro-Forma 2017 Actuals – Pro-Forma
Volumes (MBoe/d) Reported
Divestments
2018 Reported Volumes
Divestments
2017
– FY Avg. – FY Avg.
Volumes
US Onshore 248 248 244 (40) 204
Marcellus – closed mid 2017 (34)
Minerals – closed end 2017 (4)
Other(1) (2)
Gulf Of Mexico 8 (8) 0 26 (26) 0
Close mid-2018 (8) (26)
Israel 38 (2) 36 46 (10) 36
Close 1Q 2018 (2) (10)
EG – Including Equity
54 54 65 (2) 63
Method
Unitization – closed mid 2017 (2)
Total Company 348 (10) 338 381 (78) 303
Investor Relations Contacts
Brad Whitmarsh Megan Dolezal Lauren Brown
281.943.1670 281.943.1861 281.872.3208
brad.whitmarsh@nblenergy.com megan.dolezal@nblenergy.com lauren.brown@nblenergy.com
Visit us on the Investor Relations Homepage at www.nblenergy.com
(1) Other includes (3) MBoe/d for DJ Basin divestment, (2) MBoe/d for Permian non-core asset sale in January 2018 and +3 MBoe/d proforma for full-year Clayton Williams acquisition. 33www.nblenergy.com NYSE: NBL
2018 Full-Year Guidance
Crude Oil and Natural Gas Liquids Natural Gas Total Equivalent
Full Year 2018 Sales Volume Condensate (MBbl/d) (MBbl/d) (MMcf/d) (MBoe/d)
Low High Low High Low High Low High
United States Onshore 111 117 57 62 430 460 243 253
United States Gulf of Mexico(1) 5 7 1 1 5 10 7 9
Israel(1) - - - - 215 240 36 40
Equatorial Guinea 13 17 - - 185 210 45 50
Equatorial Guinea - Equity method investment 1 2 5 5 - - 6 7
Total Company 133 139 64 68 865 890 343 353
Capital & Cost Metrics
Capital Expenditures(2) ($MM)
Total Company Organic Capital $2,700 - $2,900
Cost Metrics LOW HIGH
Lease Operating Expense ($/BOE) 3.90 4.30
Gathering, Transportation & Processing ($/BOE) 3.25 3.60
Production Taxes (% Oil, Gas, NGL Revenues) 4.7 5.1
Marketing ($MM) 35 50
DD&A ($/BOE) 14.50 15.25
Exploration ($MM) 125 150
G&A ($MM) 400 430
Interest, net ($MM) 260 300
Other Guidance Items ($MM)
Equity Investment Income 160 200
Midstream Services Revenue – Third Party 60 80
Non-Controlling Interest – NBLX Public Unitholders 100 125
(1) U.S. Gulf of Mexico and Tamar 7.5 interest (Israel) volumes divested are included in sales guidance through anticipated closing: GOM – mid 2Q, Tamar – late 1Q
(2) Capital expenditures guidance excludes NBLX-funded expenditures although consolidated into NBL financials. 34www.nblenergy.com NYSE: NBL
2018 First Quarter Guidance
Crude Oil and Natural Gas Liquids Natural Gas Total Equivalent
First Quarter 2018 Sales Volume Condensate (MBbl/d) (MBbl/d) (MMcf/d) (MBoe/d)
Low High Low High Low High Low High
United States Onshore 103 109 58 62 455 475 238 248
United States Gulf of Mexico(1) 17 21 1 2 18 23 22 26
Israel(1) - - - - 245 270 41 45
Equatorial Guinea 13 17 - - 180 200 44 48
Equatorial Guinea - Equity method investment 1 2 5 5 - - 6 7
Total Company 137 144 64 68 925 950 358 368
Capital & Cost Metrics
Capital Expenditures(2) ($MM)
Total Company Organic Capital $750 - $850
Cost Metrics LOW HIGH
Lease Operating Expense ($/BOE) 4.40 4.70
Gathering, Transportation & Processing ($/BOE) 3.20 3.50
Production Taxes (% Oil, Gas, NGL Revenues) 4.4 4.8
Marketing ($MM) 8 12
DD&A ($/BOE) 14.00 14.75
Exploration ($MM) 40 60
G&A ($MM) 100 110
Interest, net ($MM) 70 85
Other Guidance Items ($MM)
Equity Investment Income 35 50
Midstream Services Revenue – Third Party 10 20
Non-Controlling Interest – NBLX Public Unitholders 25 35
(1) U.S. Gulf of Mexico and Tamar 7.5 interest (Israel) volumes divested are included in sales guidance through anticipated closing: GOM – mid 2Q, Tamar – late 1Q.
(2) Capital expenditures guidance excludes NBLX-funded expenditures although consolidated into NBL financials. 35You can also read