PRESENTATION FULL-YEAR 2020 RESULTS 18 FEBRUARY 2021 - Groupe Bouygues

Page created by Gordon Baker
 
CONTINUE READING
PRESENTATION FULL-YEAR 2020 RESULTS 18 FEBRUARY 2021 - Groupe Bouygues
FULL-YEAR
2020
RESULTS
18 FEBRUARY 2021
PRESENTATION
PRESENTATION FULL-YEAR 2020 RESULTS 18 FEBRUARY 2021 - Groupe Bouygues
This presentation contains forward-looking information and statements about the Bouygues group and its businesses. Forward-looking statements may be identified by the use of
words such as “will”, “expects”, “anticipates”, “future”, “intends”, “plans”, “believes”, “estimates” and similar statements.
Forward-looking statements are statements that are not historical facts, and include, without limitation: financial projections, forecasts and estimates and their underlying
assumptions; statements regarding plans, objectives and expectations with respect to future operations, products and services; and statements regarding future performance of the
Group. Although the Group’s senior management believes that the expectations reflected in such forward-looking statements are reasonable, investors are cautioned that forward-
looking information and statements are subject to various risks and uncertainties, many of which are difficult to predict and generally beyond the control of the Group, that could
cause actual results and developments to differ materially from those expressed in, or implied or projected by, the forward-looking information and statements. Investors are
cautioned that forward-looking statements are not guarantees of future performance and undue reliance should not be placed on such statements. The following factors, among
others set out in the Group’s Universal Registration Document (Document d’engregistrement universel) in the chapter headed Risk factors (Facteurs de risques), could cause actual
results to differ materially from projections: unfavourable developments affecting the French and international telecommunications, media, construction and property markets; the
costs of complying with environmental, health and safety regulations and all other regulations with which Group companies are required to comply; the competitive situation on each
of our markets; the impact of tax regulations and other current or future public regulations; exchange rate risks and other risks related to international activities; industrial and
environmental risks; aggravated recession risks; compliance failure risks; brand or reputation risks; information systems risks; risks arising from current or future litigation. Except to
the extent required by applicable law, the Bouygues group makes no undertaking to update or revise the projections, forecasts and other forward-looking statements contained in this
presentation.

                                                                                                                                                                      2
PRESENTATION FULL-YEAR 2020 RESULTS 18 FEBRUARY 2021 - Groupe Bouygues
CONTENTS

⚫   HIGHLIGHTS AND KEY FIGURES
⚫   REVIEW OF OPERATIONS
⚫   FINANCIAL STATEMENTS
⚫   OUTLOOK FOR THE GROUP
⚫   ANNEXES

                                 3
PRESENTATION FULL-YEAR 2020 RESULTS 18 FEBRUARY 2021 - Groupe Bouygues
NEW GOVERNANCE FOR THE GROUP AS OF 17 FEBRUARY 2021

SEPARATION OF THE FUNCTIONS OF CHAIRMAN AND CHIEF EXECUTIVE OFFICER
   ◼   Martin Bouygues will be the Chairman

   ◼   Olivier Roussat, previously Deputy CEO, is appointed Chief Executive Officer of the Bouygues group
       As such, he will chair the Group Management Committee

APPOINTMENT OF TWO NEW DEPUTY CEOs
   ◼   Edward Bouygues, will be responsible for telecoms development, CSR and innovation for the Group.
       He will also be appointed Chairman of Bouygues Europe (the entity which represents Bouygues’ interests
       within the European Union).
       He will also devote part of his time to Bouygues Telecom where he has been appointed Executive Vice-President,
       responsible for development

   ◼   Pascal Grangé, previously Senior Vice-President, will retain his position of Chief Financial Officer of the Group

                                                                                                                   4
PRESENTATION FULL-YEAR 2020 RESULTS 18 FEBRUARY 2021 - Groupe Bouygues
HIGHLIGHTS OF 2020
   AN AGILE, RESPONSIBLE AND RESILIENT GROUP
   ⚫      ACTIVITIES REBOUND SHARPLY IN H2 2020 AFTER H1 SUBSTANTIALLY IMPACTED BY THE PANDEMIC
          ◼     Business segments show strong ability to adapt
          ◼     Group returns to significant profitability in H2 2020
                    > Sharp increase in current operating profit: up 11% vs H2 2019
                    > Current operating margin target exceeded: up 0.8 pts vs H2 2019

   ⚫      VERY ROBUST FINANCIAL STRUCTURE AND EXCELLENT CASH MANAGEMENT
          ◼     Free cash flow after WCR generation of €1.2bn, significantly above 2019a despite the Covid-19 crisis
          ◼     Low level of net debt at €2bn (vs €2.2bn at end-2019) and high level of liquidity at €12bn

   ⚫      NEW MILESTONE IN THE CLIMATE STRATEGY
          ◼     Release of ambitious targets to cut greenhouse gas emissions by 2030, in line with the Paris Agreementb

   ⚫      DIVIDEND OF €1.70 PER SHAREc, REFLECTING THE GROUP’S CONFIDENCE IN ITS FUTURE

(a) Excluding the Alstom dividend of €341m
(b) Climate Markets Day of 16 December 2020                                                                               5
(c) To be proposed to the Annual General Meeting of 22 April 2021
PRESENTATION FULL-YEAR 2020 RESULTS 18 FEBRUARY 2021 - Groupe Bouygues
HIGHLIGHTS OF 2020 BY SECTOR OF ACTIVITY
⚫   CONSTRUCTION BUSINESSES
    ◼   Backlog maintained at record level
    ◼   Rapid rebound in activity in H2 2020, after H1 substantially impacted by the pandemic
          > Increase in profitability in H2 2020: current operating margin up 0.5 pts vs H2 2019
          > Free cash flow after WCR of €1,040m in 2020, higher than in 2019 (€704m)
⚫   TF1
    ◼   Leadership maintained among target audiences
    ◼   Rapid adjustment of programming schedule and costs in the context of the Covid-19 crisis
          > Savings of €152m in programming costs, offsetting the decline in advertising revenue in Broadcasting

⚫   BOUYGUES TELECOM
    ◼   Good commercial momentum in mobile and acceleration in FTTH
          > Record number of new FTTH customers added in Q4 2020
    ◼   Sales from services growth exceeded target (+6.4% vs 2019) and increase in EBITDA after Leases (+6% year-on-year)
    ◼   Free cash flow target achieved for 2020

                                                                                                                   6
PRESENTATION FULL-YEAR 2020 RESULTS 18 FEBRUARY 2021 - Groupe Bouygues
GROUP KEY FIGURES FOR 2020

    ⚫      GROUP DEMONSTRATES RESILIENCE DURING
           THE COVID-19 CRISIS
           ◼      Limited decline in sales (-9% vs 2019) and in current                                                  €m                                                         2019           2020   Change
                  operating profit (-€454m) thanks to the concerted efforts
                                                                                                                          Sales                                                  37,929       34,694         -9%c
                  of all business segments
                                                                                                                          o/w France                                             22,446       20,402         -9%
           ◼      Net profit attributable to the Group of €696m                                                           o/w international                                      15,483       14,292         -8%
                                                                                                                          Current operating profit                                1,676           1,222   -€454m
                      > Increase in non-current charges at TF1
                        (impairment of assets of the Unifya division) and in                                              Current operating margin                                 4.4%            3.5%   -0.9 pts
                                                                                                                                                                                         d            e
                        the construction businesses                                                                       Operating profit                                       1,696            1,124   -€572m
                                                                                                                          Net profit attributable
                      > Contribution from Alstom of €169m vs €238m in 2019,                                                                                                       1,184             696   -€488m
                                                                                                                          to the Group
                        of which €118m in Q4 2020b
                                                                                                                      (c) Down 8% like-for-like and at constant exchange rates
                                                                                                                      (d) Including net non-current income of €20m
                                                                                                                      (e) Including net non-current charges of €98m

(a) TF1 press release of 23 December 2020                                                                                                                                                     7
(b) Capital gain of €87m on the sale of around 4.8% of Alstom’s share capital and a net dilution profit of €31m as a result of the cash-neutral transaction related to the capital increase
with preferential subscription rights
PRESENTATION FULL-YEAR 2020 RESULTS 18 FEBRUARY 2021 - Groupe Bouygues
GROUP RETURNS TO SIGNIFICANT PROFITABILITY IN H2 2020
GROUP CURRENT OPERATING MARGIN: 6.8%, UP 0.8 PTS VS H2 2019, EXCEEDING THE TARGET
  ◼      Construction businesses: catch-up of activity mainly in France in Q3, implementation of savings measures, and
         compensations linked to worksites shutdown in H1 2020

  ◼      TF1: return of advertiser spending and savings in programming costs

  ◼      Bouygues Telecom: robust growth in sales and EBITDA after Leases

   €m                                            H2 2019     H2 2020      Change

      Current operating profit                     1,223       1,354     +€131m               H2 2020 GUIDANCE           
      o/w construction businesses                    838        874       +€36m
                                                                                           Group current operating margin in
      o/w TF1                                         92        122       +€30m                 H2 2020 slightly higher
      o/w Bouygues Telecom                           310        370       +€60m                    than in H2 2019
      Current operating margin                      6.0%       6.8%       +0.8 pts

                                                                                                                 8
PRESENTATION FULL-YEAR 2020 RESULTS 18 FEBRUARY 2021 - Groupe Bouygues
GROUP STRONG FREE CASH FLOW GENERATION

   ⚫      VERY HIGH FREE CASH FLOW GENERATION AFTER WCR OF €1.2BN,                                                                                             Group free cash flow after WCRc (€m)
          UP SHARPLY VS 2019
                                                                                                                                                                                       +47%
          ◼     Robust free cash flowa of €725m, despite the impacts of the pandemic on sales
                                                                                                                                                                                              1,202
                and earnings
                                                                                                                                                                                   d
                     > Group continues to invest to accelerate the growth of its activities in the coming                                                                    815
                       years (net capital expenditure: €1,612mb in 2020 vs €1,602m in 2019)

          ◼     Significant improvement in working capital requirements related to operating
                activities

                     > The business segments focused on collecting their trade receivables and reducing                                                                     2019               2020
                       their inventories                                                                                                                    (d) Excluding the Alstom dividend of €341m

(a) Free cash flow = net cash flow (determined after (i) cost of net debt, (ii) interest expense on lease obligations and (iii) income taxes paid), minus
net capital expenditure and repayments of lease obligations. It is calculated before changes in working capital requirements (WCR) related to
operating activities and excluding 5G frequencies
(b) Excluding the cost of 5G frequencies for €608m, of which €6m of spectrum clearing costs
(c) Free cash flow after WCR = free cash flow calculated after changes in working capital requirements (WCR) related to operating activities and
excluding 5G frequencies
                                                                                                                                                                                              9
PRESENTATION FULL-YEAR 2020 RESULTS 18 FEBRUARY 2021 - Groupe Bouygues
VERY ROBUST GROUP FINANCIAL STRUCTURE
⚫   LOW LEVEL OF NET DEBTa AT END-2020 (€2BN VS €2.2BN AT END-2019), WHICH TAKES INTO ACCOUNT
    ◼ The strong generation of free cash flow after WCR
    ◼ The positive impact of the sale of around 4.8% of Alstom’s share capital for €450mb
    ◼ The acquisition of EIT by Bouygues Telecom (around €830mc)
    ◼ The first installment for the 5G frequencies (3.5 Ghz) of €87m

⚫   HISTORICALLY LOW NET GEARING OF 17%

                     €m                                                        End-Dec 2019    End-Dec 2020    Change

                     Shareholders' equity                                             11,800         11,803      +€3m
                     Net surplus cash (+)/net debt (-)                               (2,222)         (1,981)   +€241m
                     Net gearing                                                        19%             17%      -2 pts

(a) See glossary for definition
(b) Net of fees incurred                                                                                                  10
(c) Acquisition price, after factoring in an estimate of the earn-out clause
GROUP LIQUIDITY AT A HIGH LEVEL
⚫   AVAILABLE CASH AT END-DECEMBER 2020: €12BN

            Available cash (€bn)                                     Debt maturity schedule at end-December 2020 (€bn)

                                                        3

         4.0                                            2                                                                        Evenly spread debt
                                                                                                                                 maturity schedule
                    €12bn
                                                        1
                                    8.0
                                                                                                                                  No covenants on
                                                        0                                                                        medium/long-term
                                                              2021    2022     2023     2024     2025     2026     2027   2028       facilitiesa
            Undrawn MLT facilities                                                    Of which bonds
            Cash

(a) Except for the financing of Miller McAsphalt for €0.6bn

                                                                                                                                     11
CONTENTS

⚫   HIGHLIGHTS AND KEY FIGURES
⚫   REVIEW OF OPERATIONS
⚫   FINANCIAL STATEMENTS
⚫   OUTLOOK FOR THE GROUP
⚫   ANNEXES

                                 12
CONSTRUCTION
    BUSINESSES

Construction of cycle paths – Alsace – France   Vitry-sur-Seine station on the future Line 15 South of the Grand   Rehabilitation of Les Fabriques – Marseille – France
                                                Paris Express project – France                                                                                13
BACKLOG IN THE CONSTRUCTION BUSINESSES AT RECORD LEVEL
                                                                                                       Backlog in the construction businesses
                                                                                                                        (€bn)
                                                                                                                                    b
                                                                                                                               0%
⚫   BACKLOG AT END-DECEMBER 2020 OF €33.1BN (+1%a),
                                                                                                                 33.0                      33.1
    PROVIDING LONG-TERM VISIBILITY                                                                                                          2.0
                                                                                                                  2.2
                                                                                                                               -10%
    ◼   62% of the backlog at Bouygues Construction and Colas
                                                                                                                  9.2                       9.2
        in international markets (stable vs end-December 2019)
                                                                                                                               -1%c

                        Backlog in the construction businesses (€bn)

                                                      33.1          33.0          33.1                                        +2%d
                                                                                                                 21.6                      22.0
                                        31.5
                          30.2
             29.0
                                                                                                        End-December 2019           End-December 2020
                                                                                                    Bouygues Construction        Colas       Bouygues Immobilier
                                                                                             (a) Versus end-December 2019, at constant exchange rates and excluding
                                                                                             principal disposals and acquisitions
                End-         End-        End-         End-          End-          End-       (b) Up 1% at constant exchange rates and excluding principal disposals
            December 15 December 16   December 17* December 18   December 19   December 20   and acquisitions
    (*) Restated for IFRS 15                                                                 (c) Up 1% at constant exchange rates and excluding
                                                                                             principal disposals and acquisitions               14
                                                                                             (d) Up 2% at constant exchange rates and excluding
                                                                                             principal disposals and acquisitions
BACKLOG IN THE CONSTRUCTION BUSINESSES IN FRANCE
⚫   BACKLOG AT END-DECEMBER 2020 OF €13.6BN                                                                    Backlog in France (€bn)
                                                                                                                                   a
    ◼   Order intake up 5% year-on-year in Q4 at Bouygues Construction                                                      -1%
    ◼   Stable backlog for Colas’ Roads activity in mainland France                                           13.8                        13.6
    ◼   Decline in reservations at Bouygues Immobilier: suspension of
                                                                                                               2.1           -11%          1.9
        commercial activity during the first lockdown, impact of the Covid-19
        crisis and of the electoral context on the issuance of building permits
                                                                                                               3.1           +2%           3.1

             EXAMPLES OF CONTRACTS BOOKED IN Q4 2020

                                           O’Mathurins in Bagneux (€85m)                                                     +1%
                                              Bouygues Construction
                                                       France                                                  8.6                         8.6

                   Intencité Descartes
              in Champs-sur-Marne (€88m)                                                             End-December 2019            End-December 2020
                  Bouygues Construction
                                                                                                  Bouygues Construction           Colas        Bouygues Immobilier
                         France
                                                                                  (a) Down 1% excluding principal disposals and acquisitions

                                                                                                                                                  15
INTERNATIONAL BACKLOG IN THE CONSTRUCTION BUSINESSES
                                                                                                 ⚫   BACKLOG AT END-DECEMBER 2020: UP 2%d
                           International backlog (€bn)
                                             a
                                        +1%                                                          ◼   Strong growth in order intake at Bouygues Construction:
                                                                                                         up 10% in 2020 vs 2019
                           19.2                       19.5
                            0.1           -4%          0.1

                                                                                                          EXAMPLES OF CONTRACTS BOOKED IN Q4 2020
                           6.1           -2%b         6.0

                                                                                                                                                           Health Authority
                                                                                                                        Pawtucket                           services centre
                                                                                                                          Tunnel                               (€202m)
                                                                                                                         (€256m)                               Bouygues
                                                                                                                        Bouygues
                                                                                                                                                             Construction
                                                                                                                       Construction
                                                                                                                       United States                          Hong Kong
                                         +3%c
                           13.0                       13.4

                                                                                                                     Učka Tunnel                          Extension of Valley
                                                                                                                       (€197m)                          Line LRT in Edmonton
                                                                                                                      Bouygues                             (around €500m)
                  End-December 2019          End-December 2020                                                       Construction                               Colas
                                                                                                                        Croatia                                Canada
                  Bouygues Construction         Colas        Bouygues Immobilier
(a) Up 2% at constant exchange rates and excluding principal disposals and acquisitions
(b) 0% at constant exchange rates and excluding principal disposals and acquisitions
(c) Up 4% at constant exchange rates and excluding principal disposals and acquisitions
(d) Versus end-December 2019, at constant exchange rates and excluding principal disposals and                                                     16
acquisitions
KEY FIGURES FOR 2020 IN THE CONSTRUCTION BUSINESSES

⚫    RAPID REBOUND IN ACTIVITY IN H2 2020 LIMITED
                                                                         €m                                                         2019        2020   Change
     THE DECLINE IN SALES AND CURRENT OPERATING MARGIN
     YEAR-ON-YEAR                                                        Sales                                                 29,575      26,208       -11%a
                                                                         o/w France                                            14,316      12,123        -15%
     ◼   Sales down 11% vs 2019, more pronounced
         in France (impact of strict lockdown in H1 2020)                o/w international                                     15,259      14,085         -8%
                                                                         Current operating profit                                   910         437    -€473m
     ◼   Current operating margin: 1.7% (down 1.4 pts year-on-year)
                                                                         o/w Bouygues Construction                                  378         171    -€207m
           > Sharp improvement in H2 2020: 5.7% vs 5.2% in H2 2019       o/w Bouygues Immobilier                                     99          12     -€87m
             (recovery and catch-up of activity, savings measures and    o/w Colas                                                  433         254    -€179m
             compensations linked to worksites shutdown in H1 2020)
                                                                         Current operating margin                                   3.1%        1.7%   -1.4 pts
⚫    STRONG GENERATION OF FREE CASH FLOW AFTER WCR,                      Operating profit                                           859b        387c   -€472m
     MUCH HIGHER THAN IN 2019
                                                                         Free cash flow after WCR                                   704     1,040      +€336m
                                                                        (a) Down 11% like-for-like and at constant exchange rates
                                                                        (b) Including non-current charges of €51m
                                                                        (c) Including non-current charges of €50m

                                                                                                                                           17
18
Génération Ushuaïa
KEY FIGURES AT TF1 GROUP
⚫   LEADERSHIP MAINTAINED AMONG TARGET AUDIENCES
    ◼   Improved audience share among individuals aged 25 to 49
        (up 0.5 pts since 2019)
                                                                           €m                                                 2019          2020        Change
⚫   SALES DOWN 11% YEAR-ON-YEAR                                            Sales                                              2,337        2,082          -11%a
    DUE TO THE IMPACT OF THE COVID-19 CRISIS
                                                                           Current operating profit                             255            190       -€65m
    ◼   A recovery in ad spend in H2 2020
                                                                           Current operating margin                          10.9%             9.1%     -1.8 pts
        partially offsetting the cancellations
        or postponements of campaigns in H1                                Operating profit                                     255            115b     -€140m

    ◼   Return to an almost normal level of activity at Newen in           Free cash flow after WCR                             124            172       +€48m
        H2 2020                                                           (a) Down 11% like-for-like and at constant exchange rates
                                                                          (b) Including non-current charges of €75m related to the impairment of goodwill and of
                                                                          brands at the Unify division
⚫   RAPID ADJUSTMENT OF THE COST STRUCTURE TO THE
    DECLINE IN SALES
    ◼   Savings of €152m in the programming costs of the
        five free-to-air channels vs 2019, fully offsetting the decline
        in advertising revenues at Broadcasting

                                                                                                                                          19
OUTLOOK FOR TF1 GROUP

    This outlook is based on information known to date and excludes any further
                     deterioration in the situation due to Covid-19

⚫   IN 2021, TF1 WILL BENEFIT FROM A STRONG AND DIVERSIFIED LINE-UP
    (DRAMA, ENTERTAINMENT, EURO 2021,…)
⚫   IN A MACROECONOMIC AND HEALTH CONTEXT THAT REMAINS UNCERTAIN,
    TF1 WILL LEVERAGE ITS ABILITY TO ADJUST TO:
    ◼   Manage as best as possible the impact of economic fluctuations on Broadcasting
    ◼   Grow Newen’s activity in international markets by generating a significant share
        of its 2021 sales outside France, and with the platforms by increasing its backlog
        with the pure players
    ◼   Refocus the Unify division, strengthening its brands and generating synergies to
        boost sales and achieve a positive current operating margin in 2021

                                                                                             Marie-Sophie Lacarrau – anchor of TF1’s 1 pm news bulletin

                                                                                                                                20
STRONG COMMERCIAL PERFORMANCE
                                                                                                                                                                            Mobile plan customers excl. EIT and MtoM
                                                                                                                                                                                     (millions of customers)
  ⚫       12.1 MILLION MOBILE                           PLANa         CUSTOMERS AT END-DECEMBER 2020                                                                                                              12.1
                                                                                                                                                                                                        11.5
          ◼      +606,000 customers year-on-year, +150,000 in Q4 2020
                                                                                                                                                                                              10.9
                                                                                                                                                                                 10.3
  ⚫       4.2 MILLION FIXED CUSTOMERS AT END-DECEMBER 2020                                                                                                       9.8

          ◼      Over 38% of fixed customers subscribe to an FTTH offer
                                                                                                                                                              Q4 2016          Q4 2017       Q4 2018   Q4 2019   Q4 2020

  ⚫       RECORD LEVEL OF NEW FTTHb CUSTOMERS WITH 226,000                                                                                                                  Fixed customers (millions of customers)
          ADDED IN Q4 2020                                                                                                                                          % FTTH
                                                                                                                                                                                   and FTTHb customer share
                                                                                                                                                        4.5
                                                                                                                                                                                                                   4.2
          ◼      +604,000 FTTH customers year-on-year                                                                                                               Total
                                                                                                                                                        4.0                                              3.9
          ◼      1.6 million FTTH customers at end-December 2020                                                                                                                                3.7
                                                                                                                                                                                                                  38%
                                                                                                                                                        3.5                            3.4
                                                                                                                                                                     3.1                                 25%
                                                                                                                                                        3.0                                    16%
                                                                                                                                                                       4%
                                                                      Bbox fiber Wi-Fi 6 modem,                                                                                        8%
                                                                                                                                                        2.5
                                                                      the best Wi-Fi on the marketc                                                              Q4 2016         Q4 2017     Q4 2018   Q4 2019   Q4 2020

(a) Excluding EIT and excluding Machine-to-Machine                                                                                                                                                      22
(b) Fiber-To-The-Home: optical fiber from the central office (where the operator's transmission equipment is installed) all the way to homes or business premises (Arcep definition)
(c) Source: 01 Net
Mobile ABPU (€/customer/month)
5% INCREASE IN SALES FROM SERVICES                                                                  +0.5
                                                                                                                                       +0.7

IN Q4 2020a YEAR-ON-YEAR                                                              19.2
                                                                                                                      19.7
                                                                                                                                                       20.4 *

                                                                                  Q4 2018                            Q4 2019                             Q4 2020
⚫      GROWTH IN MOBILE AND FIXED ABPU b                                                     Mobile ABPU    *Restated mobile ABPU (€ 19.8 excl. restatement)

       ◼      +€0.7 for mobile in Q4 2020 vs Q4 2019 to €20.4                                         Fixed ABPU (€/customer/month)
              (restated for the roaming impact)                                                     +1.1
                                                                                                                                       +1.6

                                                                                                                                                       28.6
       ◼      +€1.6 for fixed in Q4 2020 vs Q4 2019 to €28.6                                                          27.0
                                                                                      25.9

                                                                                  Q4 2018                            Q4 2019                             Q4 2020
⚫      5% INCREASE IN SALES FROM SERVICES VS Q4 2019,                                         Fixed ABPU

       DESPITE THE €33M DECLINE IN ROAMING                                                                     Sales from services (€m)
                                                                                                                         +5%
       ◼      Sales from mobile services: +3%
                                                                                                            1,200                  1,257
              >      Increase in sales billed to customers
                                                                                                            382                     417
              >      Decline in roaming sales (fall in intercontinental travel)                                                     840

       ◼      Sales from fixed services: +9%                                                                818
                                                                                                           Q4 2019                Q4 2020
                                                                                                 Mobile sales from services      Fixed sales from services

(a) Excluding EIT
                                                                                                                                          23
(b) See glossary for definition
2020 KEY FIGURESa AT BOUYGUES TELECOM
⚫     SALES FROM SERVICES: UP 6.4% VS 2019, EXCEEDING                             €m                                                          2019              2020       Change
      THE 2020 TARGET                                                             Sales                                                      6,058              6,438         +6%c
                                                                                  o/w sales from services                                    4,597              4,893          +6%
⚫     6% INCREASE IN EBITDA AFTER LEASES TO €1,502M
                                                                                  o/w other sales                                            1,461              1,545          +6%
     ◼        Of which a net roaming impact decline of around -€90m
              in 2020                                                             EBITDA after Leasesb                                       1,411              1,502      +€91m
                                                                                  EBITDA after Leases/sales from
                                                                                                                                            30.7%            30.7%             0 pt
⚫     CURRENT OPERATING PROFIT OF €623M                                           services
     ◼        Of which around €50m related to an improvement in arrears           Current operating profit                                      540              623       +€83m
              and a review of the duration of some depreciation and               Operating profit                                             610  d
                                                                                                                                                                651 e
                                                                                                                                                                           +€41m
              amortization
                                                                                  Gross capital expenditure
                                     GUIDANCE FOR 2020                                                                                          940          1,270f       +€330m
                                                                                  excluding 5G frequencies
          ◼       Growth in sales from services of between 5% and 6%             Divestments                                                   104             245g     +€141m
          ◼       Gross capex of €1.25bn (including expenditures necessary
                  for the integration of EIT but excluding 5G frequencies)       Free cash flowb
                                                                                 (b) See glossary for definition
                                                                                                                                                301              254        -€47m

          ◼       Free cash flow of around €250m                                (c) Up 6% like-for-like
                                                                                 (d) Including non-current income of €70m mainly related to the capital gain on the sale of mobile sites
                                                                                 (e) Including non-current income of €28m mainly related to the capital gain on the sale of mobile sites
                                                                                 (f) Excluding the cost of 5G frequencies for €608m, of which spectrum clearing costs of €6m
                                                                                 (g) Including €185m of divestments relating to SDAIF (Astérix)

    (a)   Excluding EIT                                                                                                                                    24
EIT: A STRATEGIC ACQUISITION
                                                                                                  KEY FIGURES

                                                                                                       2020 sales:
⚫   TRANSACTION COMPLETED ON 31 DECEMBER 2020 FOR A PRICE OF €564M                                      ~ €550m
    (BEFORE FACTORING IN AN ESTIMATE OF THE EARN-OUT CLAUSE)                                       Customer base of
                                                                                                      2.1 million
⚫   BOUYGUES TELECOM, THIRD BIGGEST MOBILE OPERATOR WITH 14.2 MILLION                               2020 mobile ABPU:
    CUSTOMERS                                                                                             €15.3
    ◼   EIT adds 2.1 million customers                                                                   Around
                                                                                                      150 employees

⚫   A WAY TO WIN NEW MARKET SHARE THAT WILL HELP ACHIEVE THE 2026 AMBITION
    IN MOBILE AND IN BTOB                                                                     FIVE DISTINCT BRANDS
    ◼   EIT is present in three key mobile market segments: BtoC, BtoB and wholesale
    ◼   Leveraging the Crédit Mutuel-CIC distribution network to boost market share in BtoC
        (mobile and fixed) and in BtoB, especially with SMEs

⚫   SYNERGIES RELATED TO SWITCHING EIT CUSTOMERS TO BOUYGUES TELECOM'S
    NETWORK

                                                                                                        25
A NEW STRATEGIC PLAN FOR BOUYGUES TELECOM

                                       MOBILE                                                       FIXED BTOC                                                     FIXED BTOB

                                    Become N°2                                                  +3m BtoC fiber                                         Double the market share
                                     in mobile                                                    customers                                                 in fixed BtoB

                                                                                   Provide the best customer service

                                    Broadband network: joint leader in terms of                                          Employee dedication:
                                    network coverage, capacity and quality                                               Remain the best employer in the sector

                                 Sales from services >€7bn| EBITDAAL ~€2.5bn | EBITDAAL margin ~35%
                                                       | ~€600m of free cash flowa
(a) Free cash flow: net cash flow (determined after (i) cost of net debt, (ii) interest expense on lease obligations and (iii) income taxes paid), minus net capital expenditure and
repayments of lease obligations. It is calculated before changes in working capital requirements (WCR) related to operating activities and excluding 5G frequencies                    26
Leverage the factors that have driven Bouygues Telecom’s success since 2015 (duplicate)
                               and implement new initiatives (accelerate)

⚫   TO BE RECOGNIZED BY CUSTOMERS AS THE NUMBER TWO MOBILE OPERATOR
    ◼   Benefit from the brand’s repositioning “We are made to be together” introduced in 2020
    ◼   Consolidate its position as the second best mobile network in France
    ◼   Capitalize on the integration of EIT

⚫   GAIN AN ADDITIONAL 3 MILLION FTTH CUSTOMERS
    ◼   Double FTTH coverage (from 17.7m FTTH premises marketed at end-2020 to 35m in 2026)
    ◼   Propose innovative, eco-designed, best-in-class fixed devices
    ◼   Market high-quality, competitively-priced offers while continuing the “more for more” strategy

⚫   DOUBLE THE MARKET SHARE IN FIXED BTOB AND BECOME A FIXED WHOLESALE PLAYER
    ◼   Increase market share on the SME segment by drawing on a multi-channel distribution network
    ◼   Monetize its FTTO and FTTA infrastructure in BtoB and expand its fixed wholesale offering

                                                                                                         27
OUTLOOK FOR BOUYGUES TELECOM

                              This outlook is based on information known to date and
                         excludes any further deterioration in the situation due to Covid-19

⚫   IN 2021, BOUYGUES TELECOM WILL LAUNCH THE FIRST STAGE OF ITS STRATEGIC PLAN: RAMPING UP IN
    FTTH, AND IN MOBILE WITH THE INTEGRATION OF EIT

    IT EXPECTS:
    ◼   Organic growth in sales from services estimated at around 5%, despite the continued restrictions on travel
        related to the pandemic which are having a significant impact on roaming usage

    ◼   Increase in EBITDA after Leases (including EIT) of around 5%, linked to higher expenditures related to growth
        acceleration in fixed and improvement in mobile network capacity

    ◼   Net capital expenditure of €1.3bn (excluding 5G frequencies) in order to keep pace with the growth in the
        mobile and fixed customer base and in usage

                                                                                                               28
CONTENTS

⚫   HIGHLIGHTS AND KEY FIGURES
⚫   REVIEW OF OPERATIONS
⚫   FINANCIAL STATEMENTS
⚫   OUTLOOK FOR THE GROUP
⚫   ANNEXES

                                 29
CONDENSED CONSOLIDATED INCOME STATEMENT
 €m                                                                                                                                               2019                    2020             Change
 Sales                                                                                                                                         37,929                   34,694               -9%a
 Current operating profit                                                                                                                        1,676                    1,222            -€454m
 Other operating income and expenses                                                                                                                20b                    (98)c           -€118m
 Operating profit                                                                                                                                1,696                    1,124            -€572m
 Cost of net debt                                                                                                                                (207)                    (167)            +€40m
 Interest expense on lease obligations                                                                                                             (57)                     (53)            +€4m
 Other financial income and expenses                                                                                                               (10)                     (33)            -€23m
 Income tax                                                                                                                                      (452)                    (317)            +€135m
 Share of net profits of joint ventures and associates                                                                                              350                     216            -€134m
 o/w Alstom                                                                                                                                         238                     169             -€69m
 Net profit from continuing operations                                                                                                           1,320                      770            -€550m
 Net profit attributable to non-controlling interests                                                                                            (136)                      (74)           +€62m
 Net profit attributable to the Group                                                                                                            1,184                      696            -€488m
(a) Down 8% like-for-like and at constant exchange rates
(b) Including non-current charges of €28m at Colas related to the continued dismantling of the Dunkirk site and to adaptation costs at structures, of €23m at Bouygues Construction
related to restructuring costs and non-current income of €70m at Bouygues Telecom (of which €63m related to the capital gain on the sale of mobile sites)
(c) Including non-current charges of €17m at Bouygues Immobilier mainly related to restructuring costs, of €69m at Colas mainly related to the reorganization of the roads activities in
France and the continued dismantling of the Dunkirk site, of €75m at TF1 related to the impairment of goodwill and of brands at the Unify division, and non-current income of €36m at
Bouygues Construction mainly related to compensation received from Alpiq net of fees incurred, and of €28m at Bouygues Telecom mainly related to the capital gain on the sale of 30
mobile sites
CONDENSED CONSOLIDATED BALANCE SHEET
                                                                  End Dec                                                               Of which:
                                                                                          End Dec
 €m                                                                  2019                                         Change                • Intangible assets: +€517m, including 5G licences
                                                                                            2020
                                                                 restateda                                                                 (+€608m) and impairment of Unify brands (-€17m)
                                                                                                                                        • Goodwill: +€691m, including EIT (+€756m) and
 Non-current assets                                                  20,365                 21,497            +€1,132m                     impairment of Unify (-€58m)
                                                                                                                                        • Investments in JVs and associates: -€14m, including
 Current assets                                                      19,115                 19,085                 -€30m                   valuation of Bouygues Telecom’s share in SDAIF
                                                                                                                                           (+€295m), and Alstom (-€263m)
 Held-for-sale assets and
                                                                               -                   41              +€41m
 operations
                                                                                                                                    •     Net book value of data centers (which are due to be sold
 TOTAL ASSETS                                                        39,480                 40,623            +€1,143m                    in 2021) at Bouygues Telecom

 Shareholders’ equity                                                11,800                 11,803                   +€3m
 Non-current liabilities                                               8,215                  9,436           +€1,221m              Of which:
                                                                                                                                    • Non-current debt: +€1,308m, including the €1bn bond
 Current liabilities                                                 19,465                 19,384                 -€81m               issue carried out at Bouygues SA in April 2020

 Liabilities related to held-for-sale
                                                                               -                      -                      -
 operations
 TOTAL LIABILITIES                                                   39,480                 40,623            +€1,143m
 Net surplus cash (+)/net debt (-)b                                 (2,222)                (1,981)               +€241m
(a) “Right of use of leased assets” and “lease obligations” as of 31 December 2019 have been restated for the effects of applying
the IFRS Interpretation Committee final decision on lease terms                                                                                                              31
(b) See glossary for definition
CHANGE IN NET DEBT POSITIONa IN 2020 (1/2)
  €m                       Net debt at                                                                                                                                          Net debt at
                           31/12/2019                                                                                                                                           31/12/2020

                                                   Alstomb
                                                                                                                                                                  Operations
                                                    +450
                                                                           -747                                                                                                  (1,981)
                            (2,222)                                                                +37                                                               +1,275
                                                                     Acquisitions/             Capital                   -687
                                                                      disposalsc            transactionsd                                      -87
                                                                                              and other
                                                                                                                     Dividends             5G frequencies

        2019                (3,612)               +1,405e                   -180f                  +182g                  -710                     0                     +693   (2,222)

(a) See glossary for definition
(b) Sale of around 4.8% of Alstom’s share capital, net of fees incurred
(c) Including the acquisition of EIT by Bouygues Telecom, and of Granit Contracting LLC by Colas, as well as the amount received in relation to the Digicel litigation
(d) Including share buybacks, the exercise of stock options and the remainder of the Bouygues Confiance n°11 capital increase reserved for employees
(e) Including €1,079m related to the sale of 13% of Alstom’s share capital, costs of €15m related to the operation and dividend of €341m                                            32
(f) Including the acquisitions of Keyyo and Nerim by Bouygues Telecom, and of De Mensen and Reel One by TF1, and the sale of Smac by Colas
(g) Including share buybacks, exercise of stock options and the Bouygues Confiance n°11 capital increase reserved for employees
CHANGE IN NET DEBT POSITIONa IN 2020 (2/2)
  €m                                                                                  Breakdown of operations
                                                                Repayment of
                          Net cash     flowb                  lease obligations                        Net capexc
                               +2,709                                                                                                                    Changes in WCR
                                                                                                                                                            related to
                                                                       -372
                                                                                                                                                        property, plant &
                                                                                                                                       Changes in WCR    equipment and
                                                                                                                                         related to     intangible assets,
                                                                                                                                          operating         and otherc
                                                                                                         -1,612
                                                                                                                                          activities
                                                                                                                                                                +73
                                                                                                                                               +477                                 +1,275

                                                  +2,337
                              Net cash flow including lease expenses
       2019                     +2,991d                              -351                              -1,602                                 -223          -122                  +693

                                                 +2,640d
                             Net cash flow including lease expenses
(a) See glossary for definition
(b) Net cash flow = cash flow determined after (i) cost of net debt, (ii) interest expense on lease obligations and (iii) income taxes paid
(c) Excluding 5G frequencies                                                                                                                                                 33
(d) Excluding €341m Alstom dividend
CONTRIBUTION TO NET CAPITAL EXPENDITURE BY SECTOR OF ACTIVITY

 €m                                            2019     2020         Change

 Construction businesses                        521      303         -€218m
 o/w Bouygues Construction                       189     114          -€75m
 o/w Bouygues Immobilier                          11       5           -€6m
 o/w Colas                                       321     184          -€137m
 TF1                                            242      283         +€41m
 Bouygues Telecom                               836    1,025a        +€189m
 Bouygues SA & other                              3        1           -€2m
 Sub-total                                     1,602   1,612a        +€10m
 5G frequencies                                    -    608b         +€608m
 Group net capital expenditure                 1,602   2,220         +€618m
(a) Excluding cost of 5G frequencies
(b) Including spectrum clearing costs of €6m

                                                                34
CONTENTS

⚫   HIGHLIGHTS AND KEY FIGURES
⚫   REVIEW OF OPERATIONS
⚫   FINANCIAL STATEMENTS
⚫   GROUP OUTLOOK
⚫   ANNEXES

                                 35
AN AGILE, RESPONSIBLE AND RESILIENT GROUP
◼   Activities that meet essential needs (housing, transportation, communication, information,
    entertainment, etc.), with business models which have not been undermined by the pandemic

◼   Business segments able to rebound swiftly and strongly
      > The business segments’ fast responsiveness and ability to adjust had an impact as early as April
◼   Key strengths
      > Employee dedication
      > Good quality of labor relations
      > Robust financial structure
◼   A resolutely responsible and proactive Group
      > Employee’s fixed wages maintained while on furlough in March
      > A 25% reduction in the total remuneration of Executive Officers for 2020
      > Decision not to pay an exceptional dividend (following the partial divestment of Alstom)
      > Immediate payment by Bouygues Telecom of the invoices of its SME and microbusiness partners
        in April and May
      > Establishment of ambitious climate targets by each one of the five business segments
                                                                                                           36
CAPITAL ALLOCATION POLICY MAINTAINED, REFLECTING THE GROUP’S
  CONFIDENCE IN ITS STRATEGY

         Grow the construction businesses
                   Energies & Services                                                                     Strong Investment Grade rating
    e.g. strengthen expertise in renewable energies
                                                                                                                            S&P
      (electric vehicle charge point infrastructure,
              solar power, green hydrogen)                                                                        A-, negative outlook
                           Colas
                                                                    Strengthening
                                                                      of existing       Low debt level                   Moody’s
   e.g. roll-out of the bitumen and quarries strategy
                  Bouygues Immobilier                                  business
                                                                                                                    A3, stable outlook
             e.g. expansion of the land bank                          segments
               Accelerate the growth of
                  Bouygues Telecom
                     e.g. acquisition of EIT,
                   Ambition 2026 strategic plan
                                                                              Shareholder
               Strengthen TF1's position                                        return
                   in the value chain
                  e.g. grow Newen’s business                                                             Dividend
                                                                                                    €1.70/sharea for 2020
                                                                                                        stable vs 2019             37
(a) To be proposed to the Annual General Meeting of 22 April 2021
OUTLOOK FOR THE GROUP

                 This outlook is based on information known to date
        and excludes any further deterioration in the situation due to Covid-19

⚫   RELYING ON A PARTICULARLY STRONG FINANCIAL POSITION,
    THE GROUP WILL INVEST IN 2021 TO STRENGTHEN ITS BUSINESS
    SEGMENTS AND ACCELERATE THEIR GROWTH IN THE COMING YEARS

    ◼   In 2021, the Group’s sales and earnings should be well above those of
        2020, without reaching those of 2019

    ◼   In 2022, Group current operating profit should return to the same level
        of 2019 or be slightly higher
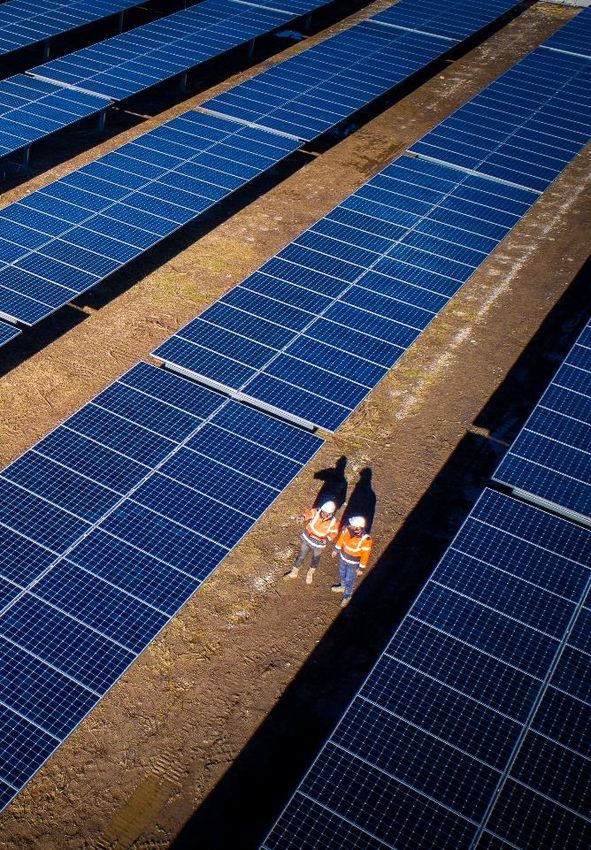
                                                                                  Solar farm – France

                                                                                                        38
THE GROUP’S CSR ROADMAP
                             The Group has set four priorities for 2021:
        health and well-being in the workplace, gender balance, the climate, and biodiversity

◼   The protection of health and improved well-being for employees in the workplace
      > Boost the Quality of Life at Work initiative
      > Continue the roll-out of a common core of employee benefits in all Group companies outside France based on the best
        practice in each country (BYCare program)

◼   Encouraging gender balance at all levels
      > The launch of the 2021-2023 gender balance plan
      > The performance-linked pay of Executive Officers and of business segment heads to be based partly on gender balance criteria

◼   The roll-out of the business segments’ climate strategy and protect biodiversity
      > Detail the milestones and the financial impacts of the climate strategy
      > Study the financial and strategic conditions required to reach carbon neutrality by 2050
      > Specify its pledges for protecting biodiversity
                                                                                                                     39
CALENDAR

◼   22 April 2021      Combined Annual General Meeting
    (2.30pm CET)

◼   20 May 2021        First-quarter 2021 results
    (7.30am CET)

◼   26 August 2021     First-half 2021 results
    (7.30am CET)

◼   18 November 2021   Nine-month 2021 results
    (7.30am CET)

                                                         Bourse du Commerce building – Paris
                                                                                               40
QUESTIONS & ANSWERS

                                                Martin Bouygues            Olivier Roussat    Pascal Grangé
                                                Chairman                   CEO                Deputy CEO
                                                                                              Chief Financial Officer

   Philippe Bonnave   Pascal Minault   Frédéric Gardès            Gilles Pélisson            Richard Viel
   Chairman and CEO   Chairman         Chairman and CEO           Chairman and CEO           Chairman and CEO

                                                                                                            41
CONTENTS

⚫   HIGHLIGHTS AND KEY FIGURES
⚫   REVIEW OF OPERATIONS
⚫   FINANCIAL STATEMENTS
⚫   OUTLOOK FOR THE GROUP
⚫   ANNEXES

                                 42
ANNEX
KEY FIGURES AT BOUYGUES CONSTRUCTION
       International             Order intakea (€bn)
       France
                                                               +3%
                                                                                                             Backlog by geographic region (at end-Dec 2020)
                  14.5

                                               12.3                           12.7
                   8.7                                                                                                                 7%
                                                                                                                                            2%                    France
                                                7.2                                       +10%                                                      39%
                                                                               8.0                                                                                Asia-Pacific
                                                                                                                                34%     €22bn                     Europe (excl. France)

                   5.8                                                                                                                                            Americas
                                                5.1                            4.8
                                                                                          -6%                                                                     Africa and Middle East
                                                                                                                                            18%
                 2018                          2019                           2020
(a) Contracts are booked as order intakes at the date they take effect
     For execution in over 5 years   Backlog (€bn)                                               €m                                               2019           2020            Change
     For execution in 2 to 5 years
                                                             +2%
                                                                   b
                                                                                                 Sales                                           13,355       12,047              -10%c
     For execution in 1 year
                                                                                                 o/w France                                       5,320         4,813               -10%
                  22.2                        21.6                         22.0                  o/w international                                8,035         7,234               -10%
                   2.5                         2.2                          2.7           +21%   Current operating profit                           378           171            -€207m
                                                                                                 Current operating margin                          2.8%          1.4%            -1.4 pts
                   9.8                         9.3                          9.6           +2%    Operating profit                                 355d           207e            -€148m
                                                                                                 (c) Down 10% like-for-like and at constant exchange rates
                   9.9                        10.1                                               (d) Including non-current charges of €23m (restructuring costs)
                                                                                                 (e) Including non-current income of €36m mainly related to compensation received from Alpiq
                                                                                          -3%
                                                                            9.7                  net of fees incurred

       End-December 2018             End-December 2019             End-December 2020                                                                                  43
(b) Up 2% at constant exchange rates and excluding principal disposals and acquisitions
ANNEX

KEY FIGURES AT BOUYGUES IMMOBILIER
       Residential property           Reservationsa (€bn)
       Commercial property
                                                                   -32%
                  2.6                              2.7
                  0.3                              0.6
                                                                                    1.8
                                                                                    0.2            -60%
                  2.3                              2.1
                                                                                    1.6            -23%

                 2018                             2019                             2020
(a) Net of cancellations (residential property) and firm orders which cannot be cancelled (commercial
property)                                                                                                                             Hôtel des Postes – Strasbourg – France
       Residential property               Backlogb (€bn)
       Commercial property                                                                                €m                                                       2019               2020       Change
                                                                                                          Sales                                                  2,706            2,032          -25%c
                  2.5                                              -10%
                                                                                                          o/w residential                                         2,207            1,750           -21%
                  0.3                              2.2
                                                   0.2                              2.0                   o/w commercial                                             499               282         -43%
                                                                                    0.2             nm    Current operating profit                                    99               12       -€87m
                  2.2                              2.0                              1.8
                                                                                                          Current operating margin                                 3.7%               0.6%       -3.1 pts
                                                                                                                                                                                            d
                                                                                                          Operating profit                                            99              (5)       -€104m
                                                                                                    -9%   (c) Down 25% like-for-like and at constant exchange rates
                                                                                                          (d) Including non-current charges of €17m mainly related to restructuring costs

        End-December 2018                End-December 2019                End-December 2020
(b) Backlog does not include reservations taken via co-promotion companies
                                                                                                                                                                                 44
ANNEX

  KEY FIGURES AT COLAS
     International and French                Backlog (€bn)
     overseas territories                                                      a
                                                                         -1%
     Mainland France
                                                        9.2                               9.2
                         8.5

                                                                                                          -2%b
                         5.1                            6.1                               6.0

                         3.4                                                                              +2%c
                                                        3.1                               3.1

               End-December 2018              End-December 2019                    End-December 2020                                             Colas Rail project – Poland

(a) Up 1% at constant exchange rates and excluding principal disposals and acquisitions                             €m                                                 2019          2020          Change
(b) 0% at constant exchange rates and excluding principal disposals and acquisitions
(c) Up 2% excluding principal disposals and acquisitions                                                            Sales                                           13,688         12,297           -10%d
                                        2020 sales by activity                                                      o/w France                                        6,596         5,551             -16%
      Road construction
                                                                                                                    o/w international                                 7,092         6,746              -5%
      Railways/specialized
      activities                                                                                                    Current operating profit                            433           254        -€179m
                                                                                          Roads mainland France/
                                                                                          overseas departments      Current operating margin                           3.2%          2.1%         -1.1 pts
                                                                                          -Indian Ocean                                                                        e          f
                                                                   16%                                              Operating profit                                   405           185         -€220m
                                                                         3%               Roads Europe
                     10%        €12.3bn          90%                               47%    Middle East & Africa     (d) Down 9% like-for-like and at constant exchange rates
                                                                15%                                                (e) Including non-current charges of €28m mainly related to the continued dismantling of
                                                                                          Roads United States
                                                                                                                   the Dunkirk site and to adaptation costs at structures
                                                                    19%                   Roads Canada             (f) Including non-current charges of €69m mainly related to the reorganization of the
                                                                                          Roads Asia-Pacific       roads activities in France and the continued dismantling of the Dunkirk site
                                                                                                                                                                                          45
ANNEX
 KEY INDICATORS AT BOUYGUES TELECOM
                                             Q1          Q2          Q3          Q4                        Q1       Q2      Q3      Q4                Q1      Q2      Q3      Q4
                                                                                            2018                                           2019                                      2020
                                            2018        2018        2018        2018                      2019     2019    2019    2019             2020    2020    2020    2020

 Sales from mobile
                                               719         734         779         754       2,986          751     776     804     818    3,149     816     805     830     840 3,291
 services (€m)
 Sales from fixed
                                               312         309         319         330       1,270          343     356     367     382    1,448     389     394     402     417 1,602
 services (€m)

 Mobile customer base                      14,840 15,288 15,764 16,351                                    16,824 17,070 17,505 17,800              18,010 18,178 18,450 18,755
 Mobile customer base
                                           11,097 11,175 11,343 11,414                                    11,529 11,632 11,831 11,958              12,042 12,169 12,336 12,473
 excl. MtoM
 o/w plan customersa                       10,449 10,570 10,769 10,890                                    11,039 11,171 11,391 11,543              11,656 11,817 11,999 12,149
                                                                                                                                                                                            Q2: 19 and,
                                                                                                                                                                                            Q3: 19.5 and,
 Mobile ABPUb                                 19.2        19.6        19.9        19.2                     19.2     19.4    19.9    19.7             19.6    19.7    20.3    20.4           Q4: 19.8
                                                                                                                                                                                            excluding
 Data usage                                                                                                                                                                                 restatement
                                            5,415       6,171       6,858        7,162                    7,524    8,716   9,909 10,730            12,134 11,742 12,709 12,767
 (MB/month/customer)c

 Fixed customersd                           3,492       3,533       3,604        3,676                    3,735    3,770   3,831   3,916           3,964    3,989   4,053   4,163
 o/w FTTH customerse                           329         391         467         569                      663     745     855     996             1,113   1,206   1,375   1,600
 Fixed ABPUf                                  26.3        25.6        25.5        25.9                      25.8    25.9    26.6    27.0             27.1    27.2    28.1    28.6
(a) Plan subscribers: total customer base excluding prepaid customers according to the Arcep definition
(b) Average Billing Per User (see glossary for definition): excluding MtoM SIM cards and free SIM cards
(c) Quarterly usage, adjusted on a monthly basis, excluding MtoM SIM cards
(d) Includes broadband and very-high-speed subscriptions according to the Arcep definition                                                                                      46
(e) Arcep definition: subscriptions with peak downstream speeds higher or equal to 100 Mbit/s
(f) Average Billing Per User (see glossary for definition), excluding BtoB
ANNEX

 FTTHa PREMISES MARKETEDb (MILLIONS)
                    Bouygues Telecom                                             Bouygues Telecom                                          Bouygues Telecom                             Bouygues Telecom
                  at end-December 2019                                         at end-December 2020                                        target for end-2022                          target for end-2026

                                                                                                                                                                                            35.0

                                                                                                                                                 27.0

                                                               +6                        17.7
                                  11.8                                                   5.1
                                  4.0
                                                                                         10.2
                                   6.8
                                   1.0                                                    2.3
                                                                                                                                       c                                         c
                                                                      Very dense area               Medium dense area (AMII)                    Medium dense area (PIN)

(a) Fiber-To-The-Home – optical fiber from the central office (where the operator's transmission equipment is installed) all the way to homes or business premises (Arcep definition)
(b) Premises marketed: the connectable sockets, i.e. the horizontal and vertical deployed and connected via the concentration point
(c) In accordance with deployment by building operators in the AMII zone and by operators in the PIN zone                                                                                          47
ANNEX

SALES BY SECTOR OF ACTIVITY
                                                                                                                                 Lfl &
 €m                                                                                             2019     2020    Change
                                                                                                                           constant fxa
 Construction businessesb                                                                      29,575   26,208    -11%            -11%
 o/w Bouygues Construction                                                                     13,355   12,047     -10%           -10%
 o/w Bouygues Immobilier                                                                        2,706    2,032     -25%           -25%
 o/w Colas                                                                                     13,688   12,297     -10%            -9%
 TF1                                                                                            2,337    2,082    -11%            -11%
 Bouygues Telecom                                                                               6,058    6,438     +6%            +6%
 Bouygues SA & other                                                                             202      180       nm             nm
 Intra-Group eliminationsc                                                                      (417)    (382)      nm             nm
 Group sales                                                                                   37,929   34,694     -9%             -8%
 o/w France                                                                                    22,446   20,402      -9%            -9%
 o/w international                                                                             15,483   14,292      -8%            -7%
(a) Like-for-like and at constant exchange rates
(b) Total of the sales contributions (after eliminations within the construction businesses)
(c) Including intra-Group eliminations of the construction businesses                                                     48
ANNEX

CONTRIBUTION TO GROUP EBITDA AFTER LEASESa
BY SECTOR OF ACTIVITY
 €m                                   2019    2020         Change

 Construction businesses              1,640   1,300        -€340m
 o/w Bouygues Construction              591     424        -€167m
 o/w Bouygues Immobilier                117      47         -€70m
 o/w Colas                              932     829        -€103m
 TF1                                   514     454         -€60m
 Bouygues Telecom                     1,411   1,502        +€91m
 Bouygues SA & other                   (17)    (23)         -€6m
 Group EBITDA after Leases            3,548   3,233        -€315m
(a) See glossary for definition

                                                      49
ANNEX

CONTRIBUTION TO GROUP CURRENT OPERATING PROFIT BY
SECTOR OF ACTIVITY
€m                                   2019   2020         Change

Construction businesses              910     437         -€473m
o/w Bouygues Construction             378     171        -€207m
o/w Bouygues Immobilier                99      12         -€87m
o/w Colas                             433     254        -€179m
TF1                                  255     190         -€65m
Bouygues Telecom                     540     623         +€83m
Bouygues SA & other                  (29)    (28)         +€1m
Group current operating profit      1,676   1,222        -€454m

                                                    50
ANNEX

CONTRIBUTION TO GROUP OPERATING PROFIT BY SECTOR OF
ACTIVITY
 €m                                                                                                                                             2019                     2020                Change

 Construction businesses                                                                                                                          859                      387               -€472m
 o/w Bouygues Construction                                                                                                                         355                      207                -€148m
 o/w Bouygues Immobilier                                                                                                                             99                      (5)               -€104m
 o/w Colas                                                                                                                                         405                      185                -€220m
 TF1                                                                                                                                              255                      115               -€140m
 Bouygues Telecom                                                                                                                                 610                      651                +€41m
 Bouygues SA & other                                                                                                                              (28)                    (29)                   -€1m
 Group operating profit                                                                                                                       1,696a                  1,124b                 -€572m
(a) Including non-current charges of €28m at Colas related to the continued dismantling of the Dunkirk site and to adaptation costs at structures, of €23m at Bouygues Construction related to restructuring
costs and non-current income of €70m at Bouygues Telecom (of which €63m related to the capital gain on the sale of mobile sites)
(b) Including non-current charges of €17m at Bouygues Immobilier mainly related to restructuring costs, of €69m at Colas mainly related to the reorganization of the roads activities in France and the
continued dismantling of the Dunkirk site, of €75m at TF1 related to the impairment of goodwill and of brands at the Unify division, and non-current income of €36m at Bouygues Construction mainly related
to compensation received from Alpiq net of fees incurred, and of €28m at Bouygues Telecom mainly related to the capital gain on the sale of mobile sites

                                                                                                                                                                                    51
ANNEX

CONTRIBUTION TO NET PROFIT ATTRIBUTABLE TO THE GROUP
BY SECTOR OF ACTIVITY
€m                                     2019    2020         Change

Construction businesses                 623    214          -€409m
o/w Bouygues Construction                325    152         -€173m
o/w Bouygues Immobilier                   46    (29)         -€75m
o/w Colas                                252     91         -€161m
TF1                                      67      24         -€43m
Bouygues Telecom                        343    377          +€34m
Alstom                                  238    169          -€69m
Bouygues SA & other                     (87)   (88)          -€1m
Net profit attributable to the Group   1,184   696          -€488m

                                                       52
ANNEX

CONTRIBUTION TO GROUP NET CASH FLOWa BY SECTOR OF
ACTIVITY
 €m                                                                                                                                           2019    2020         Change

 Construction businesses                                                                                                                      1,391    992         -€399m
 o/w Bouygues Construction                                                                                                                      491     355         -€136m
 o/w Bouygues Immobilier                                                                                                                        120     (4)         -€124m
 o/w Colas                                                                                                                                      780     641         -€139m
 TF1                                                                                                                                           416     373          -€43m
 Bouygues Telecom                                                                                                                             1,275   1,422        +€147m
 Bouygues SA & other                                                                                                                           250     (78)        -€328m
 Group net cash flow                                                                                                                          3,332   2,709        -€623m
 Excluding Alstom dividends: €341m in 2019 and €0m in 2020                                                                                    2,991   2,709         -€282m
(a) Net cash flow = cash flow determined after (i) cost of net debt, (ii) interest expense on lease obligations and (iii) income taxes paid

                                                                                                                                                              53
ANNEX

CONTRIBUTION TO GROUP FREE CASH FLOWa BY SECTOR OF
ACTIVITY
 €m                                                          2019    2020         Change

 Construction businesses                                      675    481          -€194m
 o/w Bouygues Construction                                     204    141          -€63m
 o/w Bouygues Immobilier                                       100    (18)        -€118m
 o/w Colas                                                     371    358          -€13m
 TF1                                                          156      69         -€87m
 Bouygues Telecom                                             301    254          -€47m
 Bouygues SA & other                                          247    (79)         -€326m
 Group free cash flow                                        1,379   725          -€654m
 Excluding Alstom dividends: €341m in 2019 and €0m in 2020   1,038    725         -€313m
(a) See glossary for definition

                                                                             54
ANNEX

CONTRIBUTION TO GROUP FREE CASH FLOW AFTER WCRa
BY SECTOR OF ACTIVITY
 €m                                                          2019    2020         Change

 Construction businesses                                      704    1,040        +€336m
 o/w Bouygues Construction                                      58     393        +€335m
 o/w Bouygues Immobilier                                       305    (24)         -€329m
 o/w Colas                                                     341     671        +€330m
 TF1                                                          124     172         +€48m
 Bouygues Telecom                                             135      40          -€95m
 Bouygues SA & other                                          193     (50)        -€243m
 Group free cash flow after WCR                              1,156   1,202        +€46m
 Excluding Alstom dividends: €341m in 2019 and €0m in 2020     815   1,202        +€387m
(a) See glossary for definition

                                                                             55
ANNEX

NET SURPLUS CASH (+)/NET DEBT (-)a
                                                                                                                                            End-Dec             End-Dec
 €m                                                                                                                                                                             Change
                                                                                                                                               2019                2020
 Bouygues Construction                                                                                                                          3,113             3,143         +€30m
 Bouygues Immobilier                                                                                                                             (279)            (306)          -€27m
 Colas                                                                                                                                           (367)               (7)        +€360m
 TF1                                                                                                                                             (127)               (1)        +€126m
 Bouygues Telecom                                                                                                                            (1,454)             (1,740)        -€286m
 Bouygues SA & other                                                                                                                         (3,108)             (3,070)        +€38m
 Group net surplus cash (+)/net debt (-)                                                                                                     (2,222)             (1,981)        +€241m
 Current and non-current lease obligations                                                                                                (1,812)b              (1,733)         +€79m
(a) See glossary for definition
(b) “Lease obligations” as of 31 December 2019 have been restated for the effects of applying the IFRS Interpretation Committee final decision on lease terms

                                                                                                                                                                           56
ANNEX
 GLOSSARY (1/2)
SALES FROM SERVICES (BOUYGUES TELECOM) COMPRISE:
    ◼   Sales billed to customers, which include:
         In mobile:
           o For BtoC customers: sales from outgoing call charges (voice, texts and data), connection fees, and value-added services
           o For BtoB customers: sales from outgoing call charges (voice, texts and data), connection fees, and value-added services, plus sales from business
               services.
           o Machine-To-Machine (MtoM) sales
           o Visitor roaming sales
           o Sales generated with Mobile Virtual Network Operators (MVNOs)
         In fixed:
           o For BtoC customers: sales from outgoing call charges, fixed broadband services, TV services (including Video on Demand and catch-up TV), and
               connection fees and equipment hire
           o For BtoB customers: sales from outgoing call charges, fixed broadband services, TV services (including Video on Demand and catch-up TV), and
               connection fees and equipment hire, plus sales from business services
           o Sales from bulk sales to other fixed line operators
    ◼   Sales from incoming Voice and Texts.
    ◼   Spreading of handset subsidies over the projected life of the customer account, required to comply with IFRS 15
    ◼   Capitalization of connection fee sales, which is then spread over the projected life of the customer account.
OTHER SALES (BOUYGUES TELECOM): DIFFERENCE BETWEEN TOTAL SALES AND SALES FROM SERVICES. IT COMPRISES:
   ◼    Sales from handsets, accessories and other
   ◼    Roaming sales
   ◼    Non-telecom services (construction of sites or installation of FTTH lines)
   ◼    Co-financing of advertising

                                                                                                                                          57
ANNEX

GLOSSARY (2/2)
ABPU (AVERAGE BILLING PER USER):
    ◼   Sales billed to customers divided by the average number of customers over the period
EBITDA AFTER LEASES (EBITDAAL)
    ◼   Current operating profit after taking account of the interest expense on lease obligations, before (i) net charges for depreciation, amortization
        and impairment losses on property, plant and equipment and intangible assets, (ii) net charges to provisions and other impairment losses and (iii)
        effects of acquisitions of control or losses of control. Those effects relate to the impact of remeasuring previously-held interests or retained
        interests
NET SURPLUS CASH (+)/NET DEBT (-)
    ◼   Net debt (or net surplus cash) is obtained by aggregating cash and cash equivalents, overdrafts and short-term bank borrowings, non-current and
        current debt, and financial instruments. Net surplus/(net debt) does not include non-current and current lease obligations. A positive figure
        represents net surplus cash and a negative figure represents net debt
FREE CASH FLOW
    ◼   Net cash flow (determined after (i) cost of net debt, (ii) interest expense on lease obligations and (iii) income taxes paid), minus net capital
        expenditure and repayments of lease obligations. It is calculated before changes in working capital requirements (WCR) related to operating
        activities and excluding 5G frequencies.
FREE CASH FLOW AFTER WCR
    ◼   Net cash flow (determined after (i) cost of net debt, (ii) interest expense on lease obligations and (iii) income taxes paid), minus net capital
        expenditure and repayments of lease obligations. It is calculated after changes in working capital requirements (WCR) related to operating
        activities and excluding 5G frequencies
                                                                                                                                              58
You can also read