Bayer 2022: Delivering Value Creation - J.P. Morgan Milan Investor Forum September 26th, 2019 Milan - Bayer Investor Relations

Page created by Bill Dunn
 
CONTINUE READING
Bayer 2022: Delivering Value Creation - J.P. Morgan Milan Investor Forum September 26th, 2019 Milan - Bayer Investor Relations
Bayer 2022:
Delivering Value
Creation
        ///////////

            J.P. Morgan
       Milan Investor Forum
       September 26th, 2019
               Milan

Oliver Luckenbach & Simone Moerchen
Bayer AG
Bayer 2022: Delivering Value Creation - J.P. Morgan Milan Investor Forum September 26th, 2019 Milan - Bayer Investor Relations
Disclaimer
    Cautionary Statements Regarding Forward-Looking Information

    This presentation contains forward-looking statements. A forward-looking statement is any statement that does not relate to
    historical facts and events, but rather reflects Bayer’s current beliefs, expectations and assumptions regarding the future.
    This applies, in particular, to statements in this presentation on revenue growth, including product introductions and peak
    sales potential, synergies, especially in relation to the acquisition and integration of Monsanto Company, portfolio
    adjustments, cost reduction, financial targets and earnings, cash flow generation, deleveraging and other similar statements
    relating to future performance, including with respect to the markets in which Bayer is active.

    Although the forward-looking statements contained in this presentation are based upon what Bayer’s management believes
    are reasonable assumptions, they necessarily involve known and unknown risks and uncertainties that could cause actual
    results and future events to differ materially from those anticipated in such statements. Forward-looking statements are not
    guarantees of future performance and undue reliance should not be placed on them. Bayer undertakes no obligation to
    update forward-looking statements if circumstances or management’s estimates or opinions should change except as
    required by applicable securities laws.

    For more information on factors that could cause actual results and future events to differ from those anticipated in forward
    looking statements, please refer to the factors discussed in Bayer’s public reports which are available on the Bayer website
    at https://www.investor.bayer.com/en/reports/annual-reports/overview/, including in the Annual Report 2018 under the caption
    “Report on Future Perspectives and on Opportunities and Risks”.

2   // Bayer // J.P. Morgan Milan Investor Forum 2019
Bayer 2022: Delivering Value Creation - J.P. Morgan Milan Investor Forum September 26th, 2019 Milan - Bayer Investor Relations
We are a Global Leader in Health & Nutrition
    Well-Positioned Across Our Businesses

                                                                                                      ~€45bn 2018 Pro-forma Sales1
                                   Crop Science                                                                          Pharmaceuticals                                                                          Consumer Health
                             ~€19bn / ~43% of Group                                                                   ~€17bn / ~38% of Group                                                                       ~€5bn / ~12% of Group
                                   #1 Position                                                                       #2 Position in Cardiovascular                                                                      #2 Position
              Growing ahead of competition over                                                         One of the fastest growing Pharma                                                          Leading Positions in 7 of the Top 10
              last five years on average                                                                businesses over the past five years                                                        OTC Markets
              Best-in-class profitability through                                                       Xarelto and Eylea among the world’s                                                            Focus categories:
              the cycle                                                                                 leading Pharma brands                                                                          Allergy & Cold, Cough, Sinus and Flu;
                   Leading portfolio of seed & traits,                                                       Innovative medicines in areas of high                                                     Nutritionals; Dermatology; Pain and
                   crop protection and digital farming                                                       unmet medical need                                                                        Cardio; Digestive Health
                   World-class R&D platform with best                                                        Therapeutic focus areas: Cardiology,                                                      Concentrated portfolio of 16 mega-
                   talent and technology in the industry                                                     Oncology, Gynecology, Hematology                                                          brands with annual sales of >€100m
                   Positioned to shape the future of                                                         and Ophthalmology
                   agriculture: development of tailored                                                      Strong position in emerging markets
                   solutions to address farmers’ individual                                                  Leading in Radiology and Women’s
                   needs and challenges                                                                      Health

    1   The unaudited Pro-forma data are presented as if both the acquisition of Monsanto and the associated divestments had taken place as of January 1, 2018. Sales of Monsanto are presented in periods as per the Bayer fiscal year. One-time effects of business operations, the
        accounting for discontinued operations and the recognition and measurement of sales from certain business transactions have been adjusted in line with our accounting. Due to this simplified procedure, they explicitly do not reflect sales according to IFRS or IDW RH HFA
        1.004, meaning they have not been audited.

3   // Bayer // J.P. Morgan Milan Investor Forum 2019
Bayer 2022: Delivering Value Creation - J.P. Morgan Milan Investor Forum September 26th, 2019 Milan - Bayer Investor Relations
Next Phase to Deliver Value Creation

                                Transformation Completed                                            Next Phase Focused on …

                                              Crop                     1        Growth ahead of competition in Health and Nutrition
                                             Science

                                                                   2         Consistent profitability enhancement

                                                               3           Strong free cash flow generation

                                                           4           Disciplined capital allocation

4   // Bayer // J.P. Morgan Milan Investor Forum 2019
Bayer 2022: Delivering Value Creation - J.P. Morgan Milan Investor Forum September 26th, 2019 Milan - Bayer Investor Relations
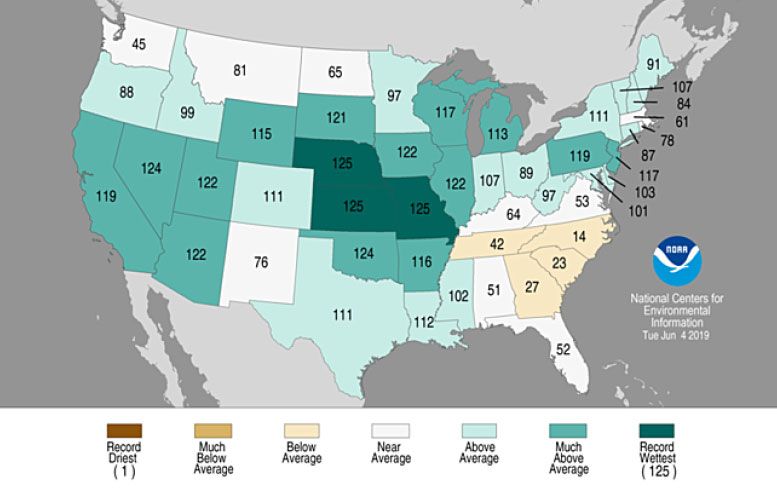
Global Megatrends in Health & Nutrition
    Attractive Macro Drivers of Our Businesses

                                                               Aging Population                                                  Growing Population                                    Pressure on Ecosystems

                                                                                 People 60+                                 +2.2bn                              +50%                                            -20%
    Megatrends
                                                                                 more than                                     people1
    through                                                                                                                                                                               -17%
                                                                                 doubling1                                                               more food and feed
    2050                                                                                                                                                  required to meet         Harvest losses from     2016         2050
                                                                                                                                                          growing demand2           climate change3
                                                                                                                                                                                                           Significant loss in
                                                                >20% of total population1                                                                                                                arable land per capita4

    Societal                                                          Preserve and                                                     Secure sufficient                                  Use natural resources more
    Needs                                                             restore health                                                 supply of quality food                               efficiently and responsibly

    Our                                             We leverage science to address these societal needs –
    Mission                                         with the ultimate goal to improve people’s lives

    1 UNDESA 2017 (United Nations Department of Economic and Social Affairs, Population Division (2017). World Population Prospects: The 2017 Revision)
    2 FAO 2017, (FAO Global Perspective Studies)
    3 Nelson et. al, (2014); FAO 2016 “Climate change and food security”
    4 FAOSTAT (accessed Oct 30, 2018) for 1961-2016 data on land, FAO 2012 for 2030 and 2050 data on land, and UNDEDA 2017: World Population Prospects for world population data

5   // Bayer // J.P. Morgan Milan Investor Forum 2019
Bayer 2022: Delivering Value Creation - J.P. Morgan Milan Investor Forum September 26th, 2019 Milan - Bayer Investor Relations
We Focus on Growth in Attractive Markets

                                                                              Market                                                                                                     Bayer’s growth levers
                                                  Size 2017                                        CAGR
                                                                                                                                                 Using our leading positions in Agriculture, Pharmaceuticals and Self-care to
              Bayer                                                                              2018-2022                                       address societal needs and benefit from global megatrends
              Group                                                                                                                              Drive innovation

                                                                                                                                                 Leading portfolio of seed & traits, crop protection and digital farming
             Crop                                                                                                                                World-class R&D platform with best talent and technology in the industry
            Science                                                                                                                              Positioned to shape the future of agriculture: Development of tailored solutions to address
                                                          ~€90bn1                                                ~3%2                            farmers’ individual needs and challenges

                                                                                                                                                 Innovative medicines in areas of high unmet medical need
           Pharma-                                                                                                                               Therapeutic focus areas: Cardiology, Oncology, Gynecology, Hematology and Ophthalmology
           ceuticals                                                                                                                             Leverage external innovation and partnering as well as pipeline and potential of current
                                                        ~€870bn3                                                 4-5%                            products

          Consumer                                                                                                                               Branded self-care solutions that help transform people’s daily health
           Health                                                                                                                                Focus on five core categories
                                                        ~€140bn4                                                 3-4%
    1 Pro-forma   calculations Bayer, Bayer CS market model;   2   excluding potential cyclical recovery of the Crop Science market;   3   IQVIA ; 4 Market model in-market sales OTC medicines, data from IQVIA, Nicholas Hall

6   // Bayer // J.P. Morgan Milan Investor Forum 2019
Bayer 2022: Delivering Value Creation - J.P. Morgan Milan Investor Forum September 26th, 2019 Milan - Bayer Investor Relations
Bayer 2022 Synergy & Efficiency Programs

                                                            Crop Science                        Consumer Health          Pharmaceuticals
                                                                                                                                                        Overall
                                                   Realization of Crop                         Comprehensive           Re-alignment of R&D            Contribution
                                                   Science sales and cost                      growth acceleration     activities towards external     ~€2.6bn2
                                                   synergies                                   program                 innovation / Hemophilia
                                                  ~€0.17bn (=$0.2bn) sales                                             production footprint
                                                        synergies1                                                                                    Global FTE
                                                                                                                                                        impact
                                                  ~€0.47bn (=$0.55bn) cost                      ~€0.4bn contribution     ~€0.2bn contribution          ~12,000
                                                         synergies

                                                   ~€0.40bn (=$0.45bn) cost
                                                                                                ~€0.1bn contribution                                 One-Time Cost
                                                          synergies
    Platform

                                                                                                                                                        ~1.7X
                      Adjustment of
                      corporate                                                                 ~€0.9bn contribution
                      platform

               1   EBITDA before special items impact from sales synergies
               2   Indicative Phasing: ~30% effective in 2020, ~70% in 2021 and 100% in 2022

7              // Bayer // J.P. Morgan Milan Investor Forum 2019
Cash Flow Improvement Focusing on Capex and Working Capital Optimization

                                                                                    3.1
                                                                            2.5
                                                          1.9         2.2                      Annual contribution of ~0.5bn EUR by 2022
                                                                                               Past and current levels impacted by single large-scale
                                          1.5
    Capex                                                                                      investments in fixed assets
    spend                                                                                      Licensing will continue to be an element to drive growth
    in €bn
    in % of sales                        4.3%           4.9%         5.7%   7.4%    7.0%     Focused CapEx below current levels              ~ 5-6%
             Intangibles              Fixed assets

                                                                                   14.1
                                                                     12.0
                                          9.3           10.1                9.5
                                                                                               Annual contribution of ~0.5bn EUR by 2022
    Working                                                                                    Focus on optimization of inventory levels and receivables
    Capital                                                                                    management
    in €bn
                                        2010            2012         2014   2016   2018 PF                                                      2022e

    in % of sales                         26%           25%          29%    27%    32% 1        Working capital optimization                  ~ 32%
    1 Crop   Science 48%, Pharmaceuticals 24%, Consumer Health 24%

8   // Bayer // J.P. Morgan Milan Investor Forum 2019
Group Targets - Value Creation from Strengthened Base

     €bn                                                                                     20181   Guidance 20192,3   Target 20222,3

                 Sales                                    Total Group                        39.6          ~46              ~52

                                                          Total Group                         9.5     ~12.2 (~27%)      ~16 (>30%)

                                                        Crop Science                          2.7         ~25%             >30%
       EBITDA before
      special items (%)
                                                     Pharmaceuticals                          5.6         ~34%             >35%

                                                     Consumer Health                          1.1         ~21%             ~24%

                                        Core EPS (€)                                         5.94         ~6.80             ~10

                                               FCF                                           ~4.7         ~3-4               ~8

                                    Net financial debt                                       ~35.7         ~36             ~26-28

    1) as   reported   2) at   constant currencies   3) not   including portfolio measures

9   // Bayer // J.P. Morgan Milan Investor Forum 2019
We Have Clear Priorities for Capital Allocation
     Focus on Shareholder Return, Innovation and Deleveraging

                                                                                                                                    Divestment
                                                              Disciplined capital allocation                                         proceeds

                                                                                    Growing dividends
                                                               Shareholder
                                                                                    Consider share buy backs with parts of
                                                               Return
                                                                                    divestment proceeds

                                                                                Target range ~€26-28bn1 net financial debt by end
           Free Cash                                        Deleveraging        2022
         Flow Targeted
                 ~€23bn
               2019e-2022e                               Innovation &        Investment in licensing opportunities
                                                         Acquisitions        Potentially selective bolt-on acquisitions

     1   Before M&A / Portfolio

10   // Bayer // J.P. Morgan Milan Investor Forum 2019
We Will Create Significant Value Through 2022 and Beyond
     Focus on Execution and Driving Sustained Profitable Growth…

                            1             We have completed Bayer’s portfolio transformation into a global leader in Health & Nutrition

                                      The next phase is focused on driving value creation through (i) growth ahead of competition enabled by innovation and
                        2             portfolio measures (ii) profitability enhancement through Bayer 2022 synergy and efficiency programs and (iii) strong cash
                                      generation

                    3             We target Sales, Core EPS and FCF CAGR* until 2022 of 4%, 10% and 18%, respectively

                             Strong FCF along with proceeds from divestments enable (i) growing dividends, (ii) quick deleveraging of our balance
               4             sheet and (iii) selective bolt-ons and in-licensing transactions

     2018e PF used for Sales and Core EPS; 2018e used for FCF

11   // Bayer // J.P. Morgan Milan Investor Forum 2019
///////////

Q2 2019 & Outlook 2019
Bayer Operationally on Track

           €   11,485m                                   € 2,927m                Sales increased by 21% to €11.5bn
                                                                                  (+1% cpa)
            Sales                                        EBITDA                  EBITDA before special items
                                                         Before special items
                                                                                  improved by 25% to €2.9bn
                                                                                   Margin up 70 bps to 25.5%
                                                                                 Core EPS plus 6% to €1.62

         €   1.62                                        € 751m                  Free Cash Flow impacted by timing
                                                                                  of closing in PY and reflects
                                                                                  seasonality of acquired business
           Core EPS                                      Free Cash Flow

13   // Bayer // J.P. Morgan Milan Investor Forum 2019
Crop Science: Solid Performance in a Very Challenging Environment

                               Sales                           Volume           Currency
            In million €, ∆% yoy, Fx & portfolio adj.            -   3%            +   1%
                                    -3%
                                                 4,788           Price          Portfolio
                                                                 + % 0         +   61%           -3% cpa sales reduction driven by adverse
                   3,011
                                                                                                  business conditions in North America
                                                                                                 Good growth across insecticides and vegetable
                                                                                                  seeds
                   Q2'18                          Q2'19
                                                                                                 Pro-forma sales (-10% cpa) primarily impacted
                            EBITDA                                                                by extreme weather conditions in the US
          In million €, ∆% yoy, before special items
                                                                                                 On track to deliver more than €200m in cost
                                                                                                  synergies in 2019
                                   +67%           1,075

                    644

                    21.4%                          22.5%

                    Q2'18                         Q2'19

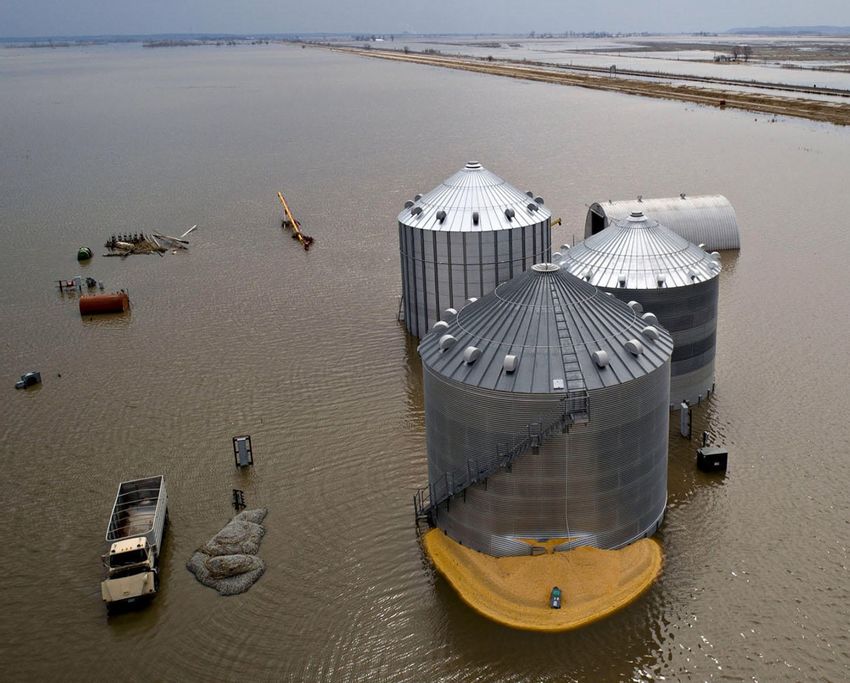
14   // Bayer // J.P. Morgan Milan Investor Forum 2019     EBITDA Margin before special items
2019 U.S. Planting Heavily Impacted by Flooding
     Corn Acres Expected to be Down 2-3% and Soybean Acres to Decline Between 7% and 10% vs Last Year

               May 2019 - Precipitation in many U.S. states
                „much above average“ or „record wettest“

     Source: USDA Weekly Weather and Crop Bulletin, June 11, 2019; USDA Crop Progress, April 3, 1995 - June 17, 2019; USDA WASDE World Agricultural Supply and Demand Estimates, June 11, 2019; FSA Crop Acreage Data Reported to FSA, 2007 – 2019

15   // Bayer // J.P. Morgan Milan Investor Forum 2019
Pharmaceuticals Driven by Xarelto, Eylea and China

                               Sales                           Volume           Currency
            In million €, ∆% yoy, Fx & portfolio adj.           +    4%           +   1%
                                    +4%
                   4,217                          4,422
                                                                 Price          Portfolio
                                                                 -   0%           -   0%         Xarelto up 12%, Eylea grew by 11%
                                                                                                 Continued strong performance in China
                                                                                                  overcompensates weaker US business

                   Q2'18                          Q2'19                                          FDA granted priority review for darolutamide
                                                                                                 New data for larotrectinib demonstrate benefit in
                            EBITDA                                                                TRK fusion cancer patients with brain tumors
          In million €, ∆% yoy, before special items

                                                                                                 Investment in stem cell based cancer therapy
                                   +10%                                                           through Century Therapeutics
                                                  1,500
                   1,363
                                                                                                 EBITDA before special items increase driven by
                                                                                                  higher volume, reduced COGS and lower R&D
                    32.3%                          33.9%                                          spend
                    Q2'18                         Q2'19

16   // Bayer // J.P. Morgan Milan Investor Forum 2019     EBITDA Margin before special items
Consumer Health Returning to Top- and Bottom Line Growth

                               Sales                           Volume           Currency
            In million €, ∆% yoy, Fx & portfolio adj.             0
                                                                 + %              +   1%
                                   +2%

                                                  1,442          Price          Portfolio
                   1,413
                                                                  2
                                                                 + %              -   1%         EMEA, Asia/Pacific and Latin America with
                                                                                                  positive development
                                                                                                 North America bottoming out, double-digit growth
                                                                                                  in allergy and cold
                   Q2'18                          Q2'19
                                                                                                 Increase in EBITDA before special items driven by
                            EBITDA                                                                positive pricing and execution of performance
          In million €, ∆% yoy, before special items                                              improvement measures

                                                   270
                                                                                                 On track to deliver on FY targets
                    256            +5%

                    18.1%                          18.7%

                    Q2'18                         Q2'19

17   // Bayer // J.P. Morgan Milan Investor Forum 2019     EBITDA Margin before special items
Business Drivers to be Considered for H2 2019

                                Crop Science                                            Pharmaceuticals
                                     Corn and soybean commodity prices up which           Xarelto, Eylea and China expected to
                                      may lead to positive volume impact in H2              keep on growing
                                     Market growth in H2 expected to be strong in         Launch of Darolutamide in the US
                                      Latin America and Asia Pacific; expect mid-
                                      single-digit percentage sales growth (cpa) for
                                      our business
                                     On track to deliver cost synergies of more than
                                      €200m in 2019

                                Consumer Health                                         Efficiency / Bayer 2022
                                     Execution of turnaround plan to                      Gross savings of ~€500m expected for
                                      strengthen top-line growth and profitability          2019 across all programs
                                      in H2

18   // Bayer // J.P. Morgan Milan Investor Forum 2019
FY 2019 Guidance Confirmed, Yet Ambitious

                                                               20181                              Group Forecast 20192                    Δ 2018 – 2019
                                                                                                         (at constant currencies)

         Sales                                               €39.6bn                                            ~€46bn                          +~16%                Fx-sensitivity:
                                                                                                                                         (thereof +~12% portfolio)
                                                                                                                                                                     ± 1% change of the € vs all
                                                                                                                                                                            other currencies =
         EBITDA                                                €9.5bn                                         ~€12.2bn                          +~28%                ∓ ~€340m on Sales
         (before special items)

                                                                                                                                                                                       &
                                                                                                                                                                     ∓ ~€100m on EBITDA
                                                                                                                                                                     (before special items and after hedging)
         Core EPS                                               €5.94                                            ~€6.80                         +~14%

         Free Cash Flow
                                                               €4.7bn                                          ~€3-4bn

     1   Monsanto included since June 7 and assets divested to BASF included until August 2018, 2 not including portfolio divestitures

19   // Bayer // J.P. Morgan Milan Investor Forum 2019
Focus Areas

                      1                                                               2
                                           Target Delivery                                Crop Science
                                                 Deliver on operational targets             Integration of acquired business to
                                                                                              shape the future of agriculture

                      3                                                               4
                                           Pharmaceuticals                                Consumer Health
                                                 Further strengthening of pipeline          Drive performance improvement
                                                  and intensify external sourcing

                      5                                                               6
                                           Efficiency / Bayer 2022                        Portfolio Measures
                                                 Execute efficiency improvement             Execution of announced portfolio
                                                  program and realize synergies               measures for sharpened business
                                                                                              focus

20   // Bayer // J.P. Morgan Milan Investor Forum 2019
///////////

              Appendix
Pharma
     Innovative Medicines in Areas of High Unmet Medical Need

                                                                                                                                                                  Leading positions in
                    Therapeutic area focus                                                                   Emerging markets exposure
                                                                                                                                                               important therapeutic areas
                           Other
                                                                                                                                                  Emerging   Retinal Diseases
                                                                                                                                                  Markets
     Hematology                                                     Cardio-
                                                                    vascular                                                                    33%          Women´s Health
                                    Sales 2018                                                                                     Sales 2018
       Ophthal-
                                     €16.7bn
                                                                                                 Established
                                                                                                                                    €16.7bn
                                                                                                                                                             Radiology
        mology                                                                                      Markets
                                                                                                                                                             Cardiovascular
           Oncology
                                                          Women´s
                                                                                                                                                             Hematology
                            Radiology                     Health

                                                                                                                     Leading Brands

     Emerging markets include Latin America, Asia (w/o Japan, Australia, New Zealand), Africa and Middle East incl. Turkey, Eastern Europe

22   // Bayer // J.P. Morgan Milan Investor Forum 2019
Pharma
     Xarelto – Continued Growth of a Leading Anticoagulant

                                                                                    Most broadly indicated anticoagulant for use in venous
                                                                                    and arterial thromboembolic conditions
      Sales in €bn
                                                                             3.6
                                                                      3.3           A leading pharma brand with global sales of €5.2bn in
                                                                                    2018 incl. sales at Johnson & Johnson
                                                                2.9
                                       2.3                                          New CAD/PAD indication launching in EU and the US

             1.7                                                                    Peak sales potential: >€5.0bn1

                                                                                    Further growth driven by:
                                                                                     Under-served patient populations
                                                                                     Demographics
                                                                                     Shift from warfarin
            2014                      2015                    2016    2017   2018    New indications targeting patients currently not
                                                                                     treated with anticoagulants

     CAD: Coronary artery disease; PAD: Peripheral artery disease
     1 Ex-US sales plus royalty from J&J as reported by Bayer

23   // Bayer // J.P. Morgan Milan Investor Forum 2019
Pharma
     Eylea – A Leader in Retinal Diseases

                                                                                                                                               A leader in retinal diseases with global brand sales of
                                                                                                                                               €5.6bn in 2018 incl. sales at Regeneron1
         Sales in €bn                                                                                             2.2
                                                                                                                                               Approved for the treatment of 5 retinal diseases:
                                                                                         1.9                                                   wAMD, DME, BRVO, CRVO, mCNV
                                                               1.6
                                                                                                                                               Treat and extend dosing regimen with injection intervals
                                                                                                                                               of up to 12 weeks or more for wAMD
                                        1.2
                                                                                                                                               Peak sales potential: >€2.5bn2
              0.8
                                                                                                                                               Further growth driven by:
                                                                                                                                                    Continued generation of real-life experience in wAMD
                                                                                                                                                    across key markets and treatment-naïve patient
                                                                                                                                                    share gains
            2014                      2015                    2016                     2017                     2018
                                                                                                                                                    Market expansion in DME

     1Marketed by Bayer ex-US only; 2 As reported by Bayer
     wAMD: Wet age related macular degeneration; DME: Diabetic macular edema; BRVO: Branch retinal vein occlusion; CRVO: Central retinal vein occlusion, mCNV: Myopic choroidal neovascularization

24   // Bayer // J.P. Morgan Milan Investor Forum 2019
Pharma
     Late-stage Pipeline with Progress in Oncology

                                                         Larotrectinib                           Darolutamide                                Copanlisib
                                                                                                                                                                                      Finerenone                                 Vericiguat
                                                           (Vitrakvi)                              (Nubeqa)                                   (Aliqopa)

                     Indication                          TRK-fusion                              Prostate Cancer                           Lymphoma                                  Diabetic Kidney                          Chronic Heart
                                                         Cancer                                                                                                                      Disease                                  Failure

                                                         Launched in                             Launched in                               Launched in                               Phase III                                Phase III
                    Status                               the US / in                             the US (nmCRPC)                           the US                                                                             (HFrEF)
                                                         registration                            Phase III                                                                                                                    Phase II
                                                                                                                                           Phase III
                                                                                                 (mHSPC)                                                                                                                      (HFpEF)

                     Commercial
         €           Potential
                                                         PSP >€750m                              PSP €1bn                                 PSP €0.5bn                               PSP €1bn                                PSP ~€0.5bn

                                                         Clinical program                        Completed                                 May 2020e                                Apr 2020e                                 Jan 2020e
                     Clinical                                                                    (ARAMIS, nmCRPC)                                                                   (FIDELIO-DKD)                             (VICTORIA, HFrEF)
                     Completion                          ongoing                                                                           (CHRONOS-3)
                                                                                                 Aug 2022e                                 Sep 2021e                                June 2021e                                Dec 2019e
                                                                                                 (ARASENS, mHSPC)                          (CHRONOS-4)                              (FIGARO-DKD)                              (VITALY, HFpEF)

     NTRK: Neurotrophic receptor tyrosine kinase; nmCRPC: Non-metastatic castration resistant prostate cancer; mHSPC: Metastatic hormone sensitive prostate cancer; HFrEF: Heart failure with reduced ejection fraction; HFpEF: Heart failure with preserved ejection fraction;
     PSP: Peak sales potential

25   // Bayer // J.P. Morgan Milan Investor Forum 2019
Consumer Health
     A Leading Player Globally…

                                      Built up top leading position                        Strong positions in 7 out of Top 10 OTC markets

                                             NA OTC        OTC portfolio    Merck
           ASPIRIN                          business of     Sagmel &       Consumer
          introduced                         Sterling        Topsun          Care

             1899                              1994           2008          2014

        1978                               2005            2013            2014                  Top 10 OTC markets1
        Miles                            Roche            Steigerwald      Dihon      1.   USA                6. Russia
     Laboratories                       Consumer                                      2.   Germany            7. Italy
                                         Health
                                                                                      3.   Japan              8. Brazil                                       Top 5 position
                                                                                      4.   France             9. UK                                           Position outside
                                                                                      5.   China              10. India                                       of Top 5

26   // Bayer // J.P. Morgan Milan Investor Forum 2019
                                                                                                                  1   Bayer internal PARS database, 2018 OTC market size (value) ranking
Consumer Health
     …with a Fast Growing Nutritionals Category

                                                 Sales development                                                           Category focus1
     € bn; sales growth currency and portfolio adjusted

                               3.5%                                                                       Digestive Health                 Allergy/Cough & Cold
                                                          -1.7%              -0.7%                           ~15%                                  ~22%
                  6.1                         6.0                 5.9
                             +5.2%                                                   5.5
                  1.1                                     +3.3%
                                              1.1                 1.2        +5.9%
                                                                                     1.1
                             +3.2%
                                                          -2.8%
                                                                             -2.3%                   Pain/Cardio
                                                                                                        ~17%

                  5.0                         4.9                 4.7                4.3
                                                                                                                                                          Nutritionals
                                                                                                                                                            ~23%
                                                                                                          Dermatology
                                                                                                              ~22%
                 2015                        2016                 2017               2018
                                                              Nutritionals      Remaining Business

27   // Bayer // J.P. Morgan Milan Investor Forum 2019
                                                                                                                                                1   Excluding Derma Rx, Suncare, Footcare
Consumer Health
     Focused on Executing a Comprehensive Turnaround Plan

                                                             Accelerate                              Build high-
               Focus on                                                          Modernize           performing        Optimizing
                                                          growth-focused
            winning Portfolio                                                 Marketing & Sales    Product Supply    our Resources
                                                            Innovation

            Divest Rx Derma-                             Drive consumer-      Accelerating        Upgrade           Become leaner
            tology, Sun- and                             centric innovation   e-commerce          manufacturing     and more agile
            Footcare                                     Un-lock local        Moving from         network           Lower cost
            Accelerate core                              innovation           mass to precision   Lower the         base
            OTC range                                    Increase funding     marketing           portfolio
            Selected                                     and external         Stepping up         complexity
            bolt-on M&A                                  partnering           marketing
                                                                              and sales
                                                                              execution

28   // Bayer // J.P. Morgan Milan Investor Forum 2019
Consumer Health
     Our Strategic and Operational Roadmap
     Acceleration of growth and profitability through 2022
                                                                                                                                       2021 / 2022
                                                                                          2019 / 2020
                                                             2018
                                                                                                                          Acceleration phase
                                                         Setting the              Driving rigorous change
                                                         foundation
                                             Put in new leadership team         Execute portfolio choices            Drive higher innovation level
                                             Make portfolio choices             Right-size cost base                 Accelerate US growth momentum
      Strategic                              Initiate stricter cost control     Recover product supply               Capitalize on portfolio choices
      focus                                  Make necessary                     Regain momentum in APAC/EMEA         Realize full benefit of efficiency
                                             impairments                        Reset US cost base to strengthen     program
                                                                                margin

                                            Stabilize growth                  Return to growth                     Accelerate growth
      Growth
                                                                              Guidance 2019: ~1%                   Target 2022: 3-4%

                                            Stop margin erosion               Improve margins                      Accelerate margins
      Profitability                         through strict cost
                                                                              Guidance 2019: ~21%                  Target 2022: ~24%
                                            controls

29   // Bayer // J.P. Morgan Milan Investor Forum 2019                                                                       2022 targets at constant currencies, including portfolio measures
                                                                                                                                      EBITDA margin based on EBITDA before special items
Crop Science
     Shaping Agriculture to Benefit Farmers, Consumers and Our Planet
     As the Industry Leader Uniquely Positioned to Create Value and Pioneer Tailored Solutions

            Our Mission
                                                                                                        Seed & Traits

                 Deliver                                     Pioneer        Set new
               world-class                                  the digital   standards of
               innovation                                transformation   sustainability                 Tailored
                                                                                                        Solutions

                                                                                           Digital Ag                     Crop
                                     Deliver on operational commitments
                                                                                                                        Protection

             Tailored solutions are key to sustainably managing
             resources and improving productivity to feed a growing global population

30   // Bayer // J.P. Morgan Milan Investor Forum 2019
Crop Science
     The Established Leader in Crop Science
         Industry Leading Sales and Unmatched Investment in R&D

                                              Sales 2018 (€bn)                                                                                                          2018 Ag R&D Investment (€bn)1

                                                                                                                                                              2,3
         Bayer Crop Science1                                                                           19.3

              ChemChina Ag2                                                              14.4
                                                                                                                                                                                         1,2
                                                                                                                                                                                                                    1,1
                                                                                                                                                                                                                                               0,8
                          Corteva                                                  12.1

                        BASF Ag3                                       7.6
                                                                                                                                                       Bayer Crop                    Corteva              ChemChina Ag                    BASF Ag
                                                                                                                                                        Science
                              Seed & Traits                    AgChem                                                                                                                Seed & Traits                    AgChem

     1 The unaudited Pro-forma data are presented as if both the acquisition of Monsanto and the associated divestments had taken place as of January 1, 2018. Sales of Monsanto are presented in periods as per the Bayer fiscal year. One-time effects of business operations,
        the accounting for discontinued operations and the recognition and measurement of sales from certain business transactions have been adjusted in line with our accounting.
     2 Excludes non-agro business sales of ADAMA (nutritional supplements, aromatic products, industrial products)
     3 Includes BASF Ag Sales 2018 as reported plus €1.4bn (€2.027m sales FY 2018 excluding €586m sales from Jan ’18 until cut-off in Aug ’18) reported sales in 2018 from Bayer businesses sold to BASF. Split between Seed and CP businesses based on internal estimates.
     4 Exchange rate: FY 2018: ~1.18 USD/EUR
     5 Competitor Pro forma R&D cost split not available

31   // Bayer // J.P. Morgan Milan Investor Forum 2019
Crop Science
     Leading Position in All Major Categories
     Crop Science Market1 Currently Valued at ~€90bn

                         Corn                            Soybean                        Horticulture2                            Cereals                     Digital Farming               Total Ag Market: By Input

                                                                                                                                                                                         Total Market Value ~€90bn3

                                                                                                                                                                                       Fungicides            Seeds and
                                                                                                                                                                                                                 Traits
                                                                                                                                                                                                    16%

                                                                                                                                                           Climate                          13%               44%
                                                                                                                                                          FieldView
          ~€20bn                              ~€15bn                             ~€15bn                              ~€10bn                              Digital
                market1                             market1                             market1                            market1                       Platform                                   27%

          #1 position                         #1 position                       #1 position                         #1 position                        #1 position
                                                                                                                                                                                         Insecticides        Herbicides

     1Includes seeds, traits, crop protection chemistries and environmental science; does not include fertilizer
     2Includes fruits, vegetables, flowers and nuts
     3Total market of ~€90bn includes €5bn of Environmental Science; actual pie charts exclude that amount, as not relevant in these views (Source: Bayer Crop Science market model)
     Note: Reflecting Crop Science portfolio after divestments. Market sizes rounded to nearest €5bn. Source: Pro-forma calculations Bayer; Bayer Crop Science market model

32   // Bayer // J.P. Morgan Milan Investor Forum 2019
Crop Science
        Opportunity for Digital Transformation and Tailored Solutions
        Precise Resource Use and Innovation Required to Address Demand Growth, Field Variability and
        Increased Pressure on Ecosystems to Generate Sustainable Yield Improvements
                                                                                     Yield   =   f (g,e,p)

                     g = Genetics                                                  e = Environment                                p = Farming Practices
                                                                                 FieldView Yield Map
        Inherent yield                                          Climate and                            +75 bu/ac yield
                                                                                                                               40 decisions
          potential in                                          variability in                         difference              made over a
           the seed                                              soil types                            between red and        growing season
                                                                                                       green areas

     Opportunity from optimized yield equation                                                     Our evolution to capture the opportunity

     542 bu/ac vs. 175 bu/ac                                    138 bu/ac vs. 49 bu/ac
        national average1                                         national average1
                              2017 NCGA                                    2017 Monsanto
                              Corn Yield                                   Soybean Yield               Leading       Product      Digitally Informed   Tailored
                              Contest winner                               Contest winner              Products    Combinations       Offerings        Solutions

        1   USDA crop production summary report. Results not typical.

33      // Bayer // J.P. Morgan Milan Investor Forum 2019
Crop Science
     Next Growth Opportunity: Convergence of Leading R&D Platforms
     Continued Investment in Data Science and New Technologies are Driving Future Opportunity

                                                                                Strong
                                                                                discovery platform
                                                                                                                170,000                          #1 database
                                                                                                                microbes in collection
                                                                                for molecules with new                                           of grower and field trial
                                                                                mode-of-action and
                                                                                differentiated profiles         >10,000                          seed performance data

             Leading germplasm
                                                         Reach  >350m                                           microbes screened in vitro
                                                                                                                                                 in the industry

             libraries in corn,
                                                         acres annually             30-60 molecules             and in planta annually
                                                                                                                                                 90m paid acres
             soybean, cotton and
             vegetables                                  >20 new and next-
                                                                                    selected for field trials
                                                                                    annually
                                                                                                                80m acres                        in U.S.A., Brazil and
                                                                                                                of commercial                    Europe represents
                                                         generation traits in
             #1 field trial footprint                    development
                                                                                    Leader in formulation
                                                                                    technology
                                                                                                                products reached
                                                                                                                annually in row crops
                                                                                                                                                 industry’s leading
                                                                                                                                                 platform reach

                             Breeding                               Biotech                   Chemistry                  Biologicals                    Data Science

                                              Seeds & Traits                    +                      Crop Protection                       +         Digital Ag

                                   Best positioned to discover, combine and tailor solutions for growers
34   // Bayer // J.P. Morgan Milan Investor Forum 2019
Crop Science
     FieldView: The Leading Brand and Platform for Growers
     Significant Opportunity to Expand Digital Ag Footprint

                                   Global Paid Acres1                                            Growth Fueled by Platform Advantages

          #1                                                                                                         >60 Partners
                             Platform in the                           90m      Most Established,
                             Digital Ag space                                   scalable                             on the FieldView Platform
                                                                                digital farming infrastructure

                                                                60m
                                                                                                                     New Business Models
                                                                                #1 Brand                             enabling share of value and risk
                                                                                in digital Ag space2
                                                     >35m

                                                                                Largest Database
                                                                                of grower and field trial seed
                                                                                                                     >35 Next-Gen Projects
                                                                                                                     in the pipeline
                                     15m                                        performance data in the industry
                       5m

                      FY15           FY16                FY17   FY18    FY19    Global                               ~1bn Global Acre
                                                                       Target   distribution footprint established   Opportunity for Corn, Soybean, Wheat3

     1   Internal estimates
     2   2018 Brand Health Monitor
     3   Harvested acres – USDA FAS 2018-10-11, ex China

35   // Bayer // J.P. Morgan Milan Investor Forum 2019
Crop Science
     Leadership and Innovation Drive Above Market Sales Growth Target
     Target Above Market Sales Growth from 2018 to 2022 and >30% EBITDA Margin by 20223,4

                                                              8%                               Other                                                                               Key Sales Growth Drivers
                                                              3%                               Vegetable Seeds
                                                              5%                               Environmental Science
                                                              7%                               Insecticides                                               Deliver annual germplasm refresh across the seeds
                                                                                                                                                          portfolio to capture price and share gains
                                                             12%                               Soybean Seed & Traits
                                                                                                                                                          Continue penetration of Roundup Ready Xtend crop
                                                                                                                                                          system; transition to XtendFlex soybeans with
     €19.3bn1                                                14%                               Fungicides
                                                                                                                                                          expected U.S.A. launch in 20202
     Pro-Forma Sales
                                                                                                                                                          Continue penetration of Intacta RR2 PRO soybeans;
                                                             25%                               Corn Seed & Traits                                         transition to Intacta 2 Xtend with expected launch in
                                                                                                                                                          South America in 20212

                                                                                                                                                          Increase crop protection sales on the >400m acre
                                                                                                                                                          seed & trait footprint; FieldView platform an enabler
                                                             26%                               Herbicides                                                 Maximize sales synergies

     1 The unaudited Pro-forma data are presented as if both the acquisition of Monsanto and the associated divestments had taken place as of January 1, 2018. Sales of Monsanto are presented in periods as per the Bayer fiscal year. One-time effects of business operations,
     the accounting for discontinued operations and the recognition and measurement of sales from certain business transactions have been adjusted in line with our accounting. Due to this simplified procedure, they explicitly do not reflect sales according to IFRS or IDW RH
     HFA 1.004, meaning they have not been audited. Amounts as per the 2018 annual report.
     2 Pending regulatory approvals

     3 EBITDA margin based on EBITDA before special items
     4 2022 targets at constant currencies, not including portfolio measures

36   // Bayer // J.P. Morgan Milan Investor Forum 2019
FY 2019 Guidance

                                                      Sales 2018                                EBITDA-margin 2018                  Sales Growth 2019             EBITDA-margin
                                                                                                       (before special items)             (cpa2)                      2019
                                                                                                                                                                   (before special items)

                                                                                                                                                 (at constant currencies)

         Crop
                                                          €14.3bn1                                               18.6%                     ~4%                              ~25%
         Science

         Pharma                                            €16.7bn                                               33.4%                     ~4%                              ~34%

         Consumer
                                                            €5.5bn                                               20.1%                     ~1%                              ~21%
         Health
         Animal
                                                            €1.5bn                                               23.9%                     ~4%                              ~24%
         Health
     1   Monsanto included since June 7 and assets divested to BASF included until August 2018; 2 currency and portfolio adjusted

37   // Bayer // J.P. Morgan Milan Investor Forum 2019
Group
     FY 2018 – Sales Breakdown by Region

                                           24%
                                                         Europe / Middle                            North America     34%
               39%                                                                                                          Consumer 42%
                           Pharma                        East / Africa
                          €16,746m                                                                                            Health
                            +3%                                                                                              €5,450m
                                                                                                                               -1%
                        6%                31%                                                                           11%
                                                                                              29%                             13%
                                                                           36%
                                                                                   Group
                                                                                  €39,586m
                                                                                    +5%

                  26%                                                                                                  27%
                                              33%                                            20%                           Animal
                            Crop
                                                                                 15%                                       Health
                                                                                                                                    42%
                           Science
                          €14,266m                                                                                        €1,501m
                            +6%                                                                                       10%   +1%

                    28%                  13%
                                                         Latin America                               Asia / Pacific          21%

     in € million; Δ% yoy, Fx & portfolio adj.

38   // Bayer // J.P. Morgan Milan Investor Forum 2019
Bayer 2022:
Delivering Value
Creation
        ///////////

            J.P. Morgan
       Milan Investor Forum
       September 26th, 2019
               Milan

Oliver Luckenbach & Simone Moerchen
Bayer AG
You can also read