COST OF PRODUCTION - DEPARTMENT OF AGRICULTURE MINISTRY OF AGRICULTURE AND FORESTS
←
→
Page content transcription
If your browser does not render page correctly, please read the page content below
COST OF PRODUCTION
                 FOR
FIELD AND HORTICULTURE CROPS IN BHUTAN

  DEPARTMENT OF AGRICULTURE
   MINISTRY OF AGRICULTURE AND FORESTS

               June 2020

                    i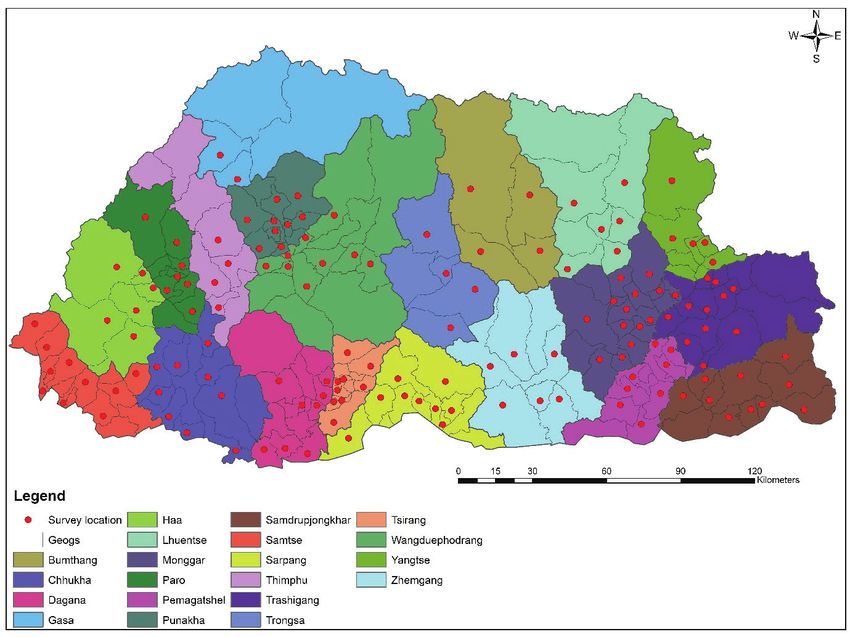
Authors:
   1. Mr. Wangda Dukpa, Chief Agriculture Officer, ARED, DoA,Thimphu.
   2. Mr. Tirtha Bdr. Katwal, Program Director, ARDC Yusipang.
   3. Mrs. Phub Dem, Principal Agriculture Economist, PPD, MoAF, Thimphu.
   4. Mr. Kinley Tshering, Principal Horticulture Officer, APD, DoA, Thimhu.
   5. Mr. Deepak Rai, Specialist III, NSC, Paro
   6. Mrs. Tashi Yangzom, Dy. Chief Planning Officer, PPD, MoAF, Thimphu
   7. Mr. Tshering Tobgay, Sr. Agriculture Officer, ARED, DoA, Thimphu.
   8. Mr. Ngawang, Agriculture Officer, ARED, DoA, Thimphu.
   9. Mr. Jimba Rabgyal, Sr. Horticulture Officer, ARDC Yusipang.
   10. Mr. Dawa Zangpo, ICT Officer, ICTD, MoAF, Thimphu
   11. Mr. Tshering Tashi, Agriculture Officer, ARDC Samtenling
   12. Mr. Norbu, Sr. Mushroom Supervisor, NMC, Thimphu.

© DoA 2020
All rights reserved. No part of this book may be reproduced in any form without prior
permission from the Department of Agriculture, Ministry of Agriculture and Forests,
Royal Government of Bhutan.
ISBN-978-99936-957-6-9

Published by:
Agriculture Research and Extension Division,
Department of Agriculture, Ministry of Agriculture and Forests,
Royal Government of Bhutan, Thimphu.
Telephone No. 02 322228 or 02 331316
Fax No. 02 323562

                        ISBN-978-99936-957-6-9

                                           ii
COST OF PRODUCTION
FOR
FIELD AND HORTICULTURE CROPS IN BHUTAN
DEPARTMENT OF AGRICULTURE
MINISTRY OF AGRICULTURE AND FORESTS
June 2020
iiiiv
1.   FOREWORD

The Department of Agriculture, Ministry of Agriculture & Forests (MoAF) is pleased
to bring out the 2nd edition of “Cost of Production for Field and Horticulture Crops in
Bhutan 2020”. The current publication is a revision of the previous document titled
“Cost of Production of Field Crops and Horticulture Crops grown in Bhutan 2017”.

This publication includes more number of crops, bigger sample size, larger area cov-
erage, regional representation and good respondent representation done through a
purposive two stage stratified sampling methodology. The analysis is done at both the
national and regional level. The purpose of having both the regional and the national
level cost of production is to ensure evidence-based decision making for farmers/pro-
ducers, planners, policy makers, financial institutions, investors and youths interested
in taking up agriculture farming.

The Department of Agriculture acknowledges the support of FAO Bhutan and FSAPP
Project for the support extended in bringing out this publication. Further, this publica-
tion would not have been possible without the unwavering support of all the ARDCs
and the task force members involved.

The Department of Agriculture is pleased to share copies of the document with all
relevant agencies and the electronic copy of the document is also uploaded on our
website (www.doa.gov.bt). We are hopeful that this document would be of use to
various users.

With best regards,

Kinlay Tshering (Ms.)

DIRECTOR

                                            i
2. ABBREVIATIONS AND ACRONYMS
APD : Agriculture Production Division
ARCM : Agriculture Research Coordination Meeting
ARDC : Agriculture Research and Development Centre
ARED : Agriculture Research and Extension Division
CoP : Cost of Production
DoA : Department of Agriculture
EOC : Effective Operating Cost
FAO : Food and Agriculture Organization
FSAPP : Food Security and Agriculture Productivity Project
FYM : Farm Yard Manure
HH : Household
ICTD : Information and Communication Technology Division
MAP : Medicinal and Aromatic Plant
MAPS : Medicinal Aromatic Plant and Spices
MoAF : Ministry of Agriculture and Forests
MSP : Minimum Support Price
NMC : National Mushroom Centre
NSC : National Seed Centre
OC : Opportunity Cost
PPD : Policy and Planning Division
TFOC : Total Fixed Operating Cost
TOC : Total Operating Cost
ToT : Training of Trainers
TVOC : Total Variable Operating Cost
ii3. Table of Contents
FOREWORD............................................................................................................................ i
ABBREVIATIONS AND ACRONYMS................................................................................. ii
1. INTRODUCTION............................................................................................................ 1
1.1. Objectives of the study............................................................................................... 2
2. STUDY FRAMEWORK AND METHODOLOGY......................................................... 3
2.1. Sampling procedures.................................................................................................. 3
2.2. Data collection, compilation and analysis................................................................. 5
3. DEFINITIONS AND CONCEPTS OF COST OF PRODUCTION................................. 8
4. COST OF PRODUCTION: National level..................................................................... 10
4.1. Cereal....................................................................................................................... 10
4.1.1. Paddy................................................................................................................. 10
4.1.2. Other cereal....................................................................................................... 10
4.2. Pulses and grain legumes..........................................................................................11
4.3. Oilseed......................................................................................................................11
4.4. Vegetable.................................................................................................................. 12
4.4.1. Solanaceous vegetable...................................................................................... 12
4.4.2. Pod vegetable.................................................................................................... 12
4.4.3. Leafy vegetable................................................................................................. 12
4.4.4. Bulb vegetable................................................................................................... 12
4.4.5. Cole crop........................................................................................................... 12
4.4.6. Cucurbit............................................................................................................. 13
4.4.7. Stem vegetable.................................................................................................. 13
4.4.8. Root and tuber................................................................................................... 13
4.5. Mushroom................................................................................................................ 14
4.5.1. Shiitake.............................................................................................................. 14
4.5.2. Oyster................................................................................................................ 14
4.6. Spices....................................................................................................................... 14
4.7. Fruit crop.................................................................................................................. 15
4.7.1. Temperate fruit.................................................................................................. 15
4.7.2. Sub-tropical fruit............................................................................................... 16
4.8. Plantation crop............................................................................................................. 16
4.9. Medicinal and Aromatic Plants................................................................................ 17
5. COST OF PRODUCTION- Regional level.................................................................... 18
5.8. Cereals...................................................................................................................... 18
iii5.8.1. Maize................................................................................................................. 18
5.8.2. Quinoa............................................................................................................... 18
5.8.3. Buckwheat......................................................................................................... 18
5.9. Vegetables................................................................................................................ 20
5.9.1. Asparagus.......................................................................................................... 20
5.9.2. Chilli................................................................................................................. 20
5.9.3. Beans................................................................................................................. 20
5.9.4. Cauliflower........................................................................................................ 20
5.9.5. Broccoli............................................................................................................. 21
5.9.6. Cabbage............................................................................................................. 21
5.9.7. Carrot................................................................................................................ 21
5.9.8. Onion................................................................................................................. 21
5.9.9. Tomato.............................................................................................................. 22
5.10. Mushroom............................................................................................................. 22
5.10.1. Shiitake mushroom........................................................................................ 22
5.10.2. Oyster mushroom.......................................................................................... 23
5.11. Spices.................................................................................................................... 23
5.11.1. Cardamom..................................................................................................... 23
5.11.2. Ginger............................................................................................................ 23
5.12. Fruits..................................................................................................................... 24
5.12.1. Mandarin........................................................................................................ 24
5.12.2. Banana........................................................................................................... 24
5.12.3. Mango............................................................................................................ 24
5.12.4. Avocado......................................................................................................... 24
5.12.5. Persimmon..................................................................................................... 25
5.12.6. Watermelon.................................................................................................... 25
6. ANNEXURE................................................................................................................... 26
6.1. Cost of production formulation process and timeline................................................. 26
6.2. List of Enumerators..................................................................................................... 27
6.3. List of specialists, commodity coordinators and focal officials consulted.................. 29
6.4. Questionnaire sample.................................................................................................. 23
Bibliography.......................................................................................................................... 44
iv1. INTRODUCTION
In any agriculture enterprise, estimating the “Cost of Production” (CoP) has been
historically used as one of the key parameters for making effective policies. The
information on CoP is essential for making several effective and efficient decisions
on a commodity, determining the gross and net returns from cultivating a specific
commodity to assess and improve performance of a farm operation and for determining
the minimum support prices by the government. CoP indicates how well a commodity
is doing and enables farmers or producers to evaluate how efficiently resources are
being used in the farm and how the production will respond to specific changes in
crop production and management. The CoP data enables researchers and extension to
advice farmers and agriculture entrepreneurs on different farm management decisions
such as farm efficiency, income and profitability. In Bhutan, several attempts have been
made to determine the CoP but a comprehensive CoP for agriculture commodities is
not yet in place for both regional and national level.
The 2nd Agriculture Research Coordination Meeting (ARCM) held in Phuntsholing in
January, 2019 recommended the immediate need for the revision of the existing cost
of production for agriculture commodities. The ARCM proposed that the CoP should
be established for both regional and national level. The cost of production data will be
useful for crop insurance scheme, buy-back proposals or for Minimum Support Price
(MSP), policy and planning, valuing the outputs of agriculture enterprises, support
marketing aspects of agriculture commodities, priority sector lending and for availing
agriculture loans.
Therefore, the Department of Agriculture (DoA) formed a task-force led by Agriculture
Research and Extension Division (ARED) that comprised relevant officials from
Policy and Planning Division (PPD), Agriculture Research and Development Centers
(ARDCs), National Seed Center (NSC), National Mushroom Centre (NMC) and
Agriculture Production Division (APD). The first meeting of the taskforce was
held on 11 April 2019 to finalize the list of commodities, calendar of task for CoP,
data collection format and sampling method to be adopted. Based on the first task-
force meeting, the data collection format was developed for field crops, horticulture
crops, oil seed, MAPS and mushroom. A Training of Trainers (ToT) workshop for
finalization of cost of production survey format, sampling procedures, familiarization
of data collection format and its synchronization in Kobo Toolbox was organized by
ARED, DoA. The ToT was held in Paro from 13 -17 May 2019 and was attended by
the taskforce members and representatives from all the ARDCs.
11.1. Objectives of the study
The main objective of the study is to revise, update and expand the scope of the exist-
ing cost of production for major agriculture and horticulture commodities at national
and regional levels.
The specific study objectives are:
●● To generate data on cost of production for major agriculture and horticulture com-
modities for policy and planning decisions including formulation of the MSP, buy
back mechanisms, compensation, crop insurance and access to credit facilities.
●● To generate the region specific and national data on cost of production for major
agriculture and horticulture commodities.
●● To provide baseline data on cost of production of key commodities for interested
entrepreneurs and agro-based enterprises.
22. STUDY FRAMEWORK AND METHODOLOGY
2.1. Sampling procedures
This CoP is a national level study and dzongkhags were sampled based on the volume
of production for each commodity based on the Agriculture Statistics 2017. A total
of eight dzongkhags and 16 gewogs were covered by the CoP survey. This study also
covered all the major agriculture commodities that includes cereals, oilseed, pulses
and grain legumes, fruits, vegetables, medicinal and aromatic plants, spices, roots and
tuber crops, mushrooms and plantation crops. The details of dzongkhags, crops and
total sample households covered by the CoP survey are presented in Table 1.
Table 1. Crops and number of samples by region
Categories Number of samples Total
ARDC ARDC ARDC ARDC
Yusipang Wengkhar
Bajo Samtenling
Cereals 466 351 669 708 2194
Pulses and grain 29 187 249 453 918
legumes
Oilseed 7 82 189 350 628
Vegetables 807 863 1311 1891 4872
Roots and tubers 104 152 307 286 849
Fruit crops 186 585 708 1461 2940
Plantation crops 1 50 125 51 227
Mushroom 60 29 47 49 185
Spices 74 168 250 253 745
MAP 41 0 23 116 180
Total 1775 2467 3878 5618 13738
A purposive two stages stratified sampling method was adopted to derive the household
samples for enumeration. At the first stage, two dzongkhags with maximum production
for each commodity were derived for all the four regions using Agriculture Statistic
2017. From the selected dzongkhags, two gewogs with highest production for a given
commodity was selected making a total of four sample gewogs for each commodity
in the region. In the second stage, 5% of the major growers from each of the gewogs
were taken as the sample households for the survey (Figure 1).
3Figure 1: Dzongkhags and gewogs surveyed
CoP data for commodities which are new and not abundantly cultivated by farmers
were collected from ARDCs, commercial enterprises or specific farmers growing
that commodities. The sample households for MAP and mushroom were selected by
ARDC Yusipang and National Mushroom Center (NMC) respectively following the
same sampling procedure described above.
As purposive sampling was followed, enumerators were given the liberty to choose the
final household (HH) samples within the gewogs selected for particular commodity
covering 5% of total HHs of major growers of the particular gewog. The sample
households involved those growing the survey commodities with adequate knowledge
on that particular crop. The general selection criteria of sample households for different
commodities are as indicated in Table 2.
4Table 2. Commodities and criteria for sampling of households
Commodity Sample household selection criteria
Fruit crops Bearing orchard (minimum of 5 years for perennial
crops)
Minimum of 0.25 acres under cultivation
Cardamom Bearing orchard (minimum of 5 years)
Minimum of 0.25 acres under cultivation
Vegetables, ginger and tur- Minimum of 0.10 acres under cultivation
meric
Field crops and oilseed Minimum of 0.25 acres under cultivation
Shiitake mushroom Fruiting billets (minimum of 3 years old)
Oyster mushroom Fruiting condition
Plantation crops Data from on-farm and on-station
MAP Data from commercial growers
2.2. Data collection, compilation and analysis
The cost of production parameters for each of the commodities were developed by
taskforce members in collaboration with relevant national commodity focal officers and
commodity coordinators. The cost of production parameters for all the commodities
were reviewed and finalized during the Training of Trainers (ToT) workshop. The
data collection format was then synchronized and uploaded in Kobo Toolbox with
assistance from Information and Communication Technology Division (ICTD) of the
Ministry of Agriculture and Forests (MoAF). The survey enumeration was done in
four regions led by the Agriculture Research and Development Centers (ARDCs).
Researchers from ARDCs were trained on the enumeration process during the ToT
organized in Paro. A CoP focal officer was appointed in each ARDC to lead and
coordinate the survey at the regional level. The researchers who attended the ToT
further trained other researchers identified to undertake the survey. The data collection
survey for the cost of production was carried out by the research officials from the
four ARDCs and NMC. Data collection was conducted using Apps through Smart
Tablets to ensure efficient use of time and resources. Recall method was used by
the enumerators to collect data from the farmers or growers. Compilation of data
and analysis was done using MS excel. Expert opinion and views from the national
commodity coordinators were sought on the analysis of the primary data collected from
the field. This was carried out to remove outliers, validate field data and triangulate
the data sets in order to ensure quality of data.
5For the perennial crops like fruits, cardamom, asparagus, shiitake mushroom and
medicinal plants, the total cost incurred starting from first year till the economic
yield bearing of the specific crops were taken into consideration. The opportunity or
alternative cost (OC) for various inputs like seeds, farm household labour and FYM
were monetized based on the prevailing market prices.
Costs were calculated by means of cross sections in time, in which fixed capital,
such as buildings/stores, sheds, fencing, machineries and equipment, etc. participate
in the form of flow (straight line depreciation), not in the form of stock (purchase of
capital goods). Unit costs were calculated, corresponding to total costs divided by
productivity (Kg per acre) for each input type every year.
a) Analysis of annual crops
Since all cereals and vegetables (with exception of asparagus) are produced annually,
the cost of production is calculated based on the annual expenditure incurred divided
by the total yield.
For perennial crops like asparagus, most of the higher investment costs like fencing,
land preparation and development, seeds/seedling costs are incurred in the initial
years of establishment. In the second and subsequent years, the costs are reduced and
remains similar after a certain year. In the initial year or two, the yield is very low and
starting from the 3rd year onwards yield reaches its prime and gives good yield for a
period of 7 to 8 years. Therefore, for calculating the cost of production of vegetables
like asparagus the total discounted costs incurred for the entire 7 to 8 years is taken
into account and is divided by the total production that is expected for this entire
duration. The rate of interest used to calculate the discounted total costs is @14%
which is the highest interest rate currently prevailing in the financial market.
b) Analysis of fruit crops
The production costs for fruit trees were calculated based on the economic costs of
fixed and variable production factors as well as on operating costs. In other words,
calculations included: Effective Operating Cost (EOC), which is the sum of input
and operations expenses; Total Variable Operating Cost (TVOC), which is the sum of
EOC and other expenses incurred during the production period, such as food for hired
labour etc., Total Fixed Operating Cost (TFOC), which included expenses such as land
tax, interest on loan, insurance, depreciation (of the irrigation system, machineries,
fencing, equipment etc.,) and land leasehold.
6As fruit trees span over a period of 20 - 25 years since its establishment, the first initial
4 - 5 years was considered as the period of orchard development, followed by an
additional period of about 15-20 years with fruiting attaining its full production in about
10-15 years. The expenses incurred in the initial years of orchard establishment is the
highest, with certain maintenance and management costs incurred in the subsequent
years. On the contrary, there is no harvest in the initial 3-4 years as most fruit trees
start fruiting in its 4th or 5th year onwards and reach prime yielding stage from the
10th - 20th year after which the yield starts to decline. It is important to point out that
despite its higher cost incurred during the initial period of establishment, orchard
when compared with other agricultural commodities involves lesser investment and
input costs over the years.
73. DEFINITIONS AND CONCEPTS OF COST OF PRODUCTION
Estimating the cost of production for agriculture commodities involves estimating
all economic costs and revenues associated with the production of that commodity1.
All the inputs used for production should be measured and monetized, whether they
are purchased or produced by the farmer. Inputs include seed, fertilizers, farm yard
manure, irrigation, hiring of machineries, draught power and pesticides. The labour
required for production whether paid out, family labour or labour exchanged should
also be valued in terms of money by considering the local labour wage rate of sample
area.
For the estimation of fixed costs, the depreciation value of any fixed asset was
considered during costing. The depreciation cost was calculated using the straight-
line method as:
If a machinery/equipment’s lifespan is 10 years, then the depreciation cost that is
derived from the above formula has to be used annually for the 10 years period.
In this study two broad categories of cost are used to compute the Cost of Production.
These include variable and fixed costs.
1. Variable Cost - are the costs of different farm inputs used in production of a
given commodity valued at market price at that particular time. The different
inputs may include cost of seed, manures, fertilizers, irrigation, and plant
protection chemicals, hire charge of draught power, machineries, and value of
farm labour and other consumables. Generally, the variable cost depends on the
volume of inputs required to produce a certain quantity of produce. These costs
vary with production and one can increase or decrease the cost with the use of
inputs.
2. Fixed Cost - are those that do not vary with size of enterprise and have no
bearing upon decisions to increase or decrease production. It includes building
cost, machinery cost, irrigation equipment, fencing costs, tools and implements.
For ease of calculation, a straight-line depreciation method has been applied for
all the fixed costs involved.
3. Total Cost – is the sum of Total Variable Cost and Fixed Cost.
4. Cost of Production – refers to the total sum of money needed to produce one
unit of a particular commodity. It is calculated as:
1 Land and electric fencing cost are excluded in this report.
8The cost of production is also referred to as the equilibrium price that corre-
sponds to the quotient between total operating cost and total physical produc-
tion, i.e., the minimum price the product must fetch for the income to cover all
operating expenses and profitability index, which is equal to the proportion of
gross income that constitutes available resources (operating profit).
94. COST OF PRODUCTION: National level
4.1. Cereal
4.1.1. Paddy
Sl. No. Crop name Expenditure Yield Cost of Production
(Nu/Kg)
(Nu/acre) (Kg/acre)
1 Low altitude paddy 52721 1401 38
2 Mid altitude paddy 68404 1672 41
3 High altitude paddy 93931 2416 39
The low altitude paddy incurs the lowest expenditure with an estimated Nu. 52721/
acre and yield of 1401 Kg/acre. The mid altitude paddy has the highest cost of
production at Nu. 41/Kg with an estimated total cost of Nu. 68404/acre and yield of
1672 Kg/acre. Although the high-altitude paddy incurs the highest total expenditure
of Nu. 93931/acre, it has the highest yield of 2416 Kg/acre, the cost of production is
therefore low.
4.1.2. Other cereal
Sl. No. Crop name Expenditure Yield Cost of Production
(Nu/Kg)
(Nu/acre) (Kg/acre)
1 Quinoa 22622 300 75
2 Millet 28123 518 54
3 Wheat 32318 695 47
4 Barley 26872 608 44
5 Buckwheat 25086 717 35
6 Maize 26285 1386 19
Amongst the other cereals, the highest cost of production is incurred for quinoa at
Nu.75/Kg as it has the lowest total yield of 300 Kg/acre. Millet has the second highest
cost of production at Nu. 54/Kg followed by wheat, barley and buckwheat. Maize has
the lowest cost of production at Nu.19/Kg as it has the highest yield amongst all other
cereals at 1386 Kg/acre.
104.2. Pulses and grain legumes
Sl. No. Crop name Expenditure Yield Cost of Production
(Nu/Kg)
(Nu/acre) (Kg/acre)
1 Rajma bean 24673 432 57
2 Lentil 16605 300 55
3 Soybean 21738 400* 54
4 Urd/Mung bean 20063 400 50
* Yield of soybean reflected as 400kg/acre is when it is cultivated as a sole crop and not intercropped
The highest cost of production among pulses and grain legumes is for rajma beans
at Nu. 57/Kg since it incurs the highest expenditure. Other pulses and grain legumes
like lentil, soybean and Urd/Mung beans have cost of production ranging from Nu.
50 to 55/Kg.
4.3. Oilseed
Sl. No. Crop name Expenditure Yield Cost of Production
(Nu/Kg)
(Nu/acre) (Kg/acre)
1 Mustard 15865 313 51
2 Sunflower 19386 300 65
3 Groundnut 42727 495 86
4 Perilla 10059 401 25
5 Niger 12308 131 94
Amongst the oilseeds, the lowest cost of production is for perilla at Nu. 25/Kg fol-
lowed by mustard at Nu. 51/Kg and sunflower at Nu. 65/Kg. The highest cost of
production is for niger at Nu. 94/Kg because it has the lowest yield of 131 Kg/acre.
Groundnut has the second highest cost of production at Nu. 86/Kg since the total ex-
penditure incurred is the highest amongst all oilseeds.
114.4 Vegetable
4.4.1. Solanaceous vegetable
Sl. No. Crop name Expenditure Yield Cost of Production
(Nu/Kg)
(Nu/acre) (Kg/acre)
1 Chili 80790 2155 37
2 Tomato 50953 1424 36
3 Eggplant 37498 1050 36
4.4.2. Pod vegetable
Sl. No. Crop name Expenditure Yield Cost of Production
(Nu/Kg)
(Nu/acre) (Kg/acre)
1. Beans 46622 1370 34
2. Pea 35566 1160 31
3. Okra 19579 658 30
4.4.3. Leafy vegetable
Sl. No. Crop name Expenditure Yield Cost of Production
(Nu/Kg)
(Nu/acre) (Kg/acre)
1 Spinach 33476 1189 28
2 Mustard green 33720 1249 27
4.4.4. Bulb vegetable
Sl. No. Crop name Expenditure Yield Cost of Production
(Nu/Kg)
(Nu/acre) (Kg/acre)
1 Onion 31309 935 33
2 Garlic 66956 680 98
4.4.5. Cole crop
Sl. No. Crop name Expenditure Yield Cost of Produc-
tion (Nu/Kg)
(Nu/acre) (Kg/acre)
1 Cauliflower 66784 1887 35
2 Broccoli 47226 1820 26
3 Cabbage 59393 3320 18
124.4.6 Cucurbit
Sl. No. Crop name Expenditure Yield Cost of Production
(Nu/Kg)
(Nu/acre) (Kg/acre)
1 Bitter gourd 40208 2500 16
2 Cucumber 32536 3000 11
3 Pumpkin 27550 3000 9
4.4.7. Stem vegetable
Sl. No. Crop name Expenditure Yield Cost of Production
(Nu/Kg)
(Nu/acre) (Kg/acre)
1 Asparagus 620 80
4.4.8. Root and tuber
Sl. No. Crop name Expenditure Yield Cost of Production
(Nu/Kg)
(Nu/acre) (Kg/acre)
1 Potato 92313 4553 20
2 Radish 32340 2416 13
3 Carrot 29718 1380 22
4 Turnip 32619 5999 5
5 Cassava 19407 985 20
6 Sweet potato 20098 1211 17
7 Yam 28822 2500 12
8 Ground apple 110000 8000 14
The highest cost of production is for garlic at Nu. 98/Kg followed by asparagus at Nu.
80/Kg. Amongst other vegetables, the cost of production ranges between Nu. 30-40/
Kg for chilli, tomato, eggplants, cauliflower, beans, onion, pea and okra. Vegetables
with CoP ranging from Nu. 20 - 29/Kg are spinach, mustard green, broccoli, carrot
and potato. The lowest cost of production for vegetables are pumpkin with Nu. 9/Kg
and turnip at Nu.5/Kg.
134.5. Mushroom
4.5.1. Shiitake
Sl. No Scale Expenditure Yield Cost of Production
(Nu) (Kg) (Nu/Kg)
1 Large (5000 billets )2
589489 6000 98
2 Medium (3000 billets) 376276 3600 105
3 Small (1000 billets) 166951 1200 139
4.5.2. Oyster
Sl. No Scale Expenditure Yield Cost of Production
(Nu/Kg)
(Nu) (Kg)
1 Large (1000 bags )
3
74138 1320 56
2 Medium (500 bags) 42233 660 64
Small (100 bags) 12876 132 98
3
The cost of production for shiitake and oyster mushrooms were calculated based on
the quantity of cultivation as large, medium and small scales. As shown in the above
tables, the expenditure increases as the scale of cultivation increases whereas the
cost of production decreases. For large scale shiitake mushroom cultivation of 5000
billets, the cost of production is Nu.98/Kg and expenditure is Nu.589489 whereas
cost of production of small-scale of 1000 billets is Nu.139/Kg and expenditure are
Nu.166951. Similarly, for large scale oyster mushroom cultivation of 1000 plastic
bags, the cost of production is Nu. 56/Kg and expenditure is Nu.74138 whereas small
scale of 100 plastic bags, the cost of production is Nu. 98/Kg and expenditure is Nu.
12876.
4.6. Spices
Sl. No. Crop name Expenditure Yield Cost of Production
(Kg/acre) (Nu/Kg)
(Nu/acre)
1 Cardamom 46965 130 361
2 Ginger 93279 2095 45
3 Turmeric 105,064 3400 31
2 Yield: 1.2 Kg per billet
3 Yield 1.3 Kg per bag
14Amongst the three spices crops, the highest cost of production is for cardamom (dried
yield) at Nu.361/Kg which is mainly due to the low yield of 130 Kg/acre against
the high expenditure of Nu.46965/acre. Ginger’s cost of production is calculated at
Nu.45/Kg although it has one of the highest expenditures of Nu.93279/acre. This is
due to its high yield of 2095 Kg/acre. Turmeric with cost of production of Nu. 31/Kg
is the lowest among all spices which is mainly due to its very high productivity of
3400kg/acre.
4.7 Fruit crop
4.7.1 Temperate fruit
Sl. No. Name Expenditure Yield Cost of Production
(Nu/Kg)
(Nu/acre) (Kg/acre)
1 Apple 77031 2818 27
2 Persimmon 61957 2975 21
3 Apricot 53385 1870 29
4 Pear 72374 4381 17
5 Plum 64546 4256 15
6 Peach 61831 3528 18
7 Walnut 42735 2159 20
8 Kiwi 72239 2419 30
9 Hazelnut 32585 1215 27
Amongst the temperate fruit crops, kiwi has the highest cost of production at Nu.
30/Kg due to its high expenditure and low yield. The cost of production of other
temperate fruit crops ranges from Nu.15-29/Kg with plum as the lowest at Nu.15/Kg.
154.7.2 Sub-tropical fruit
Sl. No. Name Expenditure Yield Cost of Production
(Nu/Kg)
(Nu/acre) (Kg/acre)
1 Mandarin 69738 2174 32
2 Mango 50234 1900 26
3 Banana 81092 6272 13
5 Litchi 44120 1826 24
6 Watermelon 80406 3,038 26
7 Papaya 141945 10478 14
8 Jackfruit 33770 2754 12
9 Passion fruit 68030 5454 12
10 Guava 41988 2410 17
11 Pomegranate 65768 2298 29
12 Avocado 50355 1974 26
13 Pineapple 124862 5066 25
Amongst the sub-tropical fruit crops, mandarin, mango, avocado, pomegranate,
watermelon, pineapple and litchi have the high cost of production ranging from Nu.24-
32/Kg. Papaya and pineapple have highest expenditure of Nu.141945 and Nu. 124862
per acre, respectively compared to other fruit crops as the seedlings requirement are
very high. However, CoP of papaya is low as yield per acre is very high at 10478 Kg/
acre. The rest of the sub-tropical fruits such a guava, passion fruit, jackfruit, banana,
papaya and ground apple have lower cost of production ranging from Nu.12-17/Kg.
4.8. Plantation crop
Sl. No Crop Name Expenditure Yield Cost of Production
(Nu/Kg)
(Nu/acre) (Kg/acre)
1 Green tea 141457 459 308
2 Coffee 47532 1440 33
3 Areca nut 49837 3417 15
Amongst the plantation crops, green tea (fresh leaves) has the highest cost of
production as well as expenditure at Nu. 308/Kg and Nu.141457/acre, respectively.
The second highest cost of production is coffee (fresh berry) at Nu.33/Kg followed by
areca nut (fresh nut) at Nu. 15/Kg.
164.9 Medicinal and Aromatic Plants
Sl. No. Crop name Expenditure Yield Cost of Production
(Nu/Kg)
(Nu/acre) (Kg/acre)
1 Goned 61100 200 306
2 Zanthoxyllum 34523 218 158
3 Tiyangku 65206 350 186
4 Ruta 159886 2000 80
5 Manu 166000 2000 83
Medicinal and Aromatic Plants are well known for their high value and medicinal
benefits. Some of the MAP are annual crops while others are perennial. For annual
MAP crops, the annual cost and yield are taken into account whereas for perennial
the total costs incurred and the total years of fruiting/yield are averaged and used to
calculate the cost of production.
For MAP crops, the CoP is calculated based on the dried yields. Amongst MAP, ruta
and manu has the lowest cost of production at Nu. 80/Kg and Nu.83/Kg respectively
whereas the others have cost of production ranging from Nu.158/ Kg to Nu.306/Kg.
175. COST OF PRODUCTION- Regional level
Apart from the national level cost of production, current publication includes the
regional level cost of production of selected agricultural commodities which has
potential for commercial cultivation and are widely grown in the country. Some of
the minor crops as well as crops which are region specific (example apple) are not
included in the regional level cost of production.
The regions are broadly categorized into four based on the client dzongkhags of
respective Agriculture Research and Development Centres (ARDCs) located across
the country as below:
SN Regions Dzongkhags
1 Bajo Wangdue, Punakha, Tsirang, Dagana and Gasa
2 Samtenling Sarpang, Samtse, Samdrup Jongkhar, Trongsa and
Zhemgang
3 Wengkhar Mongar, Trashigang, Trashiyangtshe, Lhuntse, Bumthang
and Pemagatshel
4 Yusipang Thimphu, Paro, Haa and Chukha
5.8 Cereals
5.8.1 Maize
Region Expenditure Yield Cost of Production (Nu/Kg)
(Nu/acre) (Kg/acre)
Yusipang 29279 1288 23
Wengkhar 25844 1438 18
Samtenling 25755 925 28
Bajo 24261 1893 13
5.8.2 Quinoa
Region Expenditure Yield Cost of Production (Nu/Kg)
(Nu/acre) (Kg/acre)
Wengkhar 27737 300 92
Samtenling 15062 300 50
Yusipang 25066 300 84
185.8.3 Buckwheat
Region Expenditure Yield Cost of Production
(Nu/acre) (Kg/acre) (Nu/Kg)
Yusipang 19933 465 43
Wengkhar 29468 726 41
Samtenling 26354 974 27
Bajo 24590 701 35
195.9 Vegetables
5.9.1 Asparagus
Region Expenditure Yield Cost of Production (Nu/Kg)
(Nu/acre) (Kg/acre)
Yusipang 59187 721 82
Wengkhar 56938 721 79
Samtenling 30915 475 65
Bajo 51602 563 92
5.9.2 Chilli
Region Expenditure Yield Cost of Production (Nu/Kg)
(Nu/acre) (Kg/acre)
Yusipang 99803 2954 34
Wengkhar 86303 2260 38
Samtenling 42251 994 43
Bajo 94805 2411 39
5.9.3 Beans
Region Expenditure Yield Cost of Production (Nu/Kg)
(Nu/acre) (Kg/acre)
Yusipang 57433 1845 31
Wengkhar 37855 1024 37
Samtenling 36569 1102 33
Bajo 54629 1510 36
5.9.4 Cauliflower
Region Expenditure Yield Cost of Production (Nu/Kg)
(Nu/acre) (Kg/acre)
Yusipang 87621 2375 37
Wengkhar 53983 1486 36
Samtenling 54624 1509 36
Bajo 70909 2177 33
205.9.5. Broccoli
Region Expenditure Yield Cost of Production (Nu/
Kg)
(Nu/acre) (Kg/acre)
Yusipang 53754 3694 15
Wengkhar 47702 1015 47
Samtenling 35684 1096 33
Bajo 51762 1474 35
5.9.6 Cabbage
Region Expenditure Yield Cost of Production (Nu/
Kg)
(Nu/acre) (Kg/acre)
Yusipang 81102 5381 15
Wengkhar 51296 2551 20
Samtenling 46199 963 48
Bajo 58973 4386 13
5.9.7 Carrot
Region Expenditure Yield Cost of Production (Nu/
Kg)
(Nu/acre) (Kg/acre)
Yusipang 36426 1943 19
Wengkhar 22887 1397 16
Samtenling 13113 855 15
Bajo 46446 1326 35
5.9.8 Onion
Region Expenditure Yield Cost of Production
(Nu/Kg)
(Nu/acre) (Kg/acre)
Wengkhar 28559 1026 28
Samtenling 28174 961 29
Bajo 37194 819 45
215.9.9 Tomato
Region Expenditure Yield Cost of Production
(Nu/Kg)
(Nu/acre) (Kg/acre)
Yusipang 60670 1849 33
Wengkhar 45782 1557 29
Samtenling 31257 1131 28
Bajo 66103 1159 57
5.10 Mushroom
5.10.1 Shiitake Mushroom
Scale Region Expenditure Yield Cost of Production
(Nu) (Kg) (Nu/Kg)
Small Yusipang 248516 1200 191
(1000 billets) Wengkhar 149013 1200 115
Samtenling 127669 1200 98
Bajo 142606 1200 110
Medium Yusipang 508984 3600 131
(3000 billets) Wengkhar 326882 3600 84
Samtenling 283987 3600 73
Bajo 385251 3600 99
Large Yusipang 824775 6000 127
(5000 billets) Wengkhar 506250 6000 78
Samtenling 478126 6000 74
Bajo 548806 6000 84
225.10.2 Oyster Mushroom
Scale Region Expenditure Yield Cost of Production
(Nu) (Kg) (Nu/Kg)
Small Yusipang 14605 132 111
(100 bags) Wengkhar 10501 132 85
Samtenling 12513 132 95
Bajo 13886 132 105
Medium Yusipang 47455 660 72
Wengkhar 39822 660 60
(500 bags)
Samtenling 36911 660 56
Bajo 44743 660 68
Large Yusipang 84676 1320 64
(1000 bags) Wengkhar 67121 1320 51
Samtenling 77831 1320 59
Bajo 66925 1320 51
5.11. Spices
5.11.1. Cardamom
Region Expenditure Yield Cost of Production (Nu/
(Nu/acre) (Kg/acre) Kg)
Yusipang 46734 130 359
Wengkhar 45820 130 352
Samtenling 47606 130 366
Bajo 47702 130 366
5.11.2. Ginger
Region Expenditure Yield Cost of Production (Nu/
(Nu/acre) (Kg/acre) Kg)
Yusipang 109004 2000 55
Wengkhar 72175 1800 40
Samtenling 88160 2579 34
Bajo 103777 2000 51
235.12. Fruits
5.12.1 Mandarin
Region Expenditure Yield Cost of Production
(Nu/Kg)
(Nu/acre) (Kg/acre)
Yusipang 73739 2143 34
Wengkhar 68258 2204 31
Samtenling 62153 2204 28
Bajo 74802 2143 35
5.12.2. Banana
Region Expenditure Yield Cost of Production
(Nu/Kg)
(Nu/acre) (Kg/acre)
Yusipang 91787 6272 15
Wengkhar 86162 6272 14
Samtenling 65328 6272 10
5.12.3. Mango
Region Expenditure Yield Cost of Production
(Nu/Kg)
(Nu/acre) (Kg/acre)
Wengkhar 48014 1942 25
Samtenling 53403 1981 27
Bajo 49285 1778 28
5.12.4. Avocado
Region Expenditure Yield Cost of Production
(Nu/Kg)
(Nu/acre) (Kg/acre)
Wengkhar 50234 1963 26
Samtenling 42976 1984 22
Bajo 57856 1976 29
245.12.5. Persimmon
Region Expenditure Yield Cost of Production
(Nu/Kg)
(Nu/acre) (Kg/acre)
Wengkhar 79640 2975 27
Samtenling 46303 2975 16
Bajo 59929 2975 20
5.12.6. Watermelon
Region Expenditure Yield Cost of Production
(Nu/Kg)
(Nu/acre) (Kg/acre)
Wengkhar 89,480 3038 29
Samtenling 69,711 3038 23
Bajo 82,028 3038 27
256. ANNEXURE
6.1. Cost of production formulation process and timeline
SN Time line Activity
1 11 April 2019 1st taskforce meeting to discuss way-forward on CoP.
Workshop cum ToT by taskforce members to the
focal officers from the ARDCs and NMC at Paro.
The topics covered were CoP parameters, sampling
2 13 – 17 May 2019
methodologies, and survey questionnaires. The mock
exercise on data enumeration using app (Kobo toolbox)
on Samsung tablet was conducted.
ToT by focal officers to enumerators of respective
3 20 -30 May 2019
ARDCs and NMC.
June-September
4 Data collection by the enumerators.
2019
5 21-25 October 2019 Data cleaning, processing and validation at Paro.
6 6-10 January 2020 Data analysis at IMS Serbithang.
7 23 January 2020 Presentation at ARCM for comments and feedbacks.
Consultation meeting with commodity specialists,
8 9-10 June 2020
coordinators and focal officials at IMS Serbithang.
9 11-12 June 2020 Drafting of final CoP Document by taskforce.
10 22 June 2020 Finalization meeting for endorsement and publication.
266.2. List of Enumerators
SN Name Designation Email ID
ARDC-Wengkhar
1 Thinley Gyeltshen Sr. Agriculture Officer thinleyg@moaf.gov.bt
2 Karma Yangzom Horticulture Officer karmayangzom93@gmail.com
3 Sangay Jamtsho Sr. Agriculture sangayj@moaf.gov.bt
Supervisor
4 Sonam Dorji Agriculture Supervisor yangsom151@gmail.com
5 Kinzang Thinley Agriculture Officer kinzangt@moaf.gov.bt
6 Tashi Phuentsho Horticulture Officer sharitashi17@gmail.com
7 Kencho Agriculture Supervisor I kenchorigden@yahoo.com
ARDC-Samtenling
8 Tshering Tobgay Agriculture Officer tsheringtobgay@moaf.gov.bt
9 Sonam Dorji Agriculture Officer sonamaudio92@gmail.com
10 Langa Tshering Agriculture Officer ltshering@moaf.gov.bt
11 Kinley Wangchuk Senior Agriculture kellwang6815@yahoo.com
Supervisor III
12 Vivek Uraon Engineer (Electrical) vuraon@moaf.gov.bt
13 Tshewang Junior Engineer (Civil) tshewangnamgyel123@gmail.com
14 Ratu Kinley Agriculture Supervisor II tkinlez6@gmail.com
15 Tshering Peldon Senior Agriculture tshepelzin05@gmail.com
Supervisor II
16 Tshering Wangmo Soil Fertility & Plant tsheringwangmo99@yahoo.com
Nutrition Officer
17 Ganga Ram Ghalley Senior Agriculture karbaghalley@gmail.com
Supervisor II
18 Tshering Tashi Agriculture Officer ttashi@moaf.gov.bt
19 Yeshey Dorji Sr. Agri. Supervisor III yesheyd@moaf.gov.bt
20 Sonam Jamtsho Agri. Supervisor I sonam57jamtsho@gmail.com
21 Ugyen Tshering Agri. Supervisor II utsheringnam2@gmail.com
27ARDC-Bajo
22 Cheku Dorji Sr. Agriculture Officer cdorji@moaf.gov.bt
23 Gyeltshen Tshering Sr. Horticulture Officer gyeltshentshering@moaf.gov.bt
24 Tashi Phuntsho Sr. Horticulture Officer bumthaptashi@gmail.com
25 Passang Tshering Agriculture Officer tsheringpassang8@gmail.com
26 Karma Yoezer Sr. Lab. Assistant-III kyoezer@rcbajo.gov.bt
27 Dolay Sr. Agriculture doleydukpa@gmail.com
Supervisor-I
28 Tanka Maya Pulami Sr. Agriculture tmpulami@moaf.gov.bt
Supervisor-II
29 Arjun Kumar Sr. Agriculture Officer akghallay@moaf.gov.bt
Ghallay
ARDC Yusipang
30 Lhachola Sr. Agriculture officer lhachola@moaf.gov.bt
31 Karma Pelden Dy. Chief Horticulture karmapelden@moaf.gov.bt
Officer
32 Ugyen wangmo Agriculture Officer ugyenw@moaf.gov.bt
33 Yenten Namgay Agriculture Officer ynamgay@moaf.gov.bt
34 Tshering Dorji Sr. Agriculture officer tshering4dorji@gmail.com
35 Tashi Tshering Soil and land focal officer tashigedup@gmail.com
36 Kencho Namgyel Sr. Agriculture supervisor knamgyel101@gmail.com
National Mushroom Centre,
37 Dorji Sr. Mushroom Officer dorji@moaf.gov.bt
38 Ganga Maya Rai Sr. Mushroom Officer gmrai@gmail.com
39 L.B Tamang Sr. Mushroom Supervisor
40 Yeshi Lhendup Sr. Mushroom Supervisor yelaand2012@gmail.com
41 Sabitra Pradhan Sr. Mushroom Supervisor sabitrap@gmail.com
42 Norbu Sr. Mushroom Supervisor norbunmc@gmail.com
43 Rita Gurung Mushroom Supervisor ritagurung2017@gmail.com
44 Rinzin Wangmo Mushroom Supervisor reezeew@gmail.com
286.3. List of specialists, commodity coordinators and focal officials consulted
SN Name Designation/focal Agency Email ID
1 Dophu Dukpa Marketing & Value FAO Dophu.Dukpa@fao.org
Chain Expert Bhutan
2 Mahesh Ghimiray Rice Specialist ARDC mghimiray@gmail.com
Bajo
3 Tirtha Bdr. Katwal Program Director ARDC tirthakatwal@gmail.com
Yusipang
4. Deepak Rai Specialist-III NSC Paro drai@moaf.gov.bt
5 Loday Phuntsho Principal Horticulture ARDC lphuntsho@moaf.gov.bt
Officer/Fruits and Wengkhar
Nuts Coordinator
6 Tshetrim Dy.Chief Horticulture APD,DoA tshetrim@moaf.gov.bt
Officer/National
Vegetable Focal
7 Jigme Tenzin Principal Horticulture APD,DoA jigmetenzin@moaf.gov.bt
Officer/National
Citrus Focal
8 Laxmi Thapa Sr. Agriculture ARDC laxmit@moaf.gov.bt
Officer Yusipang
9 Sangay Dorji Sr. Agriculture ARDC Sangay2750@gmail.com
Supervisor/Plantation Samtenling
Coordinator
10 Jimba Rabgyal Sr. Horticulture ARDC jimbarabgyal@moaf.gov.
Officer/MAP focal Yusipang bt
11 Norbu Sr. Mushroom NMC norbunmc@gmail.com
Supervisor Thimphu
296.4. Questionnaire sample
Data Collection Format (Paddy)
Dzongkhag:
Gewog:
Village:
Crop Name:
Area under cultivation:
Farm-gate price/as- Total
sumed cost costs/
benefits
Total
Parameters Unit (Nu)
Quantity
(kgs/
Num-
bers/ Unit Cost
hours.) (Nu/unit)
Material costs
Seeds Kg
Farm yard manure Kg
Fertilizer Kg
Butachlor Kg
Ploughing (Ox/Power tiller) Nu
Puddling by power tiller Nu
Puddling by ox Nu
Machine hiring for harvesting Nu
Threshing mechanically Nu
Total material Costs
Labour cost
Nursery preparation Person day
Nursery weeding Person day
Nursery uprooting Person day
Main field ploughing (first &
second ploughing) Person day
FYM transportation Person day
Irrigation for puddling Person day
Puddling by labour if used Person day
30Transplanting Person day
Butachlor application Person day
Weeding Person day
Irrigation Person day
Harvesting Person day
Stacking and threshing Person day
Transportation to store Person day
Total labour costs (Nu)
Fixed costs
Nu. (lump-
Land taxes (if its own land)
sum)
Nu. (lump-
Crop insurance if any
sum)
Nu. (lump-
Management cost
sum)
Nu. (lump-
Interest on loan
sum)
Others (Please specify)
Total fixed cost
Total Cost
COST OF PRODUCTION (Nu/Kg) = Total Cost /Total Quantity Produced
31Data Collection Format (Cereals)
Dzongkhag:
Gewog:
Village:
Crop Name:
Area under cultivation:
Farm-gate price/as- Total
sumed cost costs/
Total benefits
Parameters Quanti-
Unit (Nu)
ty (kgs/
Numbers/ Unit Cost
hours.) (Nu/unit)
Material Costs
Seeds Kg
Farm Yard Manure Kg
Fertilizer Kg
Insecticide Kg
Ploughing by Power tiller Nu
Ploughing by ox Nu
Tool and equipment Nu
Fencing materials Nu
Transportation cost (Inputs) Nu
Total material costs
Labour cost
Field ploughing Person day
FYM transportation Person day
Second ploughing Person day
Irrigation Person day
Weeding Person day
Harvesting Person day
Drying and threshing Person day
Transportation to store Person day
Total labour costs (Nu)
32Fixed costs
Land taxes (if its own land) Nu. (lumpsum)
Crop insurance if any Nu. (lumpsum)
Management cost Nu. (lumpsum)
Interest on loan Nu. (lumpsum)
Others (Please specify) Nu.
Total fixed cost Nu.
Total Cost Nu.
COST OF PRODUCTION (Nu/Kg) = Total Cost / Total Quantity Produced
33Data Collection Format (Vegetable Crops)
Dzongkhag:
Gewog:
Village:
Crop Name:
Area under cultivation:
Farm-gate price/assumed
Total
cost
costs/
Parameters Unit Total
benefits
Quantity Price per item
(Nu)
(kgs/Nos.) or (Nu/unit)
Return: Production (yield)* Farm gate price
Material costs Quantity Rate Amount
Seed Kg
FYM Kg
Fertilizer Kg
Machinery ploughing hrs
Herbicides Kg
Fencing materials Nu. (lumpsum)
Leaf mould/compost col-
lection Nu. (lumpsum)
P.P. chemicals Nu. (lumpsum)
Planting Nu. (lumpsum)
Irrigation equipment Nu. (lumpsum)
Mulching materials Nu. (lumpsum)
Staking materials Nu. (lumpsum)
Transportation of inputs Nu. (lumpsum)
Total material cost
Labour cost
Fencing Person days
Bed preparation Person days
FYM application Person days
Transplantation/Sowing Person days
Fertilizer application Person days
Irrigation Person days
34P. P. chemicals applica- Person days
tion
Weeding Person days
Pesticides application Person days
Fruit thinning Person days
Crop guarding Person days
Harvesting Person days
Transportation within
farm Nu. (lumpsum)
Others (Please specify)
Total labour cost
Fixed costs
Land taxes (if its own
land) Nu. (lumpsum)
Crop insurance if any Nu. (lumpsum)
Management cost Nu. (lumpsum)
Interest on loan Nu. (lumpsum)
Others (Please specify)
Total fixed cost
Total Cost
COST OF PRODUCTION (Nu/Kg) = Total Cost / Total Quantity Produced
35Data Collection Format (Fruit Crops)
Dzongkhag:
Gewog:
Village:
Crop Name:
Area under cultivation:
Farm-gate price/assumed
Total
cost
costs/
Parameters Unit Total
benefits
Quantity Price per item
(Nu)
(kgs/Nos.) or (Nu/unit)
Return: Production (yield)* Farm gate price
Variable cost Quantity Rate Amount
Orchard establishment
Land rental (if leased) Nu.
Land preparation & lay
out Person days
Pit digging Person days
Machinery hire charge Nu.
Seedlings Number
FYM Kg
Leaf mould/compost
collection Person days
Chemical fertilizers Nu. (lumpsum)
Planting Person days
Irrigation Person days
Trellis installation Nu. (lumpsum)
Mulching Person days
Basin preparation Person days
Staking Person days
Fencing Nu. (lumpsum)
Orchard maintenance
FYM Kg
Compost Collection Person days
Chemical fertilizers Nu. (lumpsum)
P. P. chemicals Nu. (lumpsum)
Irrigation Person days
36Spraying Person days
Weeding &basin Person days
Pruning & training Person days
Fruit thinning Person days
Picking fruits (Harvest-
ing) Person days
Materials used for har-
vesting Nu. (lumpsum)
Transportation within
farm Nu. (lumpsum)
Others (Please specify)
Total variable cost
Fixed costs
Land taxes (if its own
land) Nu. (lumpsum)
Machinery, Tools &
Implements Number
Irrigation pipes &
equipment Meter
Sprayer Number
Harvesting ladder Number
Harvesting baskets Number
Crop insurance if any Nu. (lumpsum)
Management cost Nu. (lumpsum)
Interest on loan Nu. (lumpsum)
Others (Please specify)
Total fixed cost
Total Cost
COST OF PRODUCTION (Nu/Kg) = Total Cost / Total Quantity Produced
37Data Collection Format (MAPS)
Dzongkhag:
Gewog:
Village:
Crop Name:
Area under cultivation:
Farm-gate price/assumed
Total
cost
costs/
Parameters Unit Total
benefits
Quantity Price per item
(Nu)
(kgs/Nos.) or (Nu/unit)
Return: Production (yield)* Farm gate price
Variable cost Quantity Rate Amount
Orchard establishment
Land rental (if leased) Nu.
Land preparation & lay
out Person days
Pit digging Person days
Machinery hire charge Nu.
Seedlings Number
FYM Kg
Leaf mould/compost
collection Person days
Chemical fertilizers Nu. (lumpsum)
Planting Person days
Irrigation Person days
Dryer/Drying shed Nu. (lumpsum)
Mulching Person days
Basin preparation Person days
Staking Person days
Fencing Nu. (lumpsum)
Firewood Nu. (lumpsum)
Orchard maintenance
FYM application Kg
Compost collection Person days
Chemical fertilizers Nu. (lumpsum)
P. P. chemicals Nu. (lumpsum)
38Irrigation Person days
Spraying Person days
Weeding & basin Person days
Gap filling Person days
Firewood collection Person days
Harvesting Person days
Materials used for har-
vesting Nu. (lumpsum)
Curing and drying Person days
Others (Please specify)
Total variable cost
Fixed costs
Land taxes (if its own
land) Nu. (lumpsum)
Machinery, Tools & Im-
plements Number
Irrigation pipes & equip-
ment Meter
Sprayer Number
Harvesting tools Number
Harvesting baskets Number
Crop insurance if any Nu. (lumpsum)
Management cost Nu. (lumpsum)
Interest on loan Nu. (lumpsum)
Others (Please specify) Nu.
Total fixed cost Nu.
Total Cost Nu.
COST OF PRODUCTION (Nu/Kg) = Total Cost / Total Quantity Produced
39Data Collection Format (Shiitake)
Dzongkhag:
Gewog:
Village:
Crop Name:
No. of billets under cultivation:
Revenue Units 1 year 2 year 3-7 year
Yield Kg. per log
No. of log Nos.
Production Kg. per 5000 logs
Farm gate price Nu/Kg
Total revenue
Material costs
Spawn (Qty.) Bottle
Price Nu/bottle
Value Nu.
Shed (Depreciated) Nu.
Maintenance cost Nu.
Soaking tank (Depreciated) Nu.
Log (3000@Nu. 20) Nu.
Royalty for logs Nu.
Wax (Kg) Nu.
Rosin (Kg) Nu.
Napkin (roll/piece) Nu.
Plastic sheets (meters/
bundles) Nu.
Water pipes (bundles) Nu.
Sprinkler Nu.
Thermohygro meter (no) Nu.
Heating system (back load/
no) Nu.
Cost electricity (Year) Nu.
Total material cost Nu.
Labour Cost
Inoculation Person day
Turning of logs Person day
Re-staking Person day
40Watering of logs Person day
Soaking of logs Person day
Staking Person day
Harvesting Person day
Total Labour Person day
Wage rate Per person day
Total labour cost
Total Cost
COST OF PRODUCTION (Nu/Kg) = Total Cost / Total Quantity Produced
41Data Collection Format (Oyster)
Dzongkhag:
Gewog:
Village:
Crop Name:
No. of bags under cultivation:
Revenue 1 year 2 year 3 year
Quantity (Kg/bag)
No. of bag
Kg/100
Price/Unit (Farm gate Price)
Total Revenue
Material costs
Spawn
Qty (Nos)
Price/Unit
Value
Total cost of shed (Lum-sum)
Cost of straw including transportation
Cost of firewood
cost of plastic bags
Cost of rubber band used
Cost of jute bags used
Cost of plastic sheet used (meters/ bun-
dles)
Cost of Rope
Cost of water pipe
Cost of ethanol
Cost of spray bottles
Cost of Thermohygro meter used (no)
Cost of straw chopping machine
Cost of watering can
Cost of barrel
Cost of sprinkler used
Cost of heating system used (back load/
no)
42other cost
Cost electricity (month/Year)
Total material cost
Labour Cost (Person/day)
Cost labour used for Chopping of straw
Cost labour used for soaking and steril-
izing
Cost of labour used for inoculation
Cost of labour used for watering
Cost of labour used for harvesting
Total Labour
Wage rate/Day (Nu/day)
Total Labour Cost
Total Cost
COST OF PRODUCTION (Nu/Kg) =
Total Cost / Total Quantity Produced
436. BIBLIOGRAPHY
Agriculture Statistics. (2015). Department of Agriculture, Ministry of Agriculture and
Forests, Thimphu, Bhutan.
Agriculture Statistics. (2017). Department of Agriculture, Ministry of Agriculture and
Forests, Thimphu, Bhutan.
DoA. (2017). Cost of production of field crops and horticulture crops grown in Bhu-
tan, Department of Agriculture, MoAF, Thimphu.
Harvard Humanitarian Initiative and the International Rescue Committee. (n.a). User
guide for Kobo toolbox. Retrieved from, https://humanitarianrespone.info/en/
application.
MAGIP. (2013). Production cost for major vegetables in Bhutan, Market Access and
Growth Intensification Project, Ministry of Agriculture and Forests, Bhutan.
44Total Costs
Input (Nu)
Variable Costs
Fixed Costs
Output (Kg)
Agriculture Research and Extension Division
Department of Agriculture
Ministry of Agriculture and Forests
Thimphu: Bhutan
45You can also read