Action plan to reduce ammonia emissions from agriculture in Finland
←
→
Page content transcription
If your browser does not render page correctly, please read the page content below
Action plan to reduce
ammonia emissions from
agriculture in Finland

               1b2018
Publications of the Ministry of Agriculture and Forestry 1b/2018

Action plan to reduce ammonia emissions
from agriculture in Finland

Ministry of Agriculture and Forestry
Ministry of the Environment
Helsinki 2018
Ministry of Agriculture and Forestry
Ministry of the Environment

ISBN: 978-952-453-973-9
ISBN PDF: 978-952-453-974-6

Layout: Government Administration Unit, Publications, Anne-Marie Paakkari
Cover photos: Picture archives of the Ministry of Agriculture and Forestry

Helsinki 2018
Description sheet

Published by                Ministry of Agriculture and Forestry                        8th March 2018

                            The action plan was prepared in cooperation with the Ministry of Agriculture and
Authors
                            Forestry, Ministry of the Environment and relevant stakeholders

Title of publication        Action plan to reduce ammonia emissions from agriculture in Finland

Series and publication      Publications of the Ministry of Agriculture and Forestry
number                      1b/2018

ISBN (printed)              978-952-453-973-9                ISSN (printed)             1238-2531

ISBN PDF                    978-952-453-974-6                ISSN (PDF)                 1797-397X

Website address
                            http://urn.fi/URN:ISBN:978-952-453-974-6
(URN)

Pages                       36                               Language                   English

Keywords                    agriculture, ammonia, air quality, emissions

Abstract
International agreements and the EU legislation oblige Finland to reduce ammonia emissions into the air.
According to the Gothenburg Protocol to the Convention on Long Range Transboundary Air Pollution and the
National Emission Ceilings Directive relating to it (2001/81/EC), as from 2010 the annual ammonia emissions in
Finland should not have exceeded 31 kilotonnes. Finland has exceeded the emissions reduction obligation by
about 20 per cent each year.

The Gothenburg Protocol was amended in 2012 to further reduce ammonia emissions so that from 2020
they should be 20 per cent less than they were in 2005. Within the EU the amendments to the Protocol are
implemented by the new National Emission Ceilings Directive (2016/2284).

In Finland more than 90 per cent of the ammonia emissions originate from agricultural sources, which is
why most of the actions to reduce the emissions are to be targeted to agriculture. In agriculture, ammonia
originates from animal manure in livestock buildings and during storing and spreading of manure. Ammonia
volatiles also from other organic fertilisers containing nitrogen, as well as from mineral N- fertilisers.

The most effective measures to reduce ammonia emissions in agriculture concern animal manure and it's
management. Ammonia emissions can also be reduced by actions relating to the feeding of animals, but
regulating these and assessing the impacts achieved is more difficult than in the case of actions relating to
manure management.

This action plan and the measures included in it aim to reduce ammonia emissions from agriculture in a way
that the emissions from agricultural sources would meet the obligation set for to the year 2020.

The action plan was prepared in cooperation between the Ministry of Agriculture and Forestry and Ministry of
the Environment. The relevant stakeholders were heard during the process.

Publisher                   Ministry of Agriculture and Forestry

Distributed by/             Online version: julkaisut.valtioneuvosto.fi
Publication sales           Publication sales: julkaisutilaukset.valtioneuvosto.fi
Kuvailulehti
Julkaisija Maa- ja metsätalousministeriö 8.3.2018
Toimintaohjelma on valmistelu yhteistyössä maa- ja metsätalousministeriön,
Tekijät
ympäristöministeriön ja sidosryhmien kanssa
Julkaisun nimi Toimintaohjelma maatalouden ammoniakkipäästöjen vähentämiseksi Suomessa
Julkaisusarjan nimi Maa- ja metsätalousministeriön julkaisuja
ja numero 1b/2018
ISBN painettu 978-952-453-973-9 ISSN painettu 1238-2531
ISBN PDF 978-952-453-974-6 ISSN PDF 1797-397X
URN-osoite http://urn.fi/URN:ISBN:978-952-453-974-6
Sivumäärä 36 Kieli englanti
Asiasanat maatalous, ammoniakki, ilmanlaatu, päästöt
Tiivistelmä
Kansainväliset sopimukset ja EU:n lainsäädäntö edellyttävät, että Suomi vähentää ammoniakkipäästöjä
ilmaan. Kaukokulkeutumissopimuksen vuoden 1999 Göteborgin pöytäkirjan ja sitä vastaavan EU:n
päästökattodirektiivin (2001/81/EY) mukaan Suomen ammoniakkipäästöjen olisi vuodesta 2010 alkaen tullut
olla vuosittain korkeintaan 31 kilotonnia. Suomi on ylittänyt päästövelvoitteensa vuosittain noin 20 prosentilla.
Göteborgin pöytäkirjaa muutettiin vuonna 2012 ammoniakkipäästöjen edelleen vähentämiseksi siten, että
päästöjen tulisi olla vuodesta 2020 alkaen vähintään 20 prosenttia pienemmät kuin vuoden 2005 päästöt.
Pöytäkirjan muutoksen velvoitteet pannaan EU:ssa täytäntöön uudella päästökattodirektiivillä (2016/2284).
Suomen ammoniakkipäästöistä yli 90 prosenttia on peräisin maataloudesta, joten myös pääosa
vähennystoimista kohdistuu maatalouteen. Maataloudessa ammoniakkia haihtuu kotieläinten lannasta
eläinsuojissa ja lannan varastoinnin ja levityksen yhteydessä. Ammoniakkia haihtuu myös typpeä sisältävistä
muista orgaanisista ja epäorgaanisista lannoitteista.
Tehokkaimmat toimenpiteet maatalouden ammoniakkipäästöjen vähentämiseksi liittyvät lantaan, sen
varastointiin ja levitykseen. Ammoniakkipäästöihin on mahdollista vaikuttaa myös kotieläinten ruokintaan
liittyvillä toimilla, mutta niiden hallinta ja vaikutusten arviointi on lantaan liittyviä toimia hankalampaa.
Tällä toimintaohjelmalla ja siihen sisällytetyillä toimilla pyritään maataloudesta peräisin olevien
ammoniakkipäästöjen vähentämiseen niin, että maatalouden ammoniakkipäästöt olisivat vuonna 2020
asetetun velvoitteen mukaiset.
Tämä toimintaohjelma on valmisteltu maa- ja metsätalousministeriön ja ympäristöministeriön välisenä
yhteistyönä asiaan liittyviä sidosryhmiä kuunnellen.
Kustantaja Maa- ja metsätalousministeriö
Julkaisun myynti/ Sähköinen versio: julkaisut.valtioneuvosto.fi
jakaja Julkaisumyynti: julkaisutilaukset.valtioneuvosto.fiContents
1 Reduction obligations......................................................................................................................................... 7
2 Ammonia emissions from agriculture .................................................................................................. 9
3 Steering instruments and measures reducing ammonia emissions
from agriculture in Finland .......................................................................................................................... 11
3.1. Legal measures.................................................................................................................................................................... 12
3.1.1. Nitrates Decree........................................................................................................................................ 12
3.1.2. Environmental permit for livestock premises.................................................................................. 13
3.2. Rural Development Programme for Mainland Finland 2014–2020............................... 14
3.2.1. Environment payment for injection of slurry into the soil.......................................................... 14
3.2.2. Agricultural investment aid................................................................................................................. 16
3.3. Other measures to reduce ammonia emissions................................................................................ 18
3.3.1. Environment payments.......................................................................................................................... 18
3.3.2. Payment to farm advisory services.................................................................................................... 19
3.3.3. Animal welfare payment....................................................................................................................... 19
3.3.4. Acid treatment of manure..................................................................................................................... 20
4 Structural development in agriculture................................................................................................ 21
5 Fur farming ................................................................................................................................................................... 23
5.1. Production............................................................................................................................... 23
5.2. Steering instruments and measures reducing ammonia emissions ........................... 24
5.2.1. Legal measures........................................................................................................................................ 24
5.2.2. Other measures........................................................................................................................................ 24
6 Action plan to reduce ammonia emissions from agriculture in Finland
in 2017–2020 ............................................................................................................................................................... 25
7 Monitoring of the action plan..................................................................................................................... 28
8 Compliance with the reduction obligations ................................................................................... 29
9 Emission inventories adjustment ............................................................................................................. 30
References..................................................................................................................................................................... 31ACTION PLAN TO REDUCE AMMONIA EMISSIONS FROM AGRICULTURE IN FINLAND
1 Reduction obligations
International agreements and the EU legislation oblige Finland to reduce ammonia emis-
sions into the air. Measures in agriculture needed to comply those international obliga-
tions by the year 2020 are expressed in this action plan. The action plan was prepared in
cooperation with the Ministry of Agriculture and Forestry and Ministry of the Environment.
The relevant stakeholders were heard during the process. The reduction obligations for
ammonia emissions in Finland are based on the following documents:
• Gothenburg Protocol to the Convention on Long Range Transboundary Air Pol-
lution (UNECE 1999) and Directive of the European Parliament and of the Council
2001/81/EC implementing the Gothenburg Protocol in the EU (National Emission
Ceilings Directive, NEC Directive): ammonia emission ceiling for Finland as from
2010 has been 31 kilotonnes/year.
• Amendment to the Gothenburg Protocol 2012 (UNECE): reduction obligation
concerning ammonia emissions from 2020 is 20 percent from the 2005 emission
levels (36.5 kt). Ammonia emissions should be reduced by 7.3 kt to the level of
29.2 kt in 2020.
• The amendment of the Gothenburg Protocol obligation will be implemented in
the EU by the new NEC Directive (2016/2284). The reduction target for ammonia
emissions set for Finland is –20% as from 2020 from the level in 2005.
7PUBLICATIONS OF THE MINISTRY OF AGRICULTURE AND FORESTRY 1b/2018
Trends in ammonia emissions in Finland:
Figure 1. Ammonia emissions in Finland in 1990–2014. (Finnish Environment Institute, 2016)
NH3 1980–2015
40
35
30
25
20
15
10
5
0
1980
1981
1982
1983
1984
1985
1986
1987
1988
1989
1990
1991
1992
1993
1994
1995
1996
1997
1998
1999
2000
2001
2002
2003
2004
2005
2006
2007
2008
2009
2010
2011
2012
2013
2014
2015
Energy Transport Industry Product use Agriculture Waste
8ACTION PLAN TO REDUCE AMMONIA EMISSIONS FROM AGRICULTURE IN FINLAND
2 Ammonia emissions from agriculture
In Finland 91 per cent of ammonia emissions come from agriculture, which in this con-
text also includes fur farming (Table 1). In agriculture ammonia evaporates from animal
manure in livestock buildings and in the storage and spreading of manure. Ammonia also
evaporates from other organic fertilisers containing nitrogen and inorganic fertilisers. In
2015 ammonia emissions from agriculture totalled 28.8 kt, of which 26.5 kt (91.7%) came
from animal manure, 2.3 kt (8%) from mineral fertilisers, 0.002 kt from sewage sludge used
in agriculture and 0.07 kt from burning biomass on arable land. (Table 2) (Finnish Environ-
ment Institute, 2017)
The amount of nitrogen contained in feed that remains unused and ends up in manure
depends on the amount and type of protein given in feed and the ability of animals to uti-
lise the protein in feed. The more nitrogen ends up in manure, the greater is the ammonia
evaporation potential.
Of the emissions from agriculture about 55% comes from bovines, 15% from pigs, 6% from
poultry and 10% from fur animals and 5% from other animals.
In addition to agriculture other sources of ammonia emissions include transport, use of
solvents and other products, industry and energy production.
Table 1. Total ammonia emissions and emissions from agriculture in 1990, 2005 and 2010–2015.
(Finnish Environment Institute, 2017)
Year Total emissions (kt) Agriculture (kt)
1990 34.1 31.4
2005 36.5 32.0
2010 35.3 31.5
2011 34.3 30.8
2012 33.7 30.3
2013 33.1 29.9
2014 33.5 30.2
2015 31.8 28.8
9PUBLICATIONS OF THE MINISTRY OF AGRICULTURE AND FORESTRY 1b/2018
Table 2. Ammonia emissions from agriculture in Finland in 1990, 2005 and 2010–2015.
(Finnish Environment Institute, 2017)
year total (kt) animals (kt) fertilisers (kt) municipal sludge (kt) burning of agricultural
waste (kt)
1990 31.4 27.2 4.1 0.060 0.109
2005 32.0 29.3 2.7 0.004 0.080
2010 31.4 28.7 2.7 0.009 0.050
2011 30.8 28.3 2.5 0.004 0.059
2012 30.3 27.9 2.3 0.007 0.058
2013 29.9 27.6 2.3 0.007 0.078
2014 30.2 27.7 2.4 0.007 0.071
2015 28.8 26.4 2.3 0.002 0.070
Table 3. Ammonia emissions from livestock manure in 2005 and 2015 (kt) by livestock category
(Finnish Environmental Institute, 2017).
Animal 2005 (kt) 2015 (kt) Change 2005–
2015 (%)
Dairy cows 9.81 8.47 -14 %
Sucler cows 0.38 0.63 65 %
Heifers 1.79 1.8 1%
Bulls 2 2.02 1%
Calves 3.41 2.94 -14 %
Sows with piglets 1.91 1.2 -37 %
Boars 0.03 0.01 -58 %
Fattening pigs 3.02 2.51 -17 %
Weaned pigs 0.72 0.59 -17 %
Laying hens 0.87 0.88 2%
Cocks 0.01 0.01 46 %
Broilers 0.41 0.58 41 %
Broiler mothers 0.08 0.1 20 %
Chickens 0.15 0.08 -46 %
Turkeys 0.14 0.07 -47 %
Other poultry 0 0 10 %
Horses and ponies 1.1 1.23 12 %
Sheep 0.09 0.23 173 %
Goats 0.01 0.01 2%
Foxs and racoon dogs 2.52 2.4 -5 %
Minks and polecats 0.76 0.6 -20 %
Reindeer 0.1 0.09 -10 %
10ACTION PLAN TO REDUCE AMMONIA EMISSIONS FROM AGRICULTURE IN FINLAND
3 Steering instruments and measures
reducing ammonia emissions from
agriculture in Finland
The steering instruments that are currently being used to reduce ammonia emissions from
agriculture are:
• Ministry of the Environment: Nitrates Decree and environmental permits;
measures included in the river basin management plans
• Ministry of Agriculture and Forestry: Rural Development Programme for Mainland
Finland 2014–2020 (environment payments, agricultural investment aids, animal
welfare payment and payment to farm advisory services)
Structural development in agriculture also impacts on the levels of ammonia emissions
from agriculture.
The most effective measures to reduce ammonia emissions from agriculture concern
manure and how it is stored and spread. Ammonia emissions can also be reduced by ac-
tions relating to the feeding of animals, but regulating these and assessing the impacts
achieved is more difficult than in the case of actions relating to manure. (Grönroos, 2014)
The implementation of the actions to reduce ammonia emissions can be promoted either
through statutory means (Nitrates Decree and environmental permits) or measures under-
taken by operators on a voluntary basis such as the environment payment scheme.
11PUBLICATIONS OF THE MINISTRY OF AGRICULTURE AND FORESTRY 1b/2018
3.1. Legal measures
3.1.1. Nitrates Decree
The Nitrates Decree amended in 2014 (1250/2014) requires that all slurry and dry manure
stores must be covered. Because the requirement applies to new manure stores only and
as for bovine slurry, which represents more than 70% of the total amount of slurry pro-
duced, natural crust on top is also accepted as cover. The impact of the requirement con-
cerning covering manure stores is estimated to remain quite modest.
The impact of the requirement to cover new and enlarged manure stores on ammonia
emissions from agriculture would be about –1%, with the emissions in 2012 as the refer-
ence level and not taking account of the fact that nitrogen emissions are likely to grow by
2020 due to the higher output levels, which increases the emissions potential of agricul-
ture.
Manure must be incorporated within 24 hours from the spreading. On sections of arable
land parcels with a slope of at least 15% the spreading of slurry, urine and liquid organic
fertiliser products by methods other than injection is always prohibited. Other types of
manure and organic fertiliser products spread on sloping sections of arable parcels must
be tilled into the soil within 12 hours from the spreading.
The impact of the incorporation requirement under the Decree on the total ammonia
emissions is about –1%, but this took place immediately after the entry into force of the
Decree. The reason for this quite a modest impact is that today a significant share of ma-
nure (more than a third of slurry) is spread on vegetation, in which case incorporation
cannot be required (except for spreading on vegetation as from 15 September, as also re-
quired by the Decree currently in force). Also, already at present a significant share of ma-
nure spread on soil with no vegetation or on stubble is incorporated within the required
24 hours.
A farm that receives manure from other farms for storage must have a manure store that
can be dimensioned on an annual basis in accordance with the amount of manure re-
ceived. A farm that receives and stores organic fertiliser products must have a water-tight
storage facility dimensioned in accordance with the amount to be received. An organic
fertiliser product and manure with a dry matter content of at least 30% can also be stored
in covered heaps. Now these requirements for storage, including in heaps, applies to ma-
nure as well as organic fertiliser products.
The operator must have the manure analysed every five years to determine its soluble ni-
trogen, total nitrogen and total phosphorus content. Fertilisation is planned either based
on the manure analysis or values presented in the Decree. The operator must keep the
12ACTION PLAN TO REDUCE AMMONIA EMISSIONS FROM AGRICULTURE IN FINLAND
results of the manure analysis and product descriptions of organic fertiliser products and
present these to control authorities upon request.
In the autumn from the beginning of September the amount of soluble nitrogen spread in
the manure of farm animals and organic fertiliser products may not exceed 35 kg/ha. The
whole amount of soluble nitrogen spread in the autumn is taken into account in the fertil-
isation of the following crop. (Ministry of the Environment, 2014) (Finlex, 2014)
According to the Nitrates Decree, the operator must keep annual records on fertilisation
and, upon request, provide this information to the control authority.
The following information is to be included in the records:
1. amount of manure and organic fertiliser products and nitrogen fertilisers used as
nutrient supplements in arable lands and the soluble nitrogen and total nitrogen
contained in these;
2. yield levels;
3. time when manure or organic fertiliser products were spread on arable lands.
3.1.2. Environmental permit for livestock premises
According to the Environmental Protection Act (527/2014), a permit is required for any
activities that pose a threat of environmental pollution. The permit requirements for live-
stock premises are based on the keeping of livestock in the premises, which comprises the
exercise and grazing areas and the storage, handling and utilisation of the manure, liquid
manure and wastewater produced in them. Provisions on restricting ammonia emissions
may also be included in the environmental permit. Such provisions are needed to reduce
harm to the environmental and health caused by the odour and air emissions and to com-
ply with the international obligations (Gothenburg Protocol and National Emission Ceil-
ings Directive). The provisions in the environmental permit may also be stricter than those
in the Nitrates Decree concerning, for example, more rapid incorporation of manure (with-
in 4 hours, for example) and fixed covers on manure stores (including the existing ones).
The permit may also require that slurry may only be spread by injection or that spreading
in windy conditions should be avoided.
The provisions in the permit must be based on the best available techniques, but the use
of a specific technique cannot be required.
Pig and poultry production units that fall within the scope of the Industrial Emissions Direc-
tive apply the BAT conclusions concerning these sectors, which also include requirements
concerning ammonia emissions. Of the emissions from livestock production (which repre-
13PUBLICATIONS OF THE MINISTRY OF AGRICULTURE AND FORESTRY 1b/2018
sent about 86% of the total emissions) 65% come from units that are subject to the permit
(all cattle, pig, poultry, etc. production units that are subject to the permit). The share of
production units covered by the Industrial Emissions Directive (large pig and poultry pro-
duction units) of the emissions from livestock production is estimated to be about 3%.
3.2. Rural Development Programme for Mainland Finland
2014–2020
3.2.1. Environment payment for injection of slurry into the soil
The most effective measure of the Rural Development Programme to reduce ammonia emis-
sions is the parcel-specific measure concerning injection of slurry into the soil included in the
environment payment scheme. The measure has been applied in Mainland Finland since 2009.
Table 4. Trend in the number of farms that have undertaken the measure and the area
covered in 2009–2015.
Year Number of farms Area where slurry injected into the soil, ha
2009 1,482 50,330
2010 2,046 73,810
2011 2,566 94,231
2012 2,897 112,749
2013 2,919 119,410
2014 2,919 119,410
2015 5,300 217,000
2016 5,150 186,000
In this five-year commitment the farmer is paid compensation for using the injection
method when spreading slurry or urine. The payment of the compensation requires that
per hectare is spread at least 20 m3 / year.
In the aid application of spring 2015 the measure was selected by 12,500 farms (about
400,000 ha), of which about 5,300 farms had used it on an area of about 217,000 hectares
in that year. The payment is 40 €/ha. This means that under the measure concerning the
injection of slurry into the soil at least 4,340,000 m3 (20 m3/ha x 217,000 ha) of slurry had
been injected into the soil, which is almost half of the total amount of slurry produced
(9.5 million m3; Luostarinen et al. 2017). In reality the share of manure that is injected is
even greater because all farms that spread slurry do not participate in the environment
payment scheme or have not selected this measure. The amount spread per hectare is al-
so likely to be larger than the minimum of 20 m3/ha specified in the conditions. Thus the
14ACTION PLAN TO REDUCE AMMONIA EMISSIONS FROM AGRICULTURE IN FINLAND
share of slurry injected into the soil of all slurry produced in 2015 is estimated at about
55%. In 2014 about a third of all slurry spread was injected into the soil. The amount of
slurry injected in 2016 was theoretically slightly lower than in 2015. Injected amounts are
influenced also by the weather conditions of each year and the crop range in the crop ro-
tation.
The impact of increased injection of slurry into the soil on emissions depends on the
method by which slurry was applied before the injection method was introduced. In 2014
about a third of the slurry was injected, about 27% was applied by trailing hose spreading
and about 40% by broadcasting. Of the slurry produced in Finland every year about a third
comes from cattle production and the rest from pig husbandry. Cattle slurry is also com
monly applied on grasses, which is why injection is a little more common than in the case
of pig slurry, while hose spreading is more common on pig farms because pig slurry is of-
ten applied on new plant shoots as well.
Compared to broadcast application and assuming that slurry is not incorporated after
application, injection reduces ammonia evaporation by about 80%, on average (injec-
tion close to surface less, deeper into the soil more). Correspondingly, the impact of hose
spreading on reducing emissions would be about 30–35% (emissions reduced more when
applied on vegetation).
According to our national legislation (Nitrates Decree 1250/2014), manure spread on land
surface must be incorporated within 24 hours, unless it is a question of manure spread on
growing vegetation. This means that part of the manure applied by means of trailing hose
spreading or broadcasting is incorporated after application by ploughing or harrowing.
The impact of incorporation on reducing emissions varies between 15 and 90% depend-
ing on the method used and how quickly after application the manure is incorporated.
When estimating the impact of the growing use of the injection method on reducing
emissions in 2015 it was assumed that the share of manure applied by injection increased
from 33% in 2014 to 55% in 2015. This was estimated to have resulted in a slight reduction
in the share of trailing hose spreading (27% 25%) and a more significant reduction in
the share of broadcast application (40% 20%). No change was assumed to have taken
place in how quickly after application the manure was incorporated.
The increased use of injection into the soil reduced ammonia emissions from agriculture
by about 1.25 kt from 2014 to 2015.
Measure: Support for manure spreading by the injection method is continued as part of
the environment payment scheme in 2017–2020.
15PUBLICATIONS OF THE MINISTRY OF AGRICULTURE AND FORESTRY 1b/2018
In 2017–2020 the share of manure spread by injecting it into the soil stays at a high level
or increases. The updated BAT conclusions concerning the intensive rearing of pigs and
poultry (IRPP) will further increase the share of manure spread by injection because broad-
cast application is no longer compliant with the Best Available Techniques. The new BAT
conclusions entered into force in the first half of 2017. As a result of other changes in ma-
nure spreading mainly increased use of hose spreading for slurry, the emissions from ma-
nure are estimated to decrease by about 2.6 kt from 2014 to 2020.
3.2.2. Agricultural investment aid
Investments enhancing the state of the environment
Covering manure stores and cooling manure channels is eligible for support under the ag-
ricultural investment aid scheme. In the programming period 2014–2020 support may also
be granted for other investments to improve the state of the environment (section 18 of
the Government Decree on Targeting Agricultural Investment Aid 241/2015). This compris-
es, among other things, support for the acquisition of equipment for the separation and
other treatment of manure and for injecting slurry into the soil. In 2016 aid was granted
for 60 purchases of slurry injection equipment and for 8 purchases of manure separation
equipment. Cooling of manure channels is usually always taken into account in new con-
struction projects in piggeries, but is also supported as separate projects. For 2016 the aid
percentage of investments relating to improving the state of the environment was raised
from 30 to 35% and in investments to slurry injection equipment to 40 %.
In 2000–2016 a total of about 6 600 manure stores (table 5) were built by means of the
investment aid, with a total volume of almost 8.6 million m3 and the surface area of stores
with fixed covers of 660,000 m2. The manure storage volume of uncovered manure stores
built by means of investment aid was 6.4 million m3 and that of covered manure stores
was about 2.2 million m3 (Table 6).
16ACTION PLAN TO REDUCE AMMONIA EMISSIONS FROM AGRICULTURE IN FINLAND
Table 5. Numbers of manure stores and covered manure stores built by means of investment aid in 2000–
2016.
Year Number of stores Of these Number of Of these Number of liquid Of these
for solid manure covered slurry tanks covered manure tanks covered
2000–2001 548 237 490 100 127 36
2002 311 119 330 73 60 15
2003 258 99 301 86 44 11
2004 195 87 188 35 27 6
2005 296 129 310 72 61 18
2006 229 92 279 56 37 15
2007 236 100 337 50 37 14
2008 96 57 162 30 7 2
2009 102 55 214 34 13 8
2010 70 28 176 33 12 3
2011 58 31 146 24 4 0
2012 52 32 116 20 2 2
2013 80 33 140 27 8 8
2014 43 24 89 6 2 1
2015 68 38 52 1 2 1
2016 108 85 109 5 3 0
total 2,750 1,246 3,439 652 446 140
share% 45.3 19.0 31.4
Table 6. Volumes (m3) of manure stores and covered manure stores built by means of investment aid in
2000–2016.
Year Stores for solid Of these Slurry tanks Of these Liquid manure Of these
manure m3 covered m3 m3 covered m3 tanks m3 covered m3
2000–2001 264,941 114,582 506,602 103,388 46,170 13,088
2002 205,365 78,580 422,202 93,396 24,670 6,168
2003 151,221 58,027 446,776 127,650 13,138 3,285
2004 159,003 70,940 280,974 52,309 9,433 2,096
2005 204,697 89,209 465,727 108,169 21,524 6,351
2006 186,158 74,788 525,832 105,543 12,215 4,952
2007 273,474 115,879 683,215 101,367 11,824 4,474
2008 121,074 71,888 323,103 59,834 4,150 1,186
2009 90,285 48,683 510,746 81,147 4,160 2,560
2010 74,111 29,644 435,448 81,647 4,953 1,238
2011 98,376 52,580 334,275 54,949 990 0
2012 55,247 33,998 346,795 59,792 715 715
2013 75,354 31,084 331,832 63,996 2,585 2,585
2014 44,681 24,938 229,420 15,467 912 456
2015 130,286 65,506 116,665 2,500 4,448 2,114
2016 122,709 98,786 258,469 7,103 756 0
total 2,256,982 1,059,112 6,218,081 1,118,257 162,643 51,267
share% 46.9 18.0 31.5
17PUBLICATIONS OF THE MINISTRY OF AGRICULTURE AND FORESTRY 1b/2018
In 2014 about 70% of cattle slurry was not covered or had formed a natural crust. Of pig
slurry 40% was stored in uncovered tanks. Of dry manure about 60% was in uncovered
manure stores. The share of manure stored in covered stores is going to increase due to
the requirement concerning covering new manure stores in the amended Nitrates Decree
from 2014 (1250/2014), but this change will be quite slow. Covering will also become in-
creasingly common upon the entry into force of the updated BAT conclusions concerning
the intensive rearing of pigs and poultry (IRPP).
The Nitrates Decree’s requirement to cover manure stores is estimated to result in only a
slight reduction in ammonia emissions from agriculture, less than 1 kt, in 2014–2020. In
large slurry stores for cattle the formation of a natural crust is usually considered sufficient.
In pork production slurry stores are usually covered with floating cover. Solid manure
stores are covered with roofs.
Measure: Investment aid continues to be granted for covering manure stores, cooling ma-
nure channels and acquisition of manure treatment equipment as well as to other invest-
ments promoting the environment.
3.3. Other measures to reduce ammonia emissions
The following chapters present measures which have only a minor impact on ammonia
emissions and the impact is difficult to measure, but which have some potential to reduce
the emissions.
3.3.1. Environment payments
Balanced use of nutrients
The measure concerning balanced use of nutrients is a farm-specific measure included in
the environment payment scheme under the Rural Development Programme for Mainland
Finland 2014–2020. It includes the maximum use levels for nitrogen and more detailed
conditions for the use of cattle manure with regard to the quantities and the times of
spreading. Farmers are also required to keep detailed parcel-specific records on measures
undertaken on arable lands. The conditions must be complied with on all arable lands of a
farmer who has given the five-year commitment. The compensation paid for the measure
is 54 €/ha/year.
Nitrogen fertilisers may be used for specific plants and based on the circumstances of each
parcel in amounts per hectare that are below the use levels allowed by the current legisla-
tion (legislation on fertiliser products and Nitrates Decree). Nutrients contained in animal
18ACTION PLAN TO REDUCE AMMONIA EMISSIONS FROM AGRICULTURE IN FINLAND
manure are taken into account in fertilisation in accordance with the strict restrictions for
nitrogen.
In 2015 about 45,600 farms made the environment commitment, covering a total ara-
ble a rea of about 2.06 million ha. This is 86% of all farms that applied for direct payments.
About 44,000 farms has the environmental commitment. The commitment covers 2.06 mil-
lion ha of fields which is almost 90% of the total field area of farms
applying for direct aid.
The total area covered by the measure concerning balanced use of nutrients is more than
1.8 million ha. The measure restricts the use levels of nitrogen as fertiliser (fertiliser prod-
ucts and animal manure) to a level below that specified in the current legislation. Changes
in the use of mineral nitrogen are followed via the statistics on fertiliser sales.
Measure: Support for balanced use of nutrients continues to be paid in 2017–2020.
3.3.2. Payment to farm advisory services
The measure concerning advisory services under the Rural Development Programme con-
tributes, in particular, to reducing excessive protein feeding by monitoring the nutrient
balances with regard to feeding (utilisation of nitrogen). Advice is also provided on the im-
pact of feeding and output levels of the animals on ammonia emissions. In environmental
advice efforts are made to influence the nutrient balances of a livestock farm as a whole.
To achieve this, action is needed regarding the supplementary training of advisers and the
materials used in the training. Advice is also needed on crop farms using manure and or-
ganic fertiliser products as a source of nutrients for plants.
Measure: Advisory services stress the importance of reducing excessive protein feeding
in the effort to reduce ammonia emissions and of optimising the handling, storage and
spreading of manure.
3.3.3. Animal welfare payment
Some of the measures in the animal welfare payment scheme are such that they contrib-
ute to reducing ammonia emissions, at least indirectly. The written feeding plan based
on calculations for specific groups of animals required under the measure concerning the
feeding and care of bovines, pigs and poultry must take account of the growth of the ani-
mal and its output level and production stage. Feed analysis must be conducted on rough-
age for bovines and sheep. Quantities of milk produced by dairy cows and goats must be
measured and protein analysis must be conducted on supplementary cereal for poultry.
The measure concerning feeding and care was selected by a total of 5,564 farms.
19PUBLICATIONS OF THE MINISTRY OF AGRICULTURE AND FORESTRY 1b/2018
For egg producing farms there is a measure to improve the air quality of laying hen units
where manure is removed from the premises three times a week. The ammonia level in the
air of the unit must be recorded on a weekly basis, and a ceiling has been set for this. A to-
tal of 85 farms have selected this measure.
There is also a measure concerning the grazing and exercise for bovines, sheep and goats,
which may be eligib le for the aid concerning the grazing of animals during pasture sea-
son, exercise outside the pasture season and extending the grazing season. Records must
be kept on the grazing and exercise.
In the animal welfare payment scheme there are also conditions that require more abun-
dant use of bedding in the pens.
Measure: The animal welfare payment scheme is continued in 2017–2020.
3.3.4. Acid treatment of manure
In the future there may also be new technologies available for reducing ammonia emis-
sions. Acid treatment of manure is being used in Denmark and studies on this are under
way in Finland as well. Acidification of manure may take place in the livestock premises,
slurry basin (storage tank) or in connection with spreading on arable land. Acidification
may reduce ammonia emissions 20–80% depending on, for example, the stage of process-
ing in which the acid is added to manure. (Salo et al., 2015)
Measure: Studies on the applicability of the acidification method and its impacts on am-
monia emissions in the Finnish conditions are continued.
20ACTION PLAN TO REDUCE AMMONIA EMISSIONS FROM AGRICULTURE IN FINLAND
4 Structural development in agriculture
There have been significant structural changes in Finnish agriculture since Finland joined
the EU in 1995. In 1995 there were 95 562 farms in Finland, but in 2016 this number was
only about 51,600. This means that the number of farms had fallen by more than 45%. As
the number of farms has decreased their average size has grown from 22.8 hectares of
arable land in 1995 to 44 hectares in 2016. (Niemi & Väre, 2017)
In recent years the change in the production structure of agriculture has been character-
ised by the decrease in the number and share of livestock farms and growth in the share of
crop farms. The number of dairy farms, for example, fell from 31,000 farms in 1995 to 7,318
farms in 2016, while during the same period the number of dairy cows decreased from
398,500 to 282,500. For example between 2005 and 2012 the number of dairy cows fell by
about 10% (Niemi & Väre, 2017). However, during this period the ammonia emissions from
dairy cows decreased by only 7% as nitrogen excretion increased by 9% due to the higher
output level.
In the next few years the strong structural development is expected to continue in live-
stock production. The number of dairy farms is forecast to decrease from the present
about 7,700 farms to 5,200 farms by 2020, while the number of pig farms is expected to
fall from 790 to about 700. The farms that quit production are smaller and their profitabil-
ity is weaker. Very likely their manure stores are not covered, which means that uncovered
manure stores will also become less common. At the same time the farms that expand
their production are obliged to cover the manure stores as they are making new invest-
ments. The remaining livestock units are larger in size and their operations are more re-
source-efficient. Many of the operations that require special machinery and major invest-
ments in machines are outsourced to other entrepreneurs and contractors. Some farmers
may also sell machine contracting services to other farmers. This means that many of the
operations relating to the handling of manure will be carried out more efficiently and with
better professional skill, which reduces the loss of nitrogen, including ammonia emissions.
The high financial risks involved as the production units grow in size cause the farmers to
work even more professionally than before, with the aim to minimise losses and waste and
21PUBLICATIONS OF THE MINISTRY OF AGRICULTURE AND FORESTRY 1b/2018
optimize the economic result. This means that careful optimisation of feeding will also be-
come increasingly common. The change in the operating culture associated with the larg-
er unit size and outsourcing of works contribute to reducing nitrogen losses. The relevant
structural changes in this context include changes in the number of animals, the amount
of nitrogen excreted in animal manure, and size of the production units, resulting in wider
use and better systems for managing slurry, covering of slurry stores and development of
manure spreading systems where less ammonia is caused to evaporate. These structural
changes together with the legislative changes (the Nitrates Decree, in particular), target-
ing of the environment payment scheme, investment aid and increased advisory servic-
es and training, research and cooperation projects will make a significant contribution to
reducing ammonia emissions. In ammonia reduction examination it is taken into account
the development of estimates of animal numbers and changes in manure management
in 2020. About these the decrease of animal numbers is expected to reduce agricultural
ammonia emissions by approximately 1 kt 2014–2020. Nitrogen excretion of animals is es-
timated to remain unchanged.
22ACTION PLAN TO REDUCE AMMONIA EMISSIONS FROM AGRICULTURE IN FINLAND
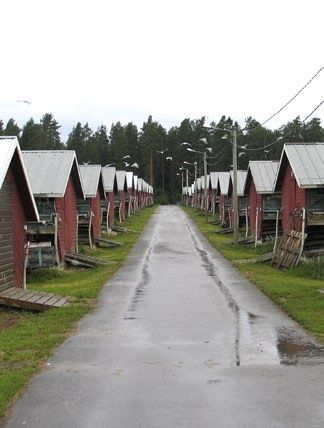
5 Fur farming
5.1. Production
Fur production is strongly concentrated to certain regions of Finland, with most of the
farms located in Ostrobothnia. The production is concentrated within these regions as well.
The trend in the size of fur farms is similar to that of other farms: the number of farms is
decreasing but the volumes produced stay about the same. Now there are about 950 fur
farms in Finland, most of them representing the size classes where an environmental per-
mit is required. Of the ammonia emissions about 10% originate from fur production.
In most cases fur farms have no arable land of their own. Manure is utilised under con-
tracts with other farms which receive the manure and use it as fertiliser. Another common
option is to take the manure to a composting plant, but considering the operations in the
area there are quite few composting plants or other plants that treat animal manure. The
amounts of manure from fur farms represent quite a small share of the total amount of
manure produced by farmed animals, but fur animal manure is very rich in nutrients and it
is being produced in areas where there is a lot of manure from livestock farms as well.
In Finland fur animals are mainly raised in open-sided sheds, where concrete structures are
now being replaced by other types of leak-tight floors. On some mink farms animals are
now raised in halls, but this has not become very common due to the high building costs.
Open-sided sheds with earth floors are also still in use, with intensified environmental pro-
tection measures laid down for these in the environmental permit.
At present an estimated 45% of the fur farms have leak-tight floors and treatment systems
for runoff water have been constructed on about 75% of the large and 60% of other fur
farms. Leak-tight floors are installed when new premises are built or old ones renovated.
In Finland there are also joint fur farming areas with joint composting plants for fur animal
manure.
23PUBLICATIONS OF THE MINISTRY OF AGRICULTURE AND FORESTRY 1b/2018
5.2. Steering instruments and measures reducing ammonia
emissions
5.2.1. Legal measures
Environmental permit
The environmental permit of a fur farm lays down provisions regarding, for example, the
removal and storage of manure. In the case of foxes manure must be removed once or
twice a year and in the case of minks 3 to 4 times a year. The environmental permit requi-
res that all farms use enough bedding, either chopped straw or peat, under the open-si-
ded animal sheds. In fur farming manure removal techniques and design of equipment are
still quite undeveloped.
Nitrates Decree
The storage requirements for fur animal manure are regulated by the Nitrates Decree. Ma-
nure must be stored in a storage facility with a sufficient capacity to store manure pro-
duced during a period of 12 months. According to the Nitrates Decree, all new manure
stores must be covered. Regulations on manure spreading in the Nitrates Decree also ap-
ply to fur animal manure.
5.2.2. Other measures
Environmental protection guide
The Ministry of the Environment is preparing an environmental protection guide for fur
farming, including measures to reduce ammonia emissions from the handling and storage
of manure. The guide will also be used in the provision of advice.
Measure: An environmental protection guide is prepared for fur farming.
Payment to farm advisory services
The measure concerning farm advisory services in the Rural Development Programme
for Mainland Finland may contribute to reducing ammonia emissions from fur farming as
well. Knowledge on the climate impacts of fur farming should be enhanced by providing
further training and teaching material for advisers.
Measure: More advice is provided on climate protection in fur farming, with particular fo-
cus on means to reduce ammonia emissions in the handling and storage of manure.
Research
More research is needed on the environmental impacts of fur farming, means to reduce
the harm and their costs, and utilisation of fur animal manure.
24ACTION PLAN TO REDUCE AMMONIA EMISSIONS FROM AGRICULTURE IN FINLAND
6 Action plan to reduce ammonia
emissions from agriculture in Finland in
2017–2020
This action plan applies only to the reduction of ammonia emissions from agriculture. In
Finland the ammonia emission reduction obligations are based on international commit-
ments on the reduction of emissions into the air (see Chapter 1). Ammonia emissions in
Finland should not exceed 31 kt per year. The emissions reduction obligation has been in
force since 2010. In 2015 ammonia emissions were 31.8 kt, of which the share of agricul-
ture was 28.8 kt.
Both total ammonia emissions and agricultural emissions have had a slight downward
trend throughout the 2010s with the exception of 2014 (Table 1). The need to reduce am-
monia emissions from agricultural sources is about 5.5 kt. From 2020, the emission reduc-
tion obligation will become relative instead of being considered in absolute terms. The
ammonia emission reduction commitment for Finland is 20% compared to the emissions
in 2005.
An updated agricultural emission model has been utilised in the preparation of the action
plan (Grönroos et al. 2017).
25PUBLICATIONS OF THE MINISTRY OF AGRICULTURE AND FORESTRY 1b/2018
The most significant measures to reduce ammonia emission are the following:
• spreading of slurry and urine by injection, and band spreading
−− Initial level: In 2012 ca. one third of slurry and urine was spread by injection, while
the share of band spreading was about a quarter.
• covering manure stores
−− Initial level: In 2012 ca. 55 % of the storage volume of pig slurry was covered. Of
the bovine slurry ca. a quarter was covered with a fixed or floating cover and the
rest was covered with natural crust. The situation is assumed to have been about
the same in 2014.
In addition, ammonia emissions in 2017–2020 will be influenced by technological and
structural development in agriculture, intensified/improved nutrient recycling measures
under the Government Programme, more accurate feeding and measures in fur produc-
tion. The change in animal numbers is estimated to reduce ammonia emissions by about
1.0 kt 2014–2020. The impact of improved nutrient recycling and more accurate feeding
on ammonia emissions were not estimated here.
Table 7 summarises the measures to reduce ammonia emissions in 2017–2020.
26ACTION PLAN TO REDUCE AMMONIA EMISSIONS FROM AGRICULTURE IN FINLAND
Table 7. An action plan to reduce ammonia emissions from agriculture from 2017 to 2020. Ammonia emis-
sions from agriculture were 30.2 kt in 2014 and in 2020, they would be 26.6 kt (-3.6 kt).
Year Measure Tool Cumulative Total
reduction agricultural
(total and split*) emissions kt
2014 as
reference (kt)
2014 • 33% of slurry and urine injected 30.2
• 27% of slurry and urine applied by band
spreading
• Manure spread on soil surface was mainly
incorporated within 24 hours
• Ca. 55% of pig slurry storage volume was
covered
• Ca. quarter of bovine slurry was stored
under fixed or floating cover, the rest was
covered with natural crust
2015 • 55% of slurry and urine injected • Injection of slurry, 1.4 kt 30.2-1.4=28.8
• 25% of slurry and urine applied by band covering manure stores – an: 0.12 kt
spreading (investment aid) – cov: 0.03 kt
• Manure spread on soil surface • Nitrates Decree – app: 1.25 kt
incorporated within 24 hours
• Covering manure stores
2016 • 60% of slurry and urine injected • Injection of slurry, 1.8 kt 28.8-0.4=28.4
• 30% of slurry and urine applied by band covering manure stores – an: 0.24 kt
spreading (investment aid) – cov: 0.06 kt
• Manure spread on soil surface • Nitrates Decree – app: 1.50 kt
incorporated within 24 hours
• Covering manure stores
2017 • 60% of slurry and urine injected • Injection of slurry, 2.2 kt 28.4-0.4=28.0
• 30% of slurry and urine applied by band covering manure stores – an: 0.36 kt
spreading (investment aid) – cov: 0.09 kt
• Manure spread on soil surface • Nitrates Decree – app: 1.75 kt
incorporated within 24 hours
• Covering manure stores
2018 • 65% of slurry and urine injected • Injection of slurry, 2.7 kt 28.0-0.5=27.5
• 30% of slurry and urine applied by band covering manure stores – an: 0.48 kt
spreading (investment aid) – cov: 0.12 kt
• Manure spread on soil surface • Nitrates Decree – app: 2.10 kt
incorporated within 24 hours
• Covering manure stores
2019 • 65% of slurry and urine injected • Injection of slurry, 3.1 kt 27.5-0.4=27.1
• 30% of slurry and urine applied by band covering manure stores – an: 0.60 kt
spreading (investment aid) – cov: 0.15 kt
• Manure spread on soil surface • Nitrates Decree – app: 2.35 kt
incorporated within 24 hours
• Covering manure stores
2020 • 70% of slurry and urine injected • Injection of slurry, 3.6 kt 27.1-0.5=26.6
• 30% of slurry and urine applied by band covering manure stores – an: 0.72 kt
spreading (investment aid) – cov: 0.18 kt
• Manure spread on soil surface • Nitrates Decree – app: 2.70 kt
incorporated within 24 hours
• Covering manure stores
* abbreviations: an = animal numbers; cov = manure stores covered; app: manure application measures
27PUBLICATIONS OF THE MINISTRY OF AGRICULTURE AND FORESTRY 1b/2018
7 Monitoring of the action plan
Agricultural and environmental authorities jointly monitor the realisation of emission re-
ductions on an annual basis. Farms participating in the environment payment scheme
(86% of the farms that applied for support payments) declare the amounts of manure ap-
plied by injection to the agricultural authorities each year. Agricultural investment aid also
aims to guide farmers to invest in solutions that reduce emissions. Investments in covering
of manure storages are being monitored and recorded on an annual basis according to
both the size and volume of manure stores.
The evaluation of the Rural Development Programme provides information on how much
the measures under the programme reduce ammonia emissions (sample study). These
estimates will be available in summer 2019 as part of the expanded annual report on the
programme.
To ensure the achievement of emission reductions, farmers are told about the changes in
the operating environment, new research findings and measures to reduce emissions and
encouraged to adopt these. Farm advisory services have a significant role in this, and more
advice will be provided and targeted in a way that reductions in ammonia emissions can
be achieved. At present most of the environmental measures, such as manure injection,
are voluntary, but if the obligations are not met, other options for reducing emissions will
have to be considered.
28ACTION PLAN TO REDUCE AMMONIA EMISSIONS FROM AGRICULTURE IN FINLAND
8 Compliance with the reduction
obligations
When ammonia emissions from agriculture are reduced as set out in Table 7, these emis-
sions will be 26.6 kt in 2020. However, this emission estimate does not include all the ex-
pected changes in agriculture, such as changes in nitrogen excretion of animals and in
the use of mineral nitrogen fertilizers. Considering the estimated changes in these fac-
tors, agricultural emissions would be somewhat higher than the above mentioned 26.6 kt.
Nevertheless, the total emissions of ammonia in Finland in 2020 would be around 29.6 kt,
which is very close to the 2020 obligation – 20% of 2005 emissions (29.2 kt). It is estimated
that emissions will continue to decline after 2020, mainly as a result of reduction in animal
numbers.
29PUBLICATIONS OF THE MINISTRY OF AGRICULTURE AND FORESTRY 1b/2018
9 Emission inventories adjustment
The so-called emission inventories adjustments are taken into account when assessing
compliance with the emission reduction obligations. Countries can apply for the inventory
adjustment from the implementing body of the Gothenburg Protocol to the ECE Conven-
tion on Long Range Transboundary Air Pollution, if their calculation methodology or emis-
sion factors have changed due to scientific advancement, causing emission requirements
to be exceeded. Changes in the operations are not eligible for inventory adjustments. The
ECE has approved applications of Finland concerning adjustments in ammonia emissions
for small-scale combustion and transport, but not for agriculture. The adjustments are
shown in Table 8. The approved adjustment is valid for a certain number of years, in this
case until 2020. Reporting on the approved adjustment must be done on an annual basis,
and if there are any changes in the method a new application for adjustment must be sub-
mitted. In the future the adjustment is likely to also be applicable to the obligations under
the NEC Directive. With the development of emission inventories, the emissions have fall-
en faster than anticipated and no adjustments are likely to be needed in the future.
Table 8. Adjustment of ammonia emissions in Finland 2010–2014.
Approved adjustments 2010 2011 2012 2013 2014
NH3 kt – 2.05 – 1.85 – 1.85 – 1.72 – 1.57
30ACTION PLAN TO REDUCE AMMONIA EMISSIONS FROM AGRICULTURE IN FINLAND
References
Finlex. (2014). Valtioneuvoston asetus 1250/2014 eräiden maa- ja puutarhataloudesta peräisin olevien
päästöjen rajoittamisesta. http://www.finlex.fi/fi/laki/alkup/2014/20141250. Finlex.
Grönroos, J. (2014). Maatalouden ammoniakkipäästöjen vähentämismahdollisuudet ja -kustannukset,
Ympäristöministeriön raportteja 26/2014. Ympäristöministeriö.
Grönroos, J., Munther, J. & Luostarinen, S. 2017. Calculation of atmospheric nitrogen and NMVOC emissions
from Finnish agriculture. Description of the revised model. Reports of the Finnish Environment Institute
37/2017. 60 p.
Lehtonen, H. (2016). E-postmeddelande 14.11.2016. Naturresursinstitutet, LUKE.
Luostarinen, S., Grönroos, J., Hellstedt, M., Nousiainen, J. & Munther, J. 2017. SUOMEN NORMILANTA – lasken-
tajärjestelmän kuvaus ja ensimmäiset tulokset. Luonnonvara- ja biotalouden tutkimus 47/2017: 54 s.
Niemi, J. & Väre, M. (2017). Suomen maa- ja elintarviketalous 2016/2017. Luke, Luonnonvara- ja biotalouden
tutkimus 17/2017.
Salo, T.; Grönroos, J.; Luostarinen, S.; Kapuinen, P.; Manninen, K.; Rankinen, K. ym. (2015). Lietelannan
happokäsittely lannan ravinteiden käytön tehostamisen tukena. Luke, Luonnonvara- ja biotalouden
tutkimus 56/2015.
Suomen ympäristökeskus. (2016). Air Pollutant Emissions in Finland 1980–2014. Informative
inventory report to the UNECE CLRTAP. Finnish Informative Inventory report 2016.
http://cdr.eionet.europa.eu/fi/un/UNECE_CLRTAP.
UNECE. The 1999 Gothenburg Protocol to Abate Acidification, Eutrophication and Ground-level Ozone .
http://www.unece.org/env/lrtap/multi_h1.html.
Ympäristöministeriö. (2014). Muistioluonnos. Valtioneuvoston asetus eräiden maa- ja
puutarhataloudesta peräisin olevien päästöjen rajoittamisesta.
http://www.ym.fi/download/noname/%7B676B3B3D-9BFF-4DAA-BE57-699D59480697%7D/57284.
Ympäristöministeriö.
31You can also read