Evaluation Measures for Event Detection Techniques on Twitter Data Streams - KOPS
←
→
Page content transcription
If your browser does not render page correctly, please read the page content below
Erschienen in: Data Science : 30th British International Conference on Databases, BICOD 2015, Edinburgh, UK, July 6-8, 2015;
Proceedings / Sebastian Maneth (Hrsg.). - Cham [u.a.] : Springer, 2015. - (Lecture Notes in Computer Science ; 9147). - S. 108-119. -
                                  ISSN 0302-9743. - eISSN 1611-3349. - ISBN 978-3-319-20423-9
                                          https://dx.doi.org/10.1007/978-3-319-20424-6_11

                         Evaluation Measures for Event Detection
                           Techniques on Twitter Data Streams

                            Andreas Weiler(B) , Michael Grossniklaus, and Marc H. Scholl

                        Department of Computer and Information Science, University of Konstanz,
                                       P.O. Box 188, 78457 Konstanz, Germany
                        {andreas.weiler,michael.grossniklaus,marc.scholl}@uni-konstanz.de

                          Abstract. Twitter’s popularity as a source of up-to-date news and
                          information is constantly increasing. In response to this trend, numer-
                          ous event detection techniques have been proposed to cope with the rate
                          and volume of social media data streams. Although most of these works
                          conduct some evaluation of the proposed technique, a comparative study
                          is often omitted. In this paper, we present a series of measures that we
                          designed to support the quantitative and qualitative comparison of event
                          detection techniques. In order to demonstrate the effectiveness of these
                          measures, we apply them to state-of-the-art event detection techniques
                          as well as baseline approaches using real-world Twitter streaming data.

                 1      Introduction
                 Microblogging is a form of social media that enables users to broadcast short mes-
                 sages, links, and audiovisual content to a network of followers as well as to their
                 own public timeline. In the case of Twitter, the most popular and fastest-growing
                 microblogging service, these so-called tweets can contain up to 140 characters.
                 Twitter’s 288 million monthly active users produce a total of over 500 million
                 tweets per day1 . As a consequence, several proposals have been made to lever-
                 age Twitter as a source of up-to-date news and information, e.g., to respond to
                 natural disasters [13], to track epidemics [7], or to follow political elections [17].
                     A number of techniques have been designed and developed to detect such
                 events in the Twitter social media data stream. Typically, they adopt the defini-
                 tion of an event introduced by research on Topic Detection and Tracking (TDT),
                 i.e., a real-world occurrence that takes place in a certain geographical location
                 and over a certain time period [2]. The main focus of these event detection tech-
                 niques lies in addressing the specific requirements introduced by Twitter data,
                 such as the brevity of tweets together with the fact that they contain a substan-
                 tial amount of spam, typos, slang, etc. Although most proposals provide some
                 qualitative evidence to motivate the benefits of the technique, few perform a
                 quantitative evaluation or compare their results to competing approaches.
                     We argue that this lack of comparative evaluation is explained by the fact
                 that measuring the quantitative and qualitative performance of event detection
                  1
                      https://about.twitter.com/company/.

                                        Konstanzer Online-Publikations-System (KOPS)
                                    URL: http://nbn-resolving.de/urn:nbn:de:bsz:352-0-300924
109 techniques for Twitter data is itself a challenging research question. Crafting a gold standard manually in order to use textbook precision and recall measures is painstakingly slow and does therefore not scale to the volumes of data generated by Twitter users. In order to address this requirement, we build on our previous work in this field [15] and, in this paper, propose several scalable measures that can be automatically applied to the results of current and future event detection techniques. The specific contributions of this paper are as follows. 1. Definition of evaluation measures to automatically evaluate the precision and recall of event detection techniques for Twitter (Sect. 3). 2. Realization of several state-of-the-art event detection techniques as query plans for a data stream management (Sect. 4). 3. Detailed study using real-life Twitter data that demonstrates the ability of our measures to evaluate the different techniques (Sect. 5). As our evaluation approach is platform-based and modular, it will also enable further systematic performance studies of future event detection techniques. 2 Background Several event detection techniques for Twitter data streams have recently been proposed. Farzindar and Khreich [8] survey sixteen techniques and conclude that most approaches are evaluated by self-defined measures with manually labeled reference data sets. Also, almost none of the reviewed techniques are compared to competing approaches. In the following, we summarize what evaluations have been performed by the authors of the most-cited approaches and what corpora are currently available for evaluation purposes. Our findings show that neither the works discussed below nor the sixteen in the above-mentioned survey provide a general solution that can be used to evaluate approaches comparatively. 2.1 Evaluation of Event Detection Approaches enBlogue [3] identifies unusual shifts in the co-occurrence of tag pairs and reports these shifts as events, which are rated in terms of quality in a user study. Twitter- Monitor [9] detects “bursty” keywords and then groups them into trends, which are visualized in order for users to decide whether a trend is interesting or not. Cordeiro [6] proposes the use of continuous wavelet analysis to detect event peaks in a signal based on hashtags frequency and summarizes the detected events into topic clusters with latent dirichlet allocation (LDA [5]). The technique is evalu- ated using a visualization of the results obtained from an eight day dataset with 13.6 million tweets. All of these manual evaluations are, however, not general in the sense that they do not scale and might suffer from human error or bias. Weng et al. [17] present a technique that uses term frequencies of individual terms as a signal for discrete wavelet analysis to detect event terms. Then, graph partition- ing is used to group similar terms into events. The approach is evaluated using a custom ground truth that is built using LDA on a dataset containing of 4,331,937
110

tweets collected from Singapore-based users. After cleaning and filtering, a total
of 8,140 unique words are retained per month of Twitter data. Detected events
are compared to this ground truth on a daily basis. The result of this evaluation
is that detected events are plausible, but also that there are several days with
no events detected. Since event detection is often time-critical and events should
be reported in (near) real-time, this coarse evaluation technique is not suited for
general evaluations.

2.2   Available Corpora for Evaluation
In our work, we propose to address the problem of comparing various event
detection techniques by defining general evaluation measures. In contrast to our
approach, which does not rely on an existing reference data set, other works focus
on the creation of evaluation corpora for Twitter-related analysis techniques.
    For example, McCreadie et al. [10] created a set of approximately 16 million
tweets for a two-week period. The proposed corpus contains an average of 50,000
tweets per hour, which is almost equal to the number of tweets per minute in our
10 % stream. Since no language filtering is performed, which can be estimated
to retain approximately 30 % (see Fig. 2) of these tweets, only about 4,800,000
tweets are in English. Furthermore, their list of 49 reference topics for the two-
weeks period is very limited and no description is given how these topics were
created. Finally, this corpus focusses on ad-hoc retrieval tasks and is, therefore,
not suited for the large-scale evaluation of event detection approaches. Becker
et al. [4] created a Twitter corpus, that consists of over 2,600,000 Twitter mes-
sage posted during February 2010. Since they only used their own approach to
detect events, the corpus is strongly biased to their technique and not suited for
general evaluation purposes. Furthermore, no list of reference events is provided
and the data set is restricted to tweets from users located in New York City.
Petrović et al. [12] presented a corpus of 50 million tweets, created from a man-
ual analysis of the Twitter data stream between July 2011 and mid-September
2011, which led to the definition of 27 events for the whole time-frame. This
very low number of “hits” makes it difficult to compare different event detec-
tion methods, if techniques used are very different. McMinn et al. [11] propose a
methodology to create a corpus for evaluating event detection approaches. They
used existing event detection techniques [1, 12] together with Wikipedia to build
a set of candidate events and associated tweets. The final corpus covers four
weeks with about 120 million tweets and more than 500 events. However, since
events are given in prose, they cannot be compared automatically to results
of event detection techniques. It is important to note that all of these corpora
only consist of tweet identifiers. To use them, the tweets themselves have to be
crawled, which can be time-consuming and error-prone as some tweets might
not exist anymore.

3     Measures
In order to address the lack of a common evaluation method for event detection
in Twitter data streams, we propose a number of measures. Our goal is to define
111
measures that can easily be used by other researchers and that do not depre-
cate over time as most reference corpora do. While all of our measures support
relative comparisons, we do not claim that they can be used to draw absolute
conclusions. A single event detection technique can, therefore, only be evaluated
“against itself”, e.g., with respect to different parameter settings or to confirm
that improvements to the technique yield better results. For a set of techniques,
the measures can be used to rank them with respect to different criteria. In this
paper, we focus on the second application.
Run-Time Performance. We measure run-time performance as the number of
tweets that an approach processes per second. This measure is important to judge
the feasibility of a technique. Most event detection techniques can be configured
based on numerous parameter that influence both the processing speed and result
quality. In combination with other measures, the run-time performance measure
can, therefore, also be used to study the trade-off between these two objectives.
Duplicate Event Detection Rate (DEDR). This measure captures the per-
centage of duplicate events detected by an approach. The implementations of
state-of-the-art event detection techniques used in this paper avoid the reporting
of duplicate events within their processing time-frame, e.g., a one-hour window.
Nevertheless, important or long-lasting events can reoccur across several time-
frames and, therefore, expecting a 0 % rate of duplicate events is not reasonable.
Precision. Our precision measure is composed of two components. First, we
query Google using the five event terms and a specific date range as search query
input. Doing so, we are able to verify if the detected event has been described
by an important article returned by Google for the corresponding time frame.
As important articles we define search results that are from one of the top 15
news websites such as CNN, CBSNews, USAToday, BBC, and Reuters. For the
second part of our precision measure, we query the archive of the New York
Times2 with the five event terms as well as the specific date range. Since the
number of hits (h), which are in the range between 0 and 10 both for Google
(hG ) or New York Times (hNYT ), is an indicator of how important a reported
event is, we calculate the final precision score for all results (N ) by weighting
the single results as
N
1 1 G 1 NYT
h + hi .
N i=0 2 i 2
Recall. We propose to calculate recall by crawling the world news headlines on
the Reuters website3 for the days corresponding to the analysis. Each headline
is represented as a list of terms T hl . With this measure we intend to reflect the
percentage of detected events with respect to important news appearing on a
real-world news archive. To weigh the single results, we check for each term in
a news headline, which reported event, represented as a list of terms T e , has
2
http://query.nytimes.com/search/sitesearch/.
3
http://www.reuters.com/news/archive/worldNews?date=02112015/.112
the maximal similarity value (max sim). Since we exclude matches on one term
only, this similarity value can either be two, three, four, or five terms. With this
weighting, we calculate the final recall score for all headlines (N) as
N
1 1
max sim(Tihl , T e ).
N i=0 2
4 Event Detection Approaches
In order to realize streaming implementations of state-of-the-art event detection
techniques for Twitter, we use Niagarino4 , a data stream management system
developed and maintained by our research group. The main purpose of Niagarino
is to serve as an easy-to-use and extensible research platform for streaming appli-
cations such as the ones presented in the paper. Based on its operator-based
processing pipeline our implementations are modular and can be easily config-
ured. For example, we can configure the approaches to report the same number
of events, which are represented as one main event term together with four asso-
ciated event description terms. Using a common implementation platform also
has the advantage that run-time performance results can be compared fairly.
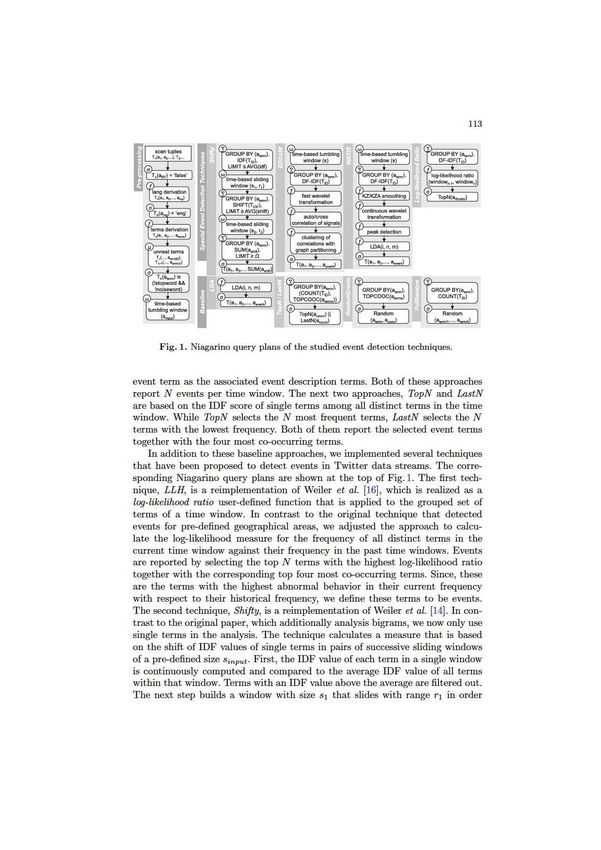
For the evaluation of our measures we take nine different approaches
into account. Figure 1 shows the Niagarino-based implementations of these
approaches. Additionally, the pre-processing pipeline, which is used by all
approaches, is shown on the left. The pre-processing removes all non-English
tweets and retweets. Then, it tokenizes and unnests the terms of the remaining
tweets. It also discards terms that can be classified as stop-words or as noise (e.g.,
too short, invalid characters, etc.). Finally, a tumbling window of size sinput is
continuously applied and its contents are forwarded to the subsequent operators.
At the bottom of Fig. 1, the query plans for LDA, TopN, LastN, Ran-
domEvents (RE), and FullRandom (FR) are shown. Since these approaches are
not specifically tailored to the task of event detection, we use them as baseline
approaches in order to confirm that the proposed measures are discriminating.
LDA [5] uses the probabilities of terms in documents and groups those terms
together that have the highest probability of belonging together. We realized
LDA in Niagarino based on its user-defined function operator. Since LDA is
normally used for topic modeling, we equate a topic to an event. The parame-
ters that can be set for this approach include the number of topics, the number
of terms per topic, and the number of iterations of the probability modeling. As
there are a lot of repeating terms in tweets and also per time window, we expect
that this technique is not suitable for event detection and therefore classify it as
a baseline method. The other four baseline techniques use a grouping operator
followed by a selection operator. FR constructs “events” by randomly selecting
five terms from all distinct terms in a time window. RE selects the main event
term in the same way as FR, but uses the four most co-occurring terms of the
4
http://www.informatik.uni-konstanz.de/grossniklaus/software/niagarino/.113
lw). (w).
[llme·based tumbling
window(s)
j '1lme-baS114
to calculate the shift from one window to the next. In this step, the shift value
is again checked against the average shift of all terms and only terms with a
shift above the average are retained. In the last step, a new sliding window with
size s2 that slides with range r2 is created. The total shift value is computed
as the sum of all shift values of the sub-windows of this window. If this total
shift value is greater than the pre-defined threshold Ω, the term is detected as
event and reported together with its top four co-occurrence terms. The third
technique, WATIS, is an implementation of Cordeiro [6]. The algorithm parti-
tions the stream into intervals of s seconds and builds DF-IDF signals for each
distinct term. Due to the noisy nature of the Twitter data stream, signals are
then processed by applying an adaptive Kolmogorov-Zurbenko filter (KZA), a
low-pass filter that smoothens the signal by calculating a moving average with
ikza iterations over N intervals. It then uses a continuous wavelet transforma-
tion to construct a time/frequency representation of the signal and two wavelet
analyses, the tree map of the continuous wavelet extrema and the local maxima
detection, to detect abrupt increases in the frequency of a term. In order to
enrich events with more information, the previously mentioned LDA algorithm
(with iLDA iterations) is used to model one topic consisting of five terms. After
the LDA phase the event is reported. Finally, the fourth technique, EDCoW, is
an implementation of Weng et al. [17]. The first step of the algorithm is to parti-
tion the stream into intervals of s seconds and to build DF-IDF signals for each
distinct term in the interval. These signals are further analyzed using a discrete
wavelet analysis that builds a second signal for the individual terms. Each data
point of this second signal summarizes a sequence of values from the first signal
with length Δ. The next step then filters out trivial terms by checking the cor-
responding signal auto-correlations against a threshold γ. The remaining terms
are then clustered to form events with a modularity-based graph partitioning
technique. Insignificant events are filtered out using a threshold parameter .
Since this approach detects events with a minimum of two terms, we introduced
an additional enrichment step that adds the top co-occurring terms to obtain
events with at least five terms. Since the original paper fails to mention the
type of wavelet that was used, we experimented with several types. The results
reported in this paper are based on the Discrete Meyer wavelet.
5 Evaluation
In order to demonstrate that the measures proposed in this paper are discrim-
inating, we run experiments against three different real-world Twitter stream
datasets (consisting of five days each) that we collected. The three datasets
respectively contain the days of February 1 to 6, 11 to 16, and 21 to 26,
2015 (EST). By using the Gardenhose access of the Twitter streaming API,
we are able to obtain a randomly sampled 10 % stream of all public tweets.
The collection contains an average of 2.2 million tweets per hour and almost 50
million tweets per day. We pre-filtered the dataset for tweets with English lan-
guage content by using a pre-existing Java library5 . After this step, the dataset
5
https://code.google.com/p/language-detection/.115
3000000
Total English
2500000
2000000
1500000
1000000
500000
0
Fig. 2. Average hourly total and English tweets for all three datasets.
contains an average of 660,000 tweets per hour and 16 million tweets per day.
Figure 2 shows the distribution of the total and the English number of tweets
per hour for each day as an average of all three datasets.
5.1 Experimental Setup
The event detection techniques that we use for our evaluation have all been
defined with slightly different use cases in mind. In order to fairly compare
them, we defined a common task that all of the techniques can accomplish. As
we are interested in (near) real-time event detection, we set the length of the
time-window used for event reporting to one hour. This means that after each
hour of processing the techniques need to report the results obtained so far.
Note that within the time window of one hour no duplicate events are possible
for any technique. As the number of events reported by the different techniques
may vary significantly (depending on the parameter settings), we adjusted the
parameters of each technique to report a number of events in a certain range.
For techniques, for which the number of detected events is based on a single
parameter N, we set this parameter to obtain 15 events per hour, which results
in 1800 events per dataset. Note that some techniques report a few events with
less than five terms, which are discarded. We compensated for this behavior by
adjusting the parameters of such event detection techniques accordingly. Table 1
summarizes the parameter settings used. Note, however, that these settings are
purely required to obtain comparable output and might not correspond to the
optimal settings for each techniques. Also, it is unlikely that events are uniformly
distributed over the hours of a day. Using these setting, we obtain 1,745 events
for Shifty, 1,520 for WATIS, and 2,020 for EDCoW.
Table 1. Parameter settings for Shifty, WATIS, and EDCoW.
Approach Parameters
Shifty sinput = 1 min, s1 = 2 min, r1 = 1 min, s2 = 4 min, r2 = 1 min, Ω = 30
WATIS s = 85 s, N = 5 intervals, ikza = 5, ilda = 500
EDCoW s = 10 s, N = 32 intervals, γ = 1, = 0.2116
5.2 Results
In the following, we present the results of our evaluation. Note, that we sum-
marized the results of both datasets as an average. First, we start with the
run-time performance. Run-time performance was measured using Oracle Java
1.8.0 25 (64 bit) on server-grade hardware with 2 Intel Xeon E5345s processors
at 2.33 GHz with 4 cores each and 24 GB of main memory.
Figure 3 shows the run-time
performance results for all tech- 14000
niques measured in terms of 12000
average throughput (tweets/ 10000
Tweets/sec
second) for all three datasets. 8000
The baseline techniques, except 6000
for LDA, as well as the LLH 4000
technique achieve the highest 2000
throughput with around 12,000 0
LastN FR RE LDA TopN LLH Shifty WATIS EDCoW
tweets/second. The rate of our
Shifty technique is lower at Fig. 3. Run-time performance.
around 8,000 tweets/second. How-
ever, it should be noted that Shifty is the only online technique that processes the
input incrementally. Therefore, Shifty’s performance does not depend on changes
to the reporting schedule that we used (after each hour), which will affect the
throughput of all other approaches. In contrast to WATIS, EDCoW scores very
well. Since WATIS uses LDA at the end of processing to create the final events,
this result is not surprising. As we see, applying LDA with 500 iterations is the
slowest approach with around 1,700 tweets/second. If we take into account the
50 million tweets per day (∼ 580 per second) of the 10 % stream, we can observe
that all techniques could process this stream in (near) real-time and are there-
fore feasible. However, if these techniques were applied to the full 100 % stream
(∼ 5, 800 tweets per second), WATIS and LDA would not be feasible. Based on
these observations, we conclude that our measure for run-time performance is
discriminating and can be used to judge the feasibility of approaches.
In contrast to run-time performance, the remaining three measures assess
the task-based performance, i.e., the quality of an event detection technique. To
further evaluate our measures, we also include the results of applying them to
the so-called Trending Topics (TT) of Twitter in the following discussion. We
collected the top 15 trending topics and enriched them by querying the Twitter
API for the most current tweets belonging to each topic. The enrichment process
also tokenizes and cleans the obtained tweets, and summarizes the five most co-
occurring terms to a final event. Hereby, we also get 1,800 events per dataset. We
begin by presenting the results obtained from our DEDR measure. For each tech-
nique, we calculate the percentage of events, which are classified as duplicates.
As this classification is configurable, we present results obtained by requiring
that one, two, three, four, or all five event terms need to be equal (DEDR1, . . . ,
DEDR5 ). Figure 4 plots the average results of the duplicate event detection rate
for all datasets. We can observe that all techniques report a very high number117
1.2
DEDR1 DEDR2 DEDR3 DEDR4 DEDR5
1.0
0.8
0.6
0.4
0.2
0.0
LastN FR RE LDA TopN LLH Shifty WATIS EDCoW TT
Fig. 4. Average duplicate event detection rate.
of duplicates for DEDR1. Since the terms of FR and RE are randomly chosen,
they generally report a lower number of duplicates. From the event detection
techniques, the results for Shifty, WATIS, and EDCoW closely resemble the
results of applying our DEDR measure to TT, whereas the all other approaches
have significantly different profiles. We therefore argue that DEDR is a useful
measure to characterize event detection techniques.
For the evaluation of our precision and recall measures, we only use events
that were not filtered out by DEDR3, i.e., all events with three or more com-
mon terms are removed from the result set and only the remaining non-duplicate
events are further analyzed. Note that this results in an implicit inclusion of the
DEDR measure in our precision and recall measures. Figure 5 shows the aver-
age precision, recall, and F-measure over all three data sets for all techniques.
Based on these measure, we observe that all of the dedicated event detection
techniques clearly outperform the baseline approaches. This finding confirms
the validity of the precision and recall measure proposed in this paper. We con-
clude our evaluation by discussing the results shown in Fig. 5 in more detail.
First, we note that the scores are generally very low. However, since we are only
interested in relative comparisons, this is not a problem. Among the baseline
approaches, both LDA and RE score comparable to dedicated event detection
techniques with respect to specific measures. The precision of LDA is higher
than the one of LLH and Shifty, RE scores well in terms of recall. In both cases,
this result can be explained with the way these approaches work. Also, it demon-
strates the importance of studying both precision and recall, which we support
with our F-measure. The best approaches according to our measures are the
advanced WATIS and EDCoW techniques, which are also the most cited event
detection techniques. Since EDCoW produces the most events of all techniques,
its parameters could also be adjusted to increase its precision score. Also, the
basic enrichment process that we implemented for EDCoW could be improved.
For example, WATIS uses LDA for the same purpose and scores very well in
terms of recall. Our own techniques, LLH and Shifty, do not perform as well as
the two advanced techniques. However, we note that Shifty is the only online
event reporting technique and therefore only uses very short time intervals (of
four minutes in this case) instead of a full hour to classify terms as events.118
0.4
Precision
Recall
0.3
FMeasure
0.2
0.1
0.0
LastN FR RE LDA TopN LLH Shifty WATIS EDCoW TT
Fig. 5. Precision, Recall, and F-Measure of all techniques.
Additionally, we do not use bigrams in this paper as opposed to the original
Shifty algorithm. LLH was originally designed to use both the spatial and the
time dimension to detect unusual rates of terms in pre-defined geographical areas
over time. In this paper, we only use the time dimension, which has weakened
the performance of the approach. Finally, our measures assign high precision and
recall scores to the Twitter Trending Topics (TT ). However, in contrast to our
results, TT is based on the full 100 % stream.
6 Conclusions
In this paper, we have addressed the lack of quantitative and comparative evalu-
ation of event detection techniques by proposing a number of measures, both for
run-time and task-based performance. In contrast to previous evaluation meth-
ods, all our measures can be automatically applied to evaluate large results sets
without the requirement of an existing gold standard. In order to demonstrate
the validity of our proposed measures, we have studied them based on several
baseline approaches and state-of-the-art event detection techniques. We have
shown that our measures are able to discriminate between different techniques
and support relative comparisons.
As future work, we plan to further confirm the findings presented in this paper
by implementing additional event detection techniques, such as enBlogue [3],
in our evaluation framework. Based on these fully validated measures, we will
tune the parameters of each technique, which will enable us to draw absolute
conclusions about their performance.
Acknowledgement. We would like to thank our students Christina Papavasileiou
and Harry Schilling for their contributions to the implementations of WATIS and
EDCoW.
References
1. Aggarwal, C.C., Subbian, K.: Event detection in social streams. In: Proceedings of
the SIAM International Conference on Data Mining (SDM), pp. 624–635 (2012)119
2. Allan, J.: Topic Detection and Tracking: Event-based Information Organization.
Kluwer Academic Publishers, The Netherlands (2002)
3. Alvanaki, F., Michel, S., Ramamritham, K., Weikum, G.: See what’s enBlogue:
real-time emergent topic identification in social media. In: Proceedings of
the International Conference on Extending Database Technology (EDBT),
pp. 336–347 (2012)
4. Becker, H., Naaman, M., Gravano, L.: Beyond trending topics: real-world event
identification on twitter. In: Proceedings of the International Conference on
Weblogs and Social Media (ICWSM), pp. 438–441 (2011)
5. Blei, D.M., Ng, A.Y., Jordan, M.I.: Latent dirichlet allocation. J. Mach. Learn.
Res. 3, 993–1022 (2003)
6. Cordeiro, M.: Twitter event detection: combining wavelet analysis and topic infer-
ence summarization. In: Proceedings of the Doctoral Symposium on Informatics
Engineering (DSIE) (2012)
7. Culotta, A.: Towards detecting influenza epidemics by analyzing twitter messages.
In: Proceedings of the Workshop on Social Media Analytics (SOMA), pp. 115–122
(2010)
8. Farzindar, A., Khreich, W.: A survey of techniques for event detection in twitter.
Comput. Intell. 31(1), 132–164 (2015)
9. Mathioudakis, M., Koudas, N.: TwitterMonitor: trend detection over the twitter
stream. In: Proceedings of the International Conference on Management of Data
(SIGMOD), pp. 1155–1158 (2010)
10. McCreadie, R., Soboroff, I., Lin, J., Macdonald, C., Ounis, I., McCullough, D.: On
building a reusable twitter corpus. In: Proceedings of the International Conference
on Research and Development in Information Retrieval (SIGIR), pp. 1113–1114
(2012)
11. McMinn, A.J., Moshfeghi, Y., Jose, J.M.: Building a large-scale corpus for evalu-
ating event detection on twitter. In: Proceedings of the International Conference
on Information and Knowledge Management (CIKM), pp. 409–418 (2013)
12. Petrović, S., Osborne, M., Lavrenko, V.: Using paraphrases for improving first
story detection in news and twitter. In: Proceedings of the Conference of the North
American Chapter of the Association for Computational Linguistics: Human
Language Technologies (NAACL HLT), pp. 338–346 (2012)
13. Sakaki, T., Okazaki, M., Matsuo, Y.: Earthquake shakes twitter users: real-time
event detection by social sensors. In: Proceedings of the International Conference
on World Wide Web (WWW), pp. 851–860 (2010)
14. Weiler, A., Grossniklaus, M., Scholl, M.H.: Event identification and tracking in
social media streaming data. In: Proceedings of the EDBT Workshop on Multi-
modal Social Data Management (MSDM), pp. 282–287 (2014)
15. Weiler, A., Grossniklaus, M., Scholl, M.H.: Run-time and task-based perfor-
mance of event detection techniques for twitter. In: Zdravkovic, J., Kirikova, M.,
Johannesson, P. (eds.) CAiSE 2015. LNCS, vol. 9097, pp. 35–49. Springer,
Heidelberg (2015)
16. Weiler, A., Scholl, M.H., Wanner, F., Rohrdantz, C.: Event identification for local
areas using social media streaming data. In: Proceedings of the SIGMOD Work-
shop on Databases and Social Networks (DBSocial), pp. 1–6 (2013)
17. Weng, J., Lee, B.S.: Event detection in twitter. In: Proceedings of the Interna-
tional Conference on Weblogs and Social Media (ICWSM), pp. 401–408 (2011)You can also read