MORE THAN MONEY: Leveraging the Benefits of Sport Hosting in Niagara
←
→
Page content transcription
If your browser does not render page correctly, please read the page content below
Policy Brief #30, February 2018
                                                                                                         By Chris Charlebois & Julie Stevens

           Niagara Community Observatory
           Centre for Sport Capacity

           MORE THAN MONEY:
           Leveraging the Benefits of Sport Hosting in Niagara

Tourism in the Niagara region is the largest driving                                 recent Olympic events (Jennings, 2012; Muller, 2014).
factor for economic activity and represents the largest                              There is ongoing debate among academics regarding
employment sector within the local economy. In                                       whether sport events generate positive or negative
Canada, sport tourism is reported as the fastest                                     economic impacts for host cities. Many economic-
growing segment of the tourism industry (Canadian                                    impact studies are criticized for emphasizing only the
Sport Tourism Alliance, 2016), accounting for                                        benefits of the event without considering specific
approximately $6.5 billion of economic spending as a                                 costs that are incurred as a direct result of hosting.
direct result of sporting tournaments, events, and
conferences. The scale of these events ranges from the                               The Niagara region has a long-standing history of
community level (for example, a minor hockey                                         hosting sport events, including the 2017 Scotties
tournament) to large international multi-sport                                       Tournament of Hearts national women’s curling
undertakings such as the Pan American/Parapan                                        championship, the rowing and canoe/kayak
American Games.                                                                      competitions at the 2015 Pan Am/Parapan Am Games,
                                                                                     the 2016 U18 Women’s World Hockey Championship,
Most commonly, analyses of sport events focus on                                     the 2012 FINA Open Water Swim Championships, the
major Games or mega-events such as the Olympics                                      1995 Ontario Winter Games, and the annual Royal
and FIFA World Cup, or professional sports, such as the                              Canadian Henley Regatta. While many of these events
NFL Super Bowl (Baade & Matheson, 2004; Maennig                                      were successful and generated some positive effect,
& Zimbalist, 2012; Porter & Fletcher, 2008; Tien, Lo &                               whether monetary or other, regional and municipal
Lin, 2011; Li, Blake & Thomas, 2013; Ahlert, 2006;                                   governments have lacked an ability to track the
Wassmer, Ong & Propheter, 2016). These types of                                      collective impact of their support either directly to the
events are high-profile, and receive significant media                               event hosts or to the organizations that aid in
exposure. In turn, one of the main policy goals of the                               supporting sport tourism. Acknowledging that many
host city is to harness this exposure in order to                                    event rights-holders, such as Hockey Canada or
improve its public image and international profile                                   Curling Canada, require financial guarantees including
(McManus, 1999).                                                                     ticket sales, facility costs, or direct investments,
                                                                                     municipal and regional leaders must find ways to
Such large-scale sporting events often require                                       justify the support for an event and demonstrate to
significant public subsidies for expenses such as                                    taxpayers that the public funds were spent in a
operations, infrastructure, bid fees, and other costs                                responsible manner.
which can total in the billions of dollars as seen in

Chris Charlebois, BSM, is a Master's student in sport management and a member of the Centre for Sport Capacity at Brock University. Julie Stevens, Ph.D., is As-
sociate Professor, Dept. of Sport Management, and the Director of the Centre for Sport Capacity.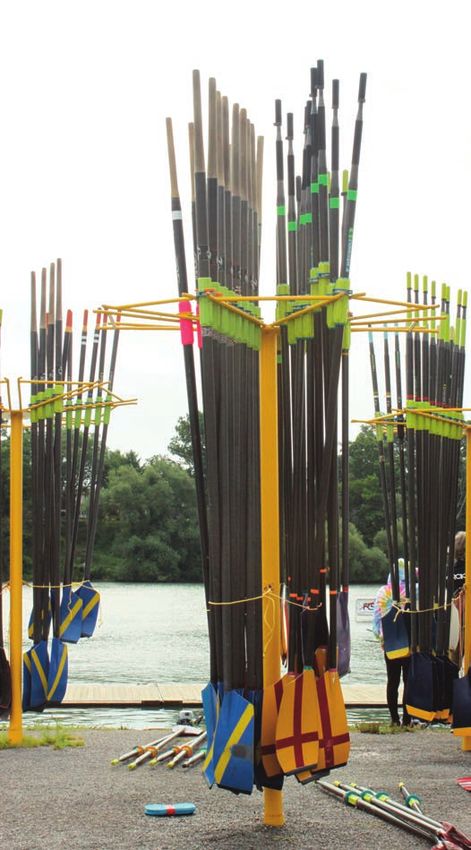
Hence, the purpose of this policy brief is twofold: first,       and capital) may in fact have a greater overall impact
to examine the impact of sport events in Niagara and             when compared to large-scale events. In order for
generate strategies for future sport event hosting in            these types of comparisons to be made locally,
the region; and second, to begin a discussion on                 however, municipal/regional governments and event
identifying a methodology to evaluate the impact of              organizers must evaluate the overall value of events
sport events in Niagara. Without a defined                       hosted in Niagara.
regional/municipal sport-tourism strategy, and
framework to measure sport event outcomes,                       In light of this need for improved sport event data
councillors are often left to make decisions based on            collection and measurement, communities have
information presented by the event rights-holders                started to adopt a more business-like evaluation of
themselves. This inevitably creates the potential for            sporting events. It is common business practice to
biased economic-impact reports, participation rates,             assess performance based on a triple-bottom-line
and other “selling features”.                                    approach which consists of economic, social, and
                                                                 environmental indicators. Our case study of the 2017
Historically, economic impact has been the primary               Scotties Tournament of Hearts presents a potential
selling feature presented to councils as a way to justify        methodology for evaluating the overall impact or
public support. Table 1 outlines a series of events from         performance of an event which may aid the Niagara
2012-2017 that were hosted in the Niagara area and               community in its ongoing efforts to attract and host
the estimated economic impact of each event upon                 sport competitions.
the region.

While economic-impact studies can be considered a
valuable tool for evaluating the overall potential of an
event, this policy brief argues that it should not be a
leading determinant in the overall decision-making
process. With a trend towards ensuring positive social
impacts in a community and limited negative
environmental impacts, it is increasingly important for
those responsible for deciding on event support to add
more evaluation tools to their “toolbox”.

There is growing debate among academics and
practitioners regarding the overall value of events
beyond their economic merits. Many studies have
started to examine the social impacts of an event - the
perceived image of the host city which may open it to
increased tourism and business development, the
enhanced sense of community pride, and an increase
in both social capital manifest in stronger community
bonds, and human capital, such as skills sets,
knowledge and general ‘know-how’. As a result, some
researchers have suggested smaller events that fit
within existing resource capacities (physical, human,

                                                             2
Table 1 – Summary of the Economic Impact of Niagara Region Sport Events
Total
Total Total Wages Total Municipal
Room and Salaries - Employment Taxes - Total EI - Total EI -
Name of Event Year Event Scale Frequency Participants Nights GDP - Niagara Niagara - Niagara Niagara Niagara Ontario
2013 Niagara
Brazilian Jiujitsu
Open 2013 Local Annual 350 75 $21,495.00 $14,510.00 0.5 $693.00 $36,698.00 $57,365.00
2015 Niagara
Winter Games 2015 Local Annual 750 100 $74,675.00 $50,333.00 1 $740.00 $125,748.00 $184,520.00
2012 Ontario
Fencing
Provincials 2012 Provincial One-time 400 25 $35,330.00 $26,637.00 0.5 $1,247.00 $63,214.00 $99,141.00
2017 Ontario
Cup
(Basketball)* 2017 Provincial Annual 1700 1090 $596,460.00 $353,203.00 9 $145,109.00 $1,094,772.00 $1,382,456.00
2015 Royal
Canadian
Henley Regatta 2015 National Annual 4500 3500 $1,683,342.00 $1,102,305.00 25 $7,500.00 $2,793,147.00 $4,008,298.00
2017 Scotties
Tournament of
Hearts 2017 National One-time ϵϬ 1ϳ00 $4,125,222.00 $2,587,277.00 57 $93,614.00 $6,806,113.00 $11,193,736.00
2017
Canoe/Kayak
Nationals 2017 National One-time 1200 2000 $258,995.00 $175,279.00 4.5 $11,375.00 $445,649.00 $772,656.00
2017 National
Dragon Boat
Championships 2017 National One-time 2000 2800 $617,672.00 $416,177.00 10.5 $27,394.00 $1,061,243.00 $1,880,881.00
2016 IIHF U18
Women's World
Hockey 2016 International One-time 200 3000 $5,470,623.00 $3,512,764.00 92 $18,150.00 $9,001,537.00 $12,853,528.00
TOTALS 11,124 13590 $12,883,814.00 $8,238,485.00 198 $305,822.00 $21,428,121.00 $32,432,581.00
Note: Data on events were provided by the Niagara Sport Commission; *Ontario Cup Tournaments are a collection of three events occurring
over a three-weekend period: Economic impact assessment conducted using TREIM.CASE STUDY: 2017 SCOTTIES TOURNAMENT both positive and negative impact assessments for
OF HEARTS, ST. CATHARINES economic, social, and environmental factors. In
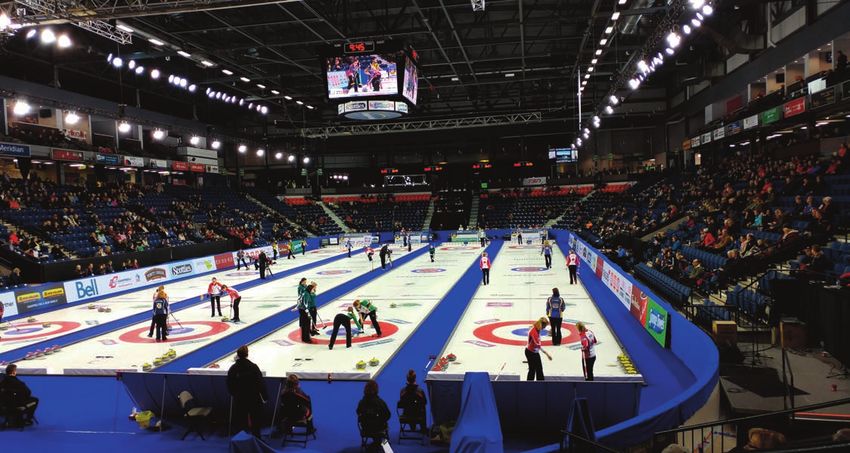
From February 16-26, 2017, the City of St. Catharines addition, demographic information was collected to
hosted the 2017 Scotties Tournament of Hearts in a better understand who attended the event. Knowing
city-owned venue, the Meridian Centre. This event, the that demographic factors can determine tourism and
national women’s curling championship, is owned and spending-based decisions, it was important to collect
operated by Curling Canada and featured 90 this information for comparative purposes. Finally,
participants, attracted more than 60,000 spectators, survey questions identified which attendees were
and garnered almost 100 hours of national television spectators, the distance they traveled, and the
coverage through TSN (The Sports Network). amount of money they spent while in the community
in order to provide greater insights into the overall
Hoping that the event would provide significant value of the event.
economic benefits for the community, the City of St.
Catharines councillors agreed to cover the venue In total, 251 people responded to the survey. Quick
rental fee, a $140,000 cost savings for Curling Canada facts are highlighted below.
and the local event host, to use the Meridian Centre.
Table 1 illustrates the economic impact of the event Perceived Impacts of the Event
using specific indicators. It is the intent of this case On a seven-point Likert scale, attendees were asked
study to examine the perceived event impacts of to evaluate the positive or negative statements
attendees as a means to identify new ways to evaluate related to the event with ‘1’ being “completely
an event’s overall value to a community. disagree” and ‘7’ being “completely agree”. In total, 22
positive and 18 negative statements were evaluated.
Methodology A full list of the questions and their rankings can be
Utilizing previous social event-impact research, a found in Appendix A.
modified scale, called the Scale of Perceived Social
Impacts (SPSI) was developed. The scale identified
Attendee Gender (n=251) Attendee Age (n=251)
18%
Male
ϰϭй
11%
54%
Female
ϱϵй
17%
19-34 yrs of age 35-45 yrs of age
46-55 yrs of age 55+ yrs of age
Figure 1 Figure 2
4Attendee Ethnicity (n=251)
Attendance of Non-curlers
Did Not Reply 2
• 25 per cent of respondents
Other 1 had never participated in
curling
InĚŝgenous 1
• 28 per cent of respondents
Latino orHispanic 1 were attending their
first-ever curling event
Caucasian 95
0 20 40 60 80 100
Percentage of Respondents
Figure 3
Tourism-Based Results
Attendee Income Levels (n=221)
• Average length of stay = 4 $150,000+ 43
nights;
$100,000-$149,999 48
• Average group size = 2.5
travelers; $75,000-$99,000 40
• 97 per cent of travelers $50,000-$74,999 40
attended specifically for the $35,000-$49,999 25
Scotties event;
$0-$34,999 25
• Group spending for the trip
averaged $735. 0 10 20 30 40 50 60
# of Respondents
Figure 4
Where Attendees Reside (n =251)
6%
14% 18%
ϯϵ% 23%
St. Catharines Niagara Region Ontario (within 320km)
Ontario (320km+) Out of Province
Figure 5A summary of mean scores for A Comparison among Economic, Social and
economic, social, and environ- Environmental Perceived Impact of 2017 Scotties
mental perceived event impact, Tournament of Hearts
and for positive and negative
perceived event impact is seen in 2.96
Social
Figures 6 and 7. Figure 6 5.73
indicates social factors were
Economic 4.17
highest for perceived positive 5.23
event impact whereas economic
Environmental 3.49
factors were highest for
perceived negative event
0 1 2 3 4 5 6 7
impact. Further, Figure 7 shows
the average for positive event Perceived Negative Impact Perceived Positive Impact
impact was greater than the Figure 6
*Note: The perceived event impact tool did not include
average for negative event impact. any positive environmental impact questions.
Discussion
More than 60,000 spectators purchased tickets and investment in sport tourism. However, the data
the event resulted in an estimated overall economic collection method utilized by the event host often
impact of $11.1 million (calculated using TREIM). The relied on estimates from hotel groups and event
event was attended by primarily (self-identified) organizers to determine educated predictions of total
Caucasians with more than 70 per cent of survey numbers and collective impact. While a traditional
respondents being over the age of 45 years. Almost 60 economic impact assessment is informative, this case
per cent of respondents resided outside of the Niagara study provides new, alternative data that can be
region suggesting that the event was a large tourist collected in order to better understand the impact of
draw. Interestingly, about a quarter of respondents had a sport event through a triple-bottom-line lens.
no previous interaction with curling (participating or Unique to the case study was the perceived impact of
attending) which suggests that the event also the event's attendees, whose perceptions are
provided perceived entertainment and social value for important for politicians and other decision-makers.
attendees. Finally, based on the positive and negative Local residents who believe that an event will boost
statements that were assessed, respondents perceived the image of their city, provide more cultural
that the event had an overall positive impact on the opportunities, increase interaction among citizens, or
community. promote healthier living will often be more inclined
to support investments into the attraction of sport
The 2017 Scotties Tournament of Hearts case study events.1
highlights important insights both for city officials and
event organizers. Table 1 gave a snapshot of previous
events and the results indicated a return on
1
There are limitations to this case study. Event Attendee Perceptions: Our study only addressed the perceptions of event attendees. Inherently, attendees
may have a more positive perception of the event given an interest in curling, volunteering, sports, or the potential to interact with fellow citizens. Future
research could explore the perceptions of non-event attendees. In addition, the largest contribution that the City made was the financial support to Curling
Canada. While this support was made public both through meeting minutes of city council and local media outlets, it was not widely publicized or known by
those who responded to the survey. Number of Respondents: In total, 251 survey responses were collected. Due to the length of the survey and resources of
the research team, this was a limitation in amassing a large sample size. With more than 35,000 unique ticket purchasers, these responses are representative of
a very small portion of the overall attendee pool
6approach whereby a commu-
A Comparison of Overall Perceived Negative and nity concentrates on
Positive Impact developing and/or attracting a
varying scale of events with a
focus on those that are
suitable for its existing physi-
Negative Perceived Impact 3.54
cal, capital, and human-re-
source infrastructure. As the
evidence in Table 1 reveals, a
large number of small-scale
Positive Perceived Impact 5.48 events can generate many
positive impacts while at the
same time fit into existing
0 1 2 3 4 5 6 physical infrastructure. Sup-
Figure 7
port for Niagara sport stake-
holders, such as local sport
clubs and associations that
already have human resources
IMPLICATIONS and technical expertise, is just as, if not more impor-
Currently the Niagara region and its municipalities tant, than making large financial outlays to bid upon,
lack a focused and collaborative strategy for attracting and host, national and international events.
sport events to the area. Positive steps have been
taken, including the creation of a regional facility To develop an event-hosting strategy, regional
inventory database, event sponsorships available sport-tourism stakeholders will need to collectively
through the Regional Tourism Organization (whose define and effectively track sport event outcomes.
mandate is to support and grow tourism across Traditional economic impact measures, such as those
Niagara), and a successful unified bid for the 2021 identified in Table 1, are helpful; however, based on
Canada Summer Games. While each of these the case study presented, new measures may be
demonstrate some progress, event rights-holders who required. Across the country, cities that are
own or control sport competitions that can generate sport-tourism leaders often have an arms-length
the greatest overall impact often require organization or committee that evaluates and presents
facilities and a participant/spectator footprint that recommendations for funding based on pre-determined
spans across more than one municipality. This pres- criteria to ensure that a body, independent of the
ents a unique challenge in a two-tier regional environ- event organizer, can evaluate the potential for positive
ment with 12 municipalities as fragmented funding impact on the community.
policies and strategic priorities can turn event organ-
izers away. By identifying the role that a community will play in
sport tourism - and its success metrics - the
As such, it is imperative that individual municipalities municipality will be better positioned to define the
in Niagara identify what, if any, role they will have in resources it will allocate to sport tourism on an annual
sport tourism going forward. At a regional level, a basis. In turn, event organizers at the local, provincial,
coordinating body or group must be prepared to drive national, and international levels will better
an agenda to develop a regional sport-hosting understand what resources are available and
strategy. Tourism literature suggests a “portfolio” determine if the Niagara region is a good fit for its
7property. Furthermore, the creation of these strategies potential economic benefit, what benefits would come
will enable the region and/or municipalities to weigh from coordinated planning and delivery within Niagara?
its investments in sport tourism. As demonstrated in Could different municipal functions be involved in event
Table 1, there are economic benefits to larger-scale planning and delivery to extract value or mitigate nega-
events. However, supporting local organizers with tive impacts? For example, some events require police to
existing events or creating a collection of new ones close a road, or need signage to notify drivers about road
can also have a significant overall impact on the access and detours. But, how could more pro-active
community at large. approaches be taken to minimize traffic disruption and
related negative social and environmental effects?
Beyond attracting events to the area, regional sport-
tourism stakeholders should also consider unified and Further, could recreation departments do more to
collaborative policies and programs that will support re-program regional facility use in advance, rather than
event rights-holders after they have chosen Niagara just closing affected facilities for the duration of an
as a host destination. While municipal budgets may event? Could public health use the opportunity to
vary, similar funding and facility allocation policies can provide positive health messaging connected with the
assist organizers in implementing their events. With event, or take advantage of the attraction of spectators
unified funding and allocation policies, applications for to promote healthy behaviour to them? On the
funding or field time can be streamlined for all parties non-profit side, could sport organizations do more to
involved. In addition, municipalities should consider organize “try it” events to engage the public and/or at-
exploring internal opportunities that they can exploit tract new participants? These are questions that Niagara
to support event organizers (e.g. posting on events needs to address within a collaborative platform. The
calendars, digital welcome boards, advertising or results of such deliberations could provide compelling
welcome signs in hotels or facilities) and coordinate reasons for leveraging our pooled assets as a region.
with their municipal counterparts to ensure that other
communities can offer the same services. These types There is tremendous potential to a regional, coordinated,
of support services ensure that athletes and event sport event-hosting plan as advocated above. A
organizers feel welcomed when they arrive and ensure successful strategy involves more than a “win more
an enjoyable experience. events for Niagara” mentality – rather it involves a
triple-bottom-line approach that considers how to
Finally, it is suggested that a coordinated effort be maximize (or mitigate) economic, social, and
initiated to evaluate the overall impact of sport environmental impacts.
tourism in the Niagara region. With both regional and
municipal councils having invested in sport-related CONCLUSION
events, it is important that data is continually sought The Niagara region is a well-known international tourism
from event organizers in collaboration with tourism destination. As such, it is uniquely positioned to capitalize
stakeholders such as hotels, restaurants, and attractions. on Canada’s fastest-growing tourism segment: sport
For example, by considering services or technology tourism. The research and case study presented herein
that can be used to centralize purchases, referrals or provide insights into the value of sport tourism through
bookings, data collection may be streamlined to a triple-bottom-line approach. Specifically, it examines
ensure its accuracy and catchment of all attendee both traditional economic assessment as well as a novel
types (participants, spectators, and media/VIP). perceived economic, social, and environmental impact
framework. Whatever approach is utilized, there must be
RECOMMENDATIONS – A CALL FOR ACTION a more comprehensive process that decision-makers
Beyond strategizing to maximize “events won” and follow to support and evaluate event outcomes. Only
through such ongoing strategic action will Niagara
become a successful sport event destination.
8APPENDIX A: PERCEIVED IMPACTS OF THE 2017 SCOTTIES TOURNAMENT OF HEARTS
Perceived Economic Impacts, Figure 8
Please rate the following statements (1 being completely disagree, 7 being
completely agree) based on your perceptions of the impacts of the 2017 Scotties
Tournament of Hearts
Increased product prices (e.g. Hotels, meals, etc.) 4.36
Excessive spending by government or other agencies to support
operational costs of the event 3.97
Accelerated community growth 4.61
Increased community development investments 5.15
Increased employment opportunities 5
Increased economic activity for local business 6.15
0 1 2 3 4 5 6 7
Perceived Positive Social Impacts, Figure 9
Please rate the following statements (1 being completely disagree, 7 being
completely agree) based on your perceptions of the impacts of the 2017 Scotties
Tournament of Hearts
Positive Impact Factors
Generated excitement to the host community 6.15
Provided a high-quality entertainment opportunity 6.2
Provided learning opportunity of a new sport 6
Increased volunteering opportunities 6.2
Increased opportunity to enjoy curling events 6.25
Increased community identity in the country 5.79
Enhanced international recognition of host community 5.51
Improved image of St. Catharines 5.98
Enhanced media visibility 5.94
Increased national image 5.82
Increased global image 5.28
Increased interest in international sport events 5.82
Provided residents opportunity to meet new people 5.87
Provided an incentive for the preservation of local culture 4.83
Increased the understanding of the other cultures and societies of visitors 4.8
Increased number of cultural events 5.23
Enhanced the sense of being a part of the community 5.63
Reinforced community spirit 5.78
Enhanced the community pride of residents 5.76
0 1 2 3 4 5 6 7
9Perceived Negative Social Impacts, Figure 10
Please rate the following statements (1 being completely disagree, 7 being
completely agree) based on your perceptions of the impacts of the 2017 Scotties
Tournament of Hearts
Negative Impact Factors
Increased social conflicts between supporters and non-supporters of the event 2.42
Caused issues between visitors and local residents 2.48
Disrupted the lives of local residents 2.79
Local residents were not a primary consideration for the event 3.08
Increased psychological anxieties due to security risks/concerns 2.36
Increased disturbance from visitors (e.g. hooligans, disorder, and vandalism) 2.5
Increased risks of terrorism (e.g. bomb threat, etc.) 2.15
Increased crime 2.57
Increased road closures/disruption 3.46
Increased problems for using public transportation 3.82
Increased hardship for finding parking 4.91
0 1 2 3 4 5 6
Perceived Environmental Impacts, Figure 11
Please rate the following statements (1 being completely disagree, 7 being
completely agree) based on your perceptions of the impacts of the 2017
Scotties Tournament of Hearts
Resulted in traffic congestion 3.85
Caused environmental damage to local community 2.66
Increased noise levels 3.38
Increased air pollution 3.44
Increased the amount of litter and waste 4.15
0 0.5 1 1.5 2 2.5 3 3.5 4 4.5
10REFERENCE LIST
Ahlert, G. (2006). Hosting the FIFA World Cup™ Germany 2006. Journal of Convention & Event
Tourism. 8(2), 57-78.
Baade, R. A., & Matheson, V. A. (2004). The quest for the cup: Assessing the Economic Impact of
the World Cup. Regional Studies. 38, 343–354.
Canadian Sport Tourism Alliance. (2016).
http://canadiansporttourism.com/about-csta/about-csta.html
Jennings, W. (2012). Why Costs Overrun: Risk, Optimism and Uncertainty in Budgeting for the
London 2012 Olympic Games. Construction Management and Economics. 30(6), 455-462.
Li, S., Blake, A., & Thomas, R. (2013). Modelling the Economic Impact of Sports Events: The Case of
the Beijing Olympics. Economic Modeling. 30, 235-244.
Maennig, W., & Zimbalist, A. (Eds.) (2012). International Handbook on the Economics of Mega
Sporting Events. Cheltenham, UK: Edward Elgar.
McManus, G. (1999). Making the most of mega-events. New Zealand Management. 46(2),
30–35.
Muller, M. (2014). After Sochi 2014: Costs and Impacts of Russia's Olympic Games.
SSRN Electronic Journal.
Porter, P. K., & Fletcher, D. (2008). The Economic Impact of the Olympic Games: Ex Ante
Predictions and Ex Post Reality. Journal of Sport Management. 22, 470–486.
Tien, C., Lo, H., & Lin, H. (2011). The Economic Benefits of Mega Events: A Myth or a Reality? A
Longitudinal Study on the Olympic Games. Journal of Sport Management. 25, 11–23.
Wassmer, R. W., Ong, R. S., & Propheter, G. (2016). Suggestions for the Needed Standardization of
Determining the Local Economic Impact of Professional Sports. Economic Development Quarterly.
30(3), 252-266.
11The Niagara Community Observatory is a local public policy think-tank at Brock University in
St. Catharines, ON.
The Centre for Sport Capacity at Brock University is a hub for sport management research, student
experiential learning, and practical support to sport organizations in the Niagara region and across
Canada. For more information, please contact Julie Stevens at jstevens@brocku.ca
More information on our office and an electronic version of this policy brief can be found at:
www.brocku.ca/nco
@BrockNCOYou can also read