Al2O3 Particle Erosion Induced Phase Transformation: Structure, Mechanical Property, and Impact Toughness of an SLM Al-10Si-Mg Alloy - MDPI
←
→
Page content transcription
If your browser does not render page correctly, please read the page content below
nanomaterials

Article
Al2O3 Particle Erosion Induced Phase Transformation:
Structure, Mechanical Property, and Impact Toughness of an
SLM Al-10Si-Mg Alloy
Bo-Chin Huang and Fei-Yi Hung *

                                          Department of Materials Science and Engineering, National Cheng Kung University, Tainan 701, Taiwan;
                                          frt4y6asd@gmail.com
                                          * Correspondence: fyhung@mail.ncku.edu.tw

                                          Abstract: This study investigated the microstructure, mechanical properties, impact toughness,
                                          and erosion characteristics of Al-10Si-Mg alloy specimens manufactured using the selective laser
                                          melting (SLM) method with or without subsequent T6 heat treatment. Furthermore, the erosion
                                          phase transformation behavior of the test specimens was analyzed, and the effect of the degradation
                                          mechanism on the tensile mechanical properties and impact toughness of the SLM Al-10Si-Mg alloy
                                          specimens before and after particle erosion was compared. The experimental results indicated that
                                          the Al-10Si-Mg alloy subjected to T6 heat treatment has better erosion resistance than the as-fabricated
                                          material. The tensile strength and fracture toughness of both specimen groups decreased due to the
                                          formation of microcracks on the surface caused by particle erosion. Nevertheless, the erosion-induced
                                          silicon nanoparticle solid solution softens the Al matrix and improves the elongation of the SLM

                                   Al-10Si-Mg alloy.
Citation: Huang, B.-C.; Hung, F.-Y.
Al2 O3 Particle Erosion Induced Phase
                                          Keywords: Al-Si-Mg alloy; selective laser melting (SLM); mechanical properties; impact toughness;
Transformation: Structure,                erosion wear
Mechanical Property, and Impact
Toughness of an SLM Al-10Si-Mg
Alloy. Nanomaterials 2021, 11, 2131.
https://doi.org/10.3390/                  1. Introduction
nano11082131                                    Selective laser melting (SLM) is a type of powder bed fusion technology in which
                                          three-dimensional (3D) objects are gradually built layer by layer. This makes the technology
Academic Editor: Jordi Sort               suitable for manufacturing parts with complex geometric shapes. This emerging manufac-
                                          turing technology has been applied to different metallic materials such as cobalt-chromium
Received: 2 July 2021                     alloys [1], stainless steel [2,3], aluminum-based alloys [4,5], magnesium alloys [6,7], and
Accepted: 19 August 2021
                                          titanium alloys [8,9].
Published: 21 August 2021
                                                Among Al alloys, Al-10Si-Mg alloy is one of the first to be subjected to SLM. The
                                          silicon content of Al-10Si-Mg alloy is close to the eutectic point of aluminum–silicon binary
Publisher’s Note: MDPI stays neutral
                                          alloys, and the material has a small solidification range during melting, which makes it
with regard to jurisdictional claims in
                                          suitable to be manufactured using SLM [10,11]. Moreover, Al-10Si-Mg alloy has good
published maps and institutional affil-
                                          fluidity because its aluminum and silicon composition is close to the eutectic composition,
iations.
                                          which makes it one of the most suitable candidates for the SLM process. Research on Al-
                                          10Si-Mg alloy has focused on the specific microstructure and mechanical strength caused by
                                          the rapid cooling in the SLM process [10–15]. One study pointed out that specimens with
                                          different construction directions used in fatigue tests were fabricated using SLM [16] and
Copyright: © 2021 by the authors.         investigated the high cycle fatigue life of specimens with different construction directions
Licensee MDPI, Basel, Switzerland.
                                          and subjected to different heat treatment conditions [14]. The results indicated that the
This article is an open access article
                                          microstructure evolution characteristics and mechanical properties of SLM Al-10Si-Mg
distributed under the terms and
                                          alloy were highly valuable. Notably, particle erosion is an important mechanism that causes
conditions of the Creative Commons
                                          material damage in many engineering applications. However, few comprehensive reports
Attribution (CC BY) license (https://
                                          have discussed the wear resistance of Al-10Si-Mg alloy specimens [17–19]. Previously, we
creativecommons.org/licenses/by/
4.0/).
                                          used SiO2 particles to conduct erosion experiments for evaluating the wear resistance of

Nanomaterials 2021, 11, 2131. https://doi.org/10.3390/nano11082131                                   https://www.mdpi.com/journal/nanomaterials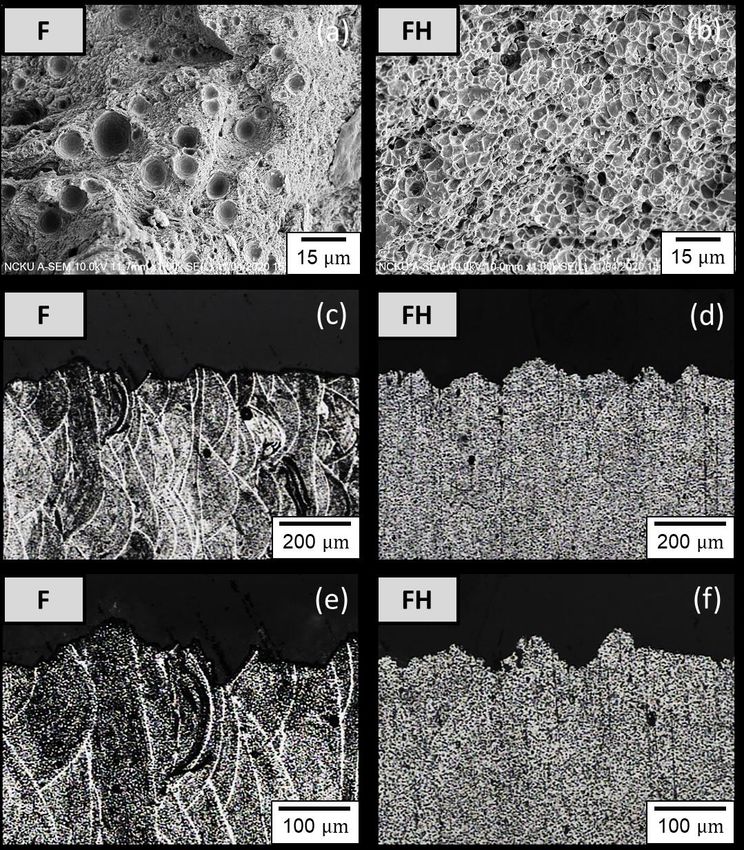
Nanomaterials 2021, 11, 2131 2 of 17
Al-10Si-Mg
Nanomaterials 2021, alloy
11, x FOR PEER and
commercial 4384 Al alloy and confirmed that Al-10Si-Mg alloy has 2 of 17
REVIEW
excellent wear resistance [17].
In this study, Al2 O3 ceramic particles were used instead of SiO2 particles in erosion
experiments to create
reportsahave
considerably
discussed harsher
the wearwear environment
resistance for examining
of Al-10Si-Mg the erosion-
alloy specimens [17–19]. Previ-
induced phase ously, we used SiO
transformation 2 particles
and to conduct
material failure erosion experiments
mechanism for evaluating
of Al-10Si-Mg alloy.the
Bywear re-
sistance of
using the SLM process Al-10Si-Mgfrom
parameters alloy and
[17],commercial 4384 Aland
tensile, erosion, alloyimpact
and confirmed that Al-10Si-Mg
test specimens
were fabricatedalloy
fromhas excellent wear
Al-10Si-Mg resistance
alloy powder[17].by means of SLM to compare the effects
In this study, Al 2O3 ceramic particles were used instead of SiO2 particles in erosion
of heat treatment and erosion phase transformation behavior on the mechanical strength
experiments to create a considerably harsher wear environment for examining the ero-
and impact toughness of the material. The establishment of related wear degradation
sion-induced phase transformation and material failure mechanism of Al-10Si-Mg alloy.
mechanisms is important for academic research and to provide references for SLM Al-Si-
By using the SLM process parameters from [17], tensile, erosion, and impact test speci-
Mg alloy applications.
mens were fabricated from Al-10Si-Mg alloy powder by means of SLM to compare the
effects of heat treatment and erosion phase transformation behavior on the mechanical
2. Materials and Methods
strength and impact toughness of the material. The establishment of related wear degra-
In this study, wemechanisms
dation used Al-10Si-Mg alloyfor
is important specimens
academic manufactured by the references
research and to provide Industrialfor SLM
Technology Research
Al-Si-MgInstitute (ITRI; ITRI self-developed AM250, Hsinchu, Taiwan). More-
alloy applications.
over, the Al-10Si-Mg alloy powder (according to ASTM F3318, Taiwan Circle Metal Powder
2. Materials
Co., Ltd., Tainan, Taiwan) and used Methods
to fabricate these specimens was produced by ITRI. Its
chemical composition In this study, we used
is summarized Al-10Si-Mg
in Table 1. Thealloy specimens
powder has amanufactured by the Industrial
spherical appearance
and an average Technology
particle sizeResearch
of 35 µm.Institute (ITRI; ITRI self-developed
A continuous-wave AM250, Hsinchu,
laser with a wavelength of 1064 Taiwan).
nm and a spot size of 100 µm was employed as the energy source. The laser power was Metal
Moreover, the Al-10Si-Mg alloy powder (according to ASTM F3318, Taiwan Circle
300 W, scanningPowder
speed 700Co., mm/s,
Ltd., Tainan,
hatchTaiwan)
space 35used
µm,toand
fabricate
powder these specimens
layer was30produced
thickness µm. by
ITRI. Its chemical composition is summarized in Table 1. The powder has a spherical ap-
The process parameters are summarized in Table 2. The relationship between the printed
pearance and an average particle size of 35 μm. A continuous-wave laser with a wave-
arrangement and construction direction of the SLM Al-10Si-Mg specimens on the substrate
length of 1064 nm and a spot size of 100 μm was employed as the energy source. The laser
and the specifications
power wasof the300specimens
W, scanning are illustrated
speed in Figures
700 mm/s, 1 and
hatch space 2, respectively,
35 μm, and powder and
layer thick-
the finished product is depicted in Figure 3.
ness 30 μm. The process parameters are summarized in Table 2. The relationship between
the printed arrangement and construction direction of the SLM Al-10Si-Mg specimens on
Table 1. Chemicalthe
composition of Al-10Si-Mg
substrate and alloy. (wt.%).
the specifications of the specimens are illustrated in Figures 1 and 2,
respectively, and the finished product is depicted in Figure 3.
Si Fe Cu Mn Mg Ni Zn Pb Sn Ti Al
Composition 10.00 Table
0.551. Chemical
0.05 0.45 0.65of Al-10Si-Mg
composition 0.05 0.10 0.05
alloy. (wt.%). 0.05 0.15 Bal.
Si Fe Cu Mn Mg Ni Zn Pb Sn Ti Al
Table 2.
Composition Process 0.55
10.00 parameters employed
0.05 0.45 in this0.65
study. 0.05 0.10 0.05 0.05 0.15 Bal.
Layer
Laser Power Table 2. ProcessSpeed
Scanning parameters employed in this study.
Beam Size Hatch Space
Thickness
300 W Laser700
Power
mm/s Scanning Speed
35 µm Beam Size
100 µm Hatch Space30 µm
Layer Thickness
300 W 700 mm/s 35 μm 100 μm 30 μm
Figure 1. The relationship between the printed arrangement and construction direction of the
Al-10Si-Mg specimens on the substrate.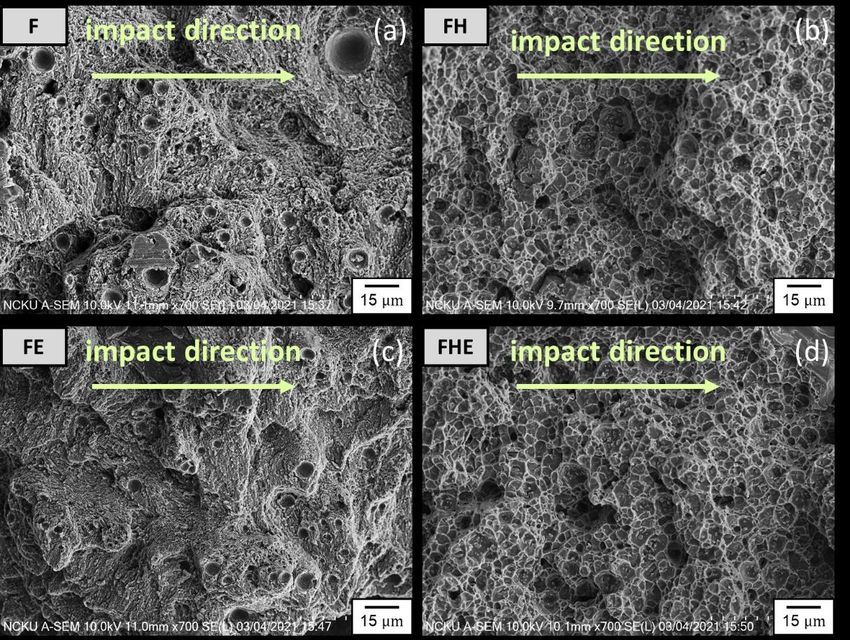
Nanomaterials 2021, 11, x FOR PEER REVIEW 3 of 17
Nanomaterials 2021, 11, x FOR PEER REVIEW 3 of 17
Figure 1. The relationship between the printed arrangement and construction direction of the Al-10Si-Mg specimens on
Nanomaterials 2021, 11, 2131 3 of 17
the substrate.
Figure 1. The relationship between the printed arrangement and construction direction of the Al-10Si-Mg specimens on
the substrate.
Thedetailed
Figure2.2.The
Figure detailedspecifications
specifications of of
thethe specimens
specimens used
used in this
in this study:
study: (a)tensile
(a) the the tensile test specimens;
test speci-
Figure 2. The detailed specifications of the specimens used in this study: (a) the tensile test speci-
(b) the(b)
mens; erosion test specimens;
the erosion (c) (c)
test specimens; thetheimpact toughness
impact toughnessspecimens.
specimens.
mens; (b) the erosion test specimens; (c) the impact toughness specimens.
Figure 3. The finished as-fabricated Al-10Si-Mg specimens.
In this study, the specimens were subjected to T6 heat treatment, which involves two
stages of solution
Figure treatment
3. The finished at 510 °C forAl-10Si-Mg
as-fabricated 2 h, followed by artificial aging treatment at 170
specimens.
Figure 3. The finished as-fabricated Al-10Si-Mg specimens.
°C for 6 h. The as-fabricated Al-10Si-Mg specimens were categorized as group F, and the
specimens
In
In thissubjected
this study, to T6
the
study, the heat treatment
specimens
specimens werewere
were categorized
subjected
subjected T6asheat
to T6
to group
heat FH. The naming
treatment,
treatment, whichprin-
which involves two
involves two
ciples
stages are summarized in Tableat3. 510
To examine the microstructure of the as-fabricated Al-
stages of solution treatment at 510 C for 2 h, followed by artificial aging treatment170
of solution treatment °C◦ for 2 h, followed by artificial aging treatment at at
10Si-Mg specimens
◦ C 6for with different construction directions,were
the plane perpendicular to the
170for
°C h. 6The as-fabricated
h. The Al-10Si-Mg
as-fabricated Al-10Si-Mg specimens
specimens were categorized
categorizedas group F, and
as group the
F, and
construction direction was defined as the z surface, and the planes parallel to the construc-
specimens
the specimens subjected to T6 heat
subjected treatment werewere
categorized as group FH. The naming prin-
tion direction were defined to
as T6
the heat treatment
x surface and y surface, categorized
as illustratedasingroup
FigureFH.
4. The naming
ciples are summarized
principles are summarizedin Table 3. To3.examine
in Table the the
To examine microstructure
microstructureof the as-fabricated
of the Al-
as-fabricated
10Si-Mg specimens
Al-10Si-Mg specimenswith different
with construction
different directions,
construction the the
directions, plane perpendicular
plane perpendicularto the
to
construction direction
the construction was defined
direction as the as
was defined z surface, and theand
the z surface, planestheparallel
planes to the construc-
parallel to the
tion directiondirection
construction were defined as the xas
were defined surface and y surface,
the x surface as illustrated
and y surface, in Figure
as illustrated 4.
in Figure 4.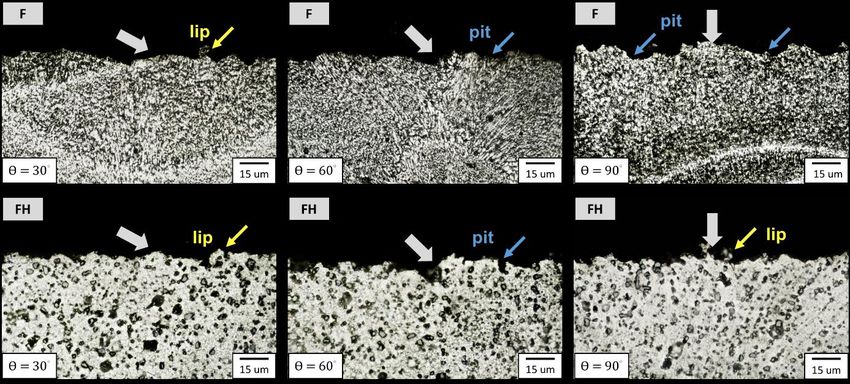
2021, 11, x FOR PEER REVIEW
Nanomaterials 2021, 11, 2131 4 of 17 4 of 17
Table 3. The naming principles and post-processing conditions.
Table 3. The naming principles and post-processing conditions.
Group Post-Processing Conditions
Group Post-Processing Conditions
F Raw material
FE F material after T6 heat treatment
Raw Raw material
FE Raw material after T6 heat treatment
FH FH
Raw material + Erosion wear Raw material + Erosion wear
FHE Raw material
FHE after T6 heat treatment + Erosion
Raw material after wear
T6 heat treatment + Erosion wear
Figure 4. The naming principles of the relationship between different observation planes and the
Figure 4. The naming principles of the relationship between different observation planes and the
construction direction.
construction direction.
The F and FH specimens were cold embedded and ground in order using #80~#4000
The F and FH specimens were cold embedded and ground in order using #80~#4000
SiC sandpaper, followed by polishing using a 0.04 µm SiO2 polishing solution. The
SiC sandpaper, followed
specimens of each using
by polishing groupawere0.04 immersed
μm SiO2 polishing
in Keller’s solution.
etchingThe speci-(19 mL HNO + 9 mL
solution 3
mens of each group were immersed in Keller’s etching solution (19 mL HNO 3 + 9 mL HCl
HCl + 6 mL HF + 19 mL H2 O) for approximately 20 s, and the microstructures of the
+ 6 mL HF + 19 mL H O) for approximately
z 2surface and x surface20 s, and
were the microstructures
observed using an optical of the z surface (OM; BX41M-LED,
microscope
and x surface were observed using an optical microscope (OM; BX41M-LED, Olympus,
Olympus, Tokyo, Japan). Notably, only the z surface and x surface were analyzed herein.
Tokyo, Japan). Notably, only the zthe
Furthermore, surface and x were
specimens surface were analyzed
analyzed herein. Further-
using a scanning electron microscope (SEM;
more, the specimensSU-5000,
were analyzed using a scanning electron microscope
Hitachi, Japan) and an X-ray diffractometer (XRD; (SEM;D8 SU-5000,
Discover, Bruker, Karlsruhe,
Hitachi, Japan) and an X-ray diffractometer
Germany) to observe the (XRD; D8 Discover,
morphology Bruker,pool
of the melting Karlsruhe, Ger- the phase structure,
and examine
many) to observe therespectively.
morphology of the melting pool and examine the phase structure,
respectively. A tensile test was performed in which the F and FH groups of specimens were
A tensile test was performed
stretched in which
at a speed the F and and
of 1 mm/min, FH the
groups of specimens
results of each group were were obtained as the
stretched at a speedaverage
of 1 mm/min, and theobtained
of the values results ofineachfive group
test runs.wereThe obtained
hardness as theof the specimens was
average of the valuesanalyzed
obtainedininHRFfive test
units runs. The hardness
by using a Rockwell of the specimens
hardness was(AR-10
tester ana- Hardness Testing
lyzed in HRF units Machine,
by using Mitutoyo,
a Rockwell Taipei, Taiwan). An erosion test was conductedMa-
hardness tester (AR-10 Hardness Testing in which the specimens
chine, Mitutoyo, Taipei,
wereTaiwan).
placed on An theerosion
carriertest waserosion
of the conducted in which
equipment the specimens
(Figure 5). The erodent solid particles
were placed on the carrier of theinerosion
employed this testequipment
were irregular(Figure
Al25).
O3 The erodent
ceramic solid (hardness:
particles particles 2000 HV, Rich Sou
employed in this testTechnology
were irregular Co.,Al 2O3 ceramic
Ltd., Kaohsiung, particles
Taiwan)(hardness: 2000ofHV,
with sizes Rich Sou
125–150 µm. The erosion rate in
Technology Co., Ltd., Kaohsiung,
units of g/g was Taiwan)
defined with
as sizes of 125–150
the total mass ofμm. the The erosion
removed rate individed by the total
material
mass as
units of g/g was defined of the
the total
erodent mass particles hitting the
of the removed specimen
material surface.
divided Following
by the total the experimental
mass of the erodentmethods
particles used
hittingin [20], the test was
the specimen performed
surface. Followingwith 200 g of Al2 O3 ceramic particles each
the experimental
time, 2 (the flying speed of Al O particle is
methods used in [20], the and the inlet
test was pressure
performed was200
with fixed
g ofatAl 3 2kg/cm
O3 ceramic particles each 2 3
about 66was
time, and the inlet pressure m/s).fixedTheatimpingement
3 kg/cm2 (theangle flying(the angle
speed of between the erosion
Al2O3 particle is direction of the
erodent particles
about 66 m/s). The impingement angle and theangle
(the material surface)
between the was gradually
erosion direction of the from 15◦ to 90◦ in
increased
◦
erodent particles andincrements
the material of 15 . The was
surface) maximum
graduallyand increased
minimumfrom erosion15°rates ofin
to 90° thein-test pieces in both the
F and the FH groups were 30 ◦ and 90◦ , respectively. The failure was dominated by the
crements of 15°. The maximum and minimum erosion rates of the test pieces in both the
F and the FH groupsductile cutting
were 30° andmechanism. T6 heat
90°, respectively. Thetreatment
failure wasimproved the ductility
dominated by the of the material and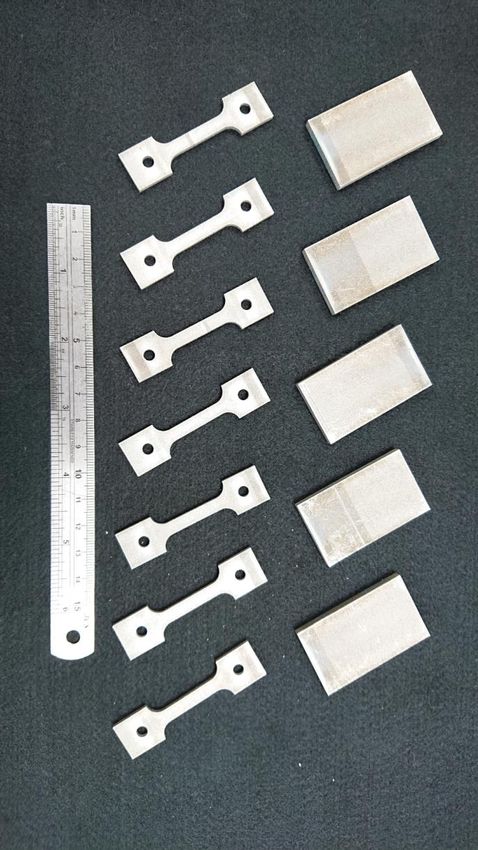
Nanomaterials 2021, 11, x FOR PEER REVIEW 5 of 17
Nanomaterials 2021, 11, 2131 5 of 17
ductile cutting mechanism. T6 heat treatment improved the ductility of the material and
precipitatedthe
precipitated thenano-strengthening
nano-strengtheningMg
Mg2Si
Si phase, which can improve the wear resistance
2 phase, which can improve the wear resistance
of the material.
of the material.
Figure5.5.(a)
Figure (a)The
Theerosion
erosion test
test equipment
equipment developed
developed by group;
by our our group; (b)definition
(b) the the definition of impingement
of impingement angle.
angle.
To explore the differences in the wear mechanisms of the as-fabricated Al-10Si-Mg
alloy To explore before
specimens the differences
and after inT6the
heatwear mechanisms
treatment, of themicroscope
an electron as-fabricated
andAl-10Si-Mg
an optical
alloy specimens before and after T6 heat treatment, an electron microscope
microscope were used to observe the erosion surface morphology and erosion subsurface and an optical
microscope were used to observe the erosion surface morphology and
characteristics of the specimens, respectively. Moreover, in the erosion process, high- erosion subsurface
characteristics
speed impingementof the
of specimens,
the erodent Al respectively. Moreover, in the erosion process, high-
2 O3 particles on the specimen surface can generate a
speed
high impingement
temperature of 400–500 ◦
of the erodent Al2O3 Under
C [21–24]. particles
theoninfluence
the specimen surface
of local can generate
pressure and higha
high temperature
temperature, of 400–500
the matrix of the°CAl[21–24].
alloy isUnder the influence
softened, of local are
and microcracks pressure and high
generated. In
temperature,
this the matrixthe
light, to investigate of the Al alloyofiserosion
influence softened,
on and microcracksstrength
the mechanical are generated. In this
and fracture
light, to investigate
toughness of the SLMthe influencealloy,
Al-10Si-Mg of erosion on FH
the F and the groups
mechanical strength after
of specimens and erosion
fracture
toughness of the SLM Al-10Si-Mg alloy, the F and FH groups of specimens
were denoted FE and FHE, respectively. The naming principles are summarized in Table after erosion
3.
were
In orderdenoted FE and
to explore the FHE,
phaserespectively.
transformation Theand
naming principles
degradation are summarized
behaviors caused byinsevere
Table
3. In order
particle to explore
erosion the phase transformation
[20], approximately 1000 g of Aland2 O3 degradation behaviors
ceramic particles caused
was used by se-
to erode
vere sides
both particle erosion
of the tensile[20],
andapproximately 1000 g specimens,
the impact toughness of Al2O3 ceramic
and theparticles
erosion was usedof
direction to
the erodent particles was parallel to the construction direction of the specimens (Figure 6).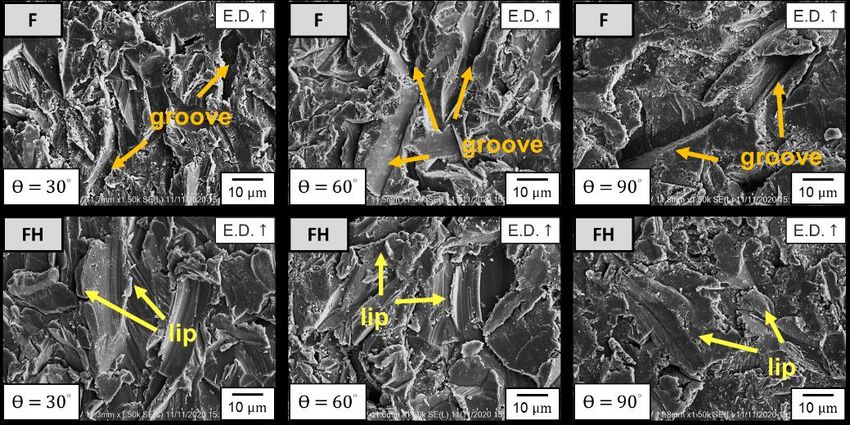
Nanomaterials 2021, 11, x FOR PEER REVIEW 6 of 17
Nanomaterials 2021, 11, 2131 6 of 17
erode both sides of the tensile and the impact toughness specimens, and the erosion di-
rection of the erodent particles was parallel to the construction direction of the specimens
To our6).
(Figure knowledge, no reports
To our knowledge, noon the effect
reports of effect
on the particle erosion erosion
of particle on the mechanical strength
on the mechanical
and impact
strength and toughness of SLM Al-10Si-Mg
impact toughness alloy arealloy
of SLM Al-10Si-Mg available. In this study,
are available. X-ray
In this diffraction
study, X-ray
spectroscopy (Bruker AXS GmbH, Karlsruhe, Germany) was also used
diffraction spectroscopy (Bruker AXS GmbH, Karlsruhe, Germany) was also used to ana-to analyze the phase
structure of the erosion surfaces of the FE and FHE groups of specimens
lyze the phase structure of the erosion surfaces of the FE and FHE groups of specimens toto demonstrate
the generation
demonstrate the mechanism of particle erosion
generation mechanism induced
of particle phase
erosion transformation.
induced XRD test uses
phase transformation.
copper
XRD testas the copper
uses target, Cu-Kα radiation
as the target, with radiation
Cu-Kα a wavelength withofa1.5418 Å, the scanning
wavelength of 1.5418 range
Å , theof
2θ is from 20 ◦ to 100◦ , and the scanning speed is 3◦ /min.
scanning range of 2θ is from 20° to 100°, and the scanning speed is 3°/min.
Figure 6.6.
Figure Tensile
Tensileand
andimpact
impacttoughness
toughnesstest
testspecimens
specimensafter
aftererosion.
erosion.
3.3.Results
Resultsand
andDiscussion
Discussion
3.1.
3.1.Microstructural
MicrostructuralCharacteristics
Characteristicsand
andMaterial
MaterialProperties
Properties
Figure
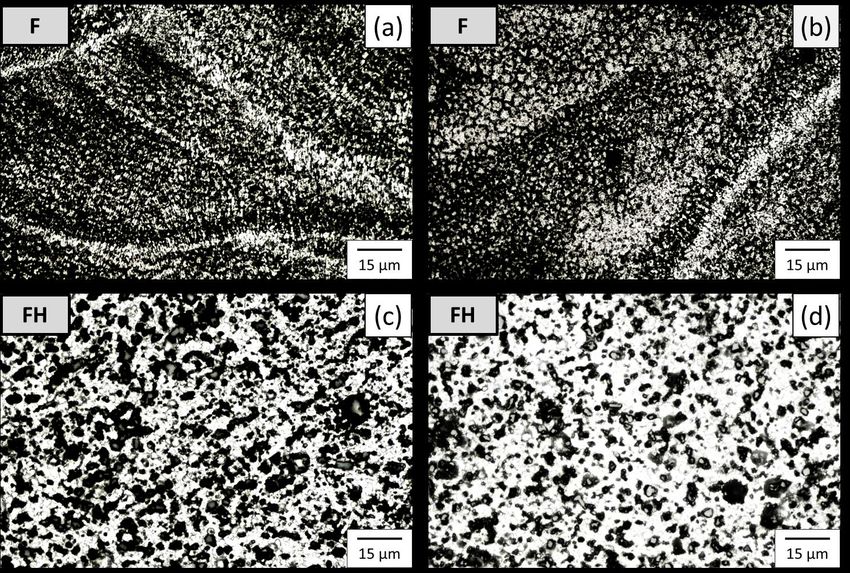
Figure7 7presents
presentsthe themicrostructures
microstructures of the the as-fabricated
as-fabricatedAl-10Si-Mg
Al-10Si-Mgspecimens
specimensbefore be-
andand
fore after T6T6
after heat
heat treatment
treatment(groups
(groupsFFand andFH)
FH) on on the surfaces
surfaces parallel
parallel(x (xsurface)
surface)and and
perpendicular (z surface) to the construction
perpendicular (z surface) to the construction direction. direction. The microstructure
microstructure of the F groupof
of the F group
ofspecimens
specimenson onthethex xsurface
surfacepresents
presents melting
meltingpools
poolswith fish-scale-like
with shapes,
fish-scale-like shapes,as illustrated
as illus-
in Figure
trated 7a, with
in Figure a width
7a, with of approximately
a width of approximately 100 µm,100 which
μm, whichis close to thetospot
is close size of
the spot the
size
oflaser sourcesource
the laser [25]. The[25].depth
The of theseofmelting
depth pools is approximately
these melting 30 µm, and
pools is approximately 30there
μm, are
andno
microholes
there between layers,
are no microholes indicating
between layers,that the SLMthat
indicating process
the SLMparameters
process were appropriately
parameters were
controlled [26]. On the z surface, the laser source left a strip-shaped
appropriately controlled [26]. On the z surface, the laser source left a strip-shaped laser laser scanning track,
as illustrated in Figure 7b. The extremely fast cooling rate in the
scanning track, as illustrated in Figure 7b. The extremely fast cooling rate in the SLM pro- SLM process caused
segregation
cess in the Al-10Si-Mg
caused segregation alloy duringalloy
in the Al-10Si-Mg solidification, leading to the
during solidification, formation
leading to theoffor-
long
dendritic crystals [27]. After T6 heat ◦ C, 2 h → (510 ◦
mation of long dendritic crystals [27].treatment (510 treatment
After T6 heat 170 °C,
C, 22h),
h →the 170
outline
°C, 2ofh),
the
melting
the outlinepools
of the and the scanning
melting pools and trajectory disappeared,
the scanning trajectory and coarse silicon
disappeared, and particles were
coarse sili-
formed.
con particlesThe supersaturated
were formed. The silicon was redissolved
supersaturated silicon was intoredissolved
the aluminum into matrix,
the aluminumand the
resulting microstructure is depicted in Figure 7c,d. Notably, the fine
matrix, and the resulting microstructure is depicted in Figure 7c,d. Notably, the fine grains grains distribute at the
boundaries of melting pool, and on the above of fine grains present
distribute at the boundaries of melting pool, and on the above of fine grains present radi- radiation-distributed
columnar grains.columnar
ation-distributed After T6 heat treatment,
grains. After T6silicon
heat precipitation
treatment, silicontransformed into spherical
precipitation trans-
formed into spherical form, with grain distribution converted into equiaxed grains due and
form, with grain distribution converted into equiaxed grains due to homogenization to
recrystallization.
homogenization and recrystallization.
Considering that the silicon content in the aluminum matrix and the morphology of
the precipitated silicon significantly influence the wear resistance of the Al-Si alloy [28,29],
the detailed structure of the melting pools was observed using SEM, and the silicon content
in different regions of the structure was analyzed using EDS. As illustrated in Figure 8,
the silicon content of the aluminum matrix was approximately 10.65 wt.%, which is close
to the silicon content of the Al alloy powder used in this study. The silicon content at the
boundary of the melting pools was approximately 18.40 wt.%. Therefore, the boundary
zone was termed the Si-rich phase [10,13,17]. These organizational differences have an
important effect on the subsequent erosion characteristics obtained in this study.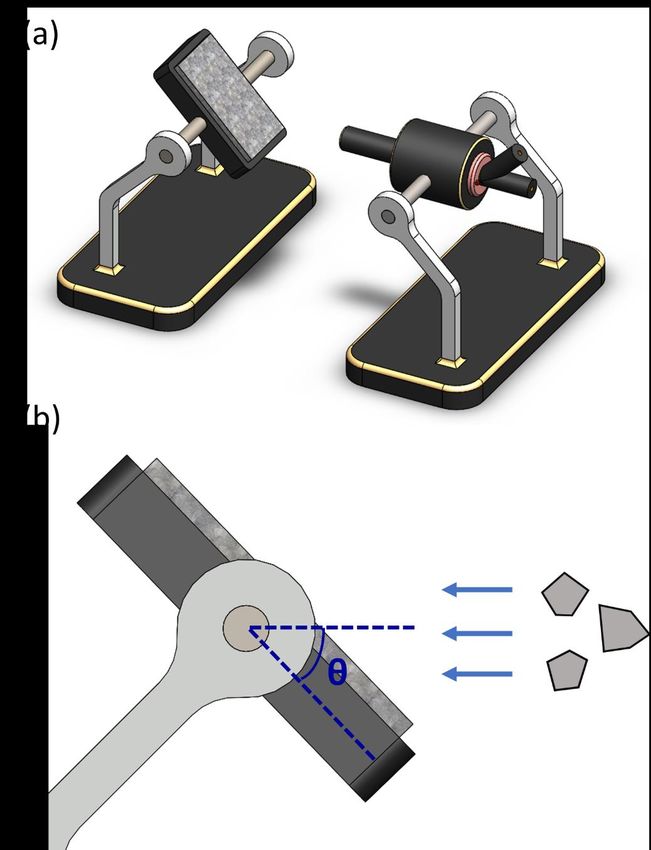
Nanomaterials 2021, 11, 2131 7 of 17
Nanomaterials 2021, 11, x FOR PEER REVIEW 7 of 17
Figure 7. Microstructure of the specimens in different observation planes: group F specimens on the
planes (a) parallel and (b) perpendicular to the construction direction, and group FH specimens on
the planes (c) parallel and (d) perpendicular to the construction direction.
Considering that the silicon content in the aluminum matrix and the morphology of
the precipitated silicon significantly influence the wear resistance of the Al-Si alloy [28,29],
the detailed structure of the melting pools was observed using SEM, and the silicon con-
tent in different regions of the structure was analyzed using EDS. As illustrated in Figure
8, the silicon content of the aluminum matrix was approximately 10.65 wt.%, which is
close to7.the
Figure silicon content
Microstructure of the Alinalloy
of the specimens powder
different usedplanes:
observation in this study.
group The silicon
F specimens on thecontent
Figure 7. Microstructure of the specimens in different observation planes: group F specimens on the
at the boundary of the melting pools was approximately 18.40 wt.%. Therefore, the
planes (a) parallel and (b) perpendicular to the construction direction, and group FH specimens on bound-
planes (a)
the zone parallel
planeswas and
(c) parallel (b)
andtheperpendicular
(d) perpendicularto the
to the construction
construction direction,
direction. and group FH specimens on
ary termed Si-rich phase [10,13,17]. These organizational differences have
the planes (c) parallel and (d) perpendicular to the construction direction.
an important effect on the subsequent erosion characteristics obtained in this study.
Considering that the silicon content in the aluminum matrix and the morphology of
the precipitated silicon significantly influence the wear resistance of the Al-Si alloy [28,29],
the detailed structure of the melting pools was observed using SEM, and the silicon con-
tent in different regions of the structure was analyzed using EDS. As illustrated in Figure
8, the silicon content of the aluminum matrix was approximately 10.65 wt.%, which is
close to the silicon content of the Al alloy powder used in this study. The silicon content
at the boundary of the melting pools was approximately 18.40 wt.%. Therefore, the bound-
ary zone was termed the Si-rich phase [10,13,17]. These organizational differences have
an important effect on the subsequent erosion characteristics obtained in this study.
Figure 8. (a) Detailed morphology of the melting pool and (b) silicon content in different regions of the melting pool.
Figure 8. (a) Detailed morphology of the melting pool and (b) silicon content in different regions of the melting pool.
The
The SLM
SLM process creates aa microstructure
process creates microstructure with with aa nonuniform
nonuniform distribution
distribution of of silicon
silicon
particles
particles inside
insidethethematerial.
material.The The evolution
evolution of the phase
of the structure
phase structure afterafter
heatheat
treatment was
treatment
analyzed
was analyzed usingusing
XRD,XRD,
and the
andresults are presented
the results are presented in Figure 9. The
in Figure 9. diffraction
The diffraction peaks cor-
peaks
responding to the α-Al phase clearly appeared in the XRD patterns
corresponding to the α-Al phase clearly appeared in the XRD patterns of the F and FH of the F and FH groups
of specimens.
groups A comparison
of specimens. betweenbetween
A comparison FiguresFigures
8 and 98 revealed
and 9 revealedthat the supersaturated
that the supersat-
Figure 8. (a) Detailed morphology
silicon of thesolution
solid melting pool and
was (b) silicon content
redissolved into inthe
different regions of
aluminum the melting
matrix and pool.
precipitated into
urated silicon solid solution was redissolved into the aluminum matrix and precipitated
coarse silicon
into coarse particles,
silicon thus causing
particles, the diffraction peakpeak
corresponding to silicon to rise.
The SLM process creates thus causing
a microstructure thewith
diffraction
a nonuniform corresponding
distribution to silicon
of silicon to
In addition,
rise. In the
addition, magnesium
the magnesium content in
content theinAl-10Si-Mg
the Al-10Si-Mgalloy was
alloy 1
waswt.%,
particles inside the material. The evolution of the phase structure after heat treatment was 1 and
wt.%, because
and becausethe
the diffraction
analyzed usingpeak
XRD,corresponding
and the results are to the Mg2 Si in
presented nanoparticles
Figure 9. The was close to
diffraction the α-Al
peaks cor- phase
(Al (1 1 1)), the Mg
responding to the α-Al Si phase diffraction peak was not clear in case of
2 phase clearly appeared in the XRD patterns of the F and FH groups the F and FH groups
of specimens. A comparison between Figures 8 and 9 revealed that
of specimens. Furthermore, the hardness data of the specimens are shown in Figure 10. the supersaturated
silicon to
Owing solid
the solution
extremelywasfine
redissolved into the aluminum
grains produced by the rapid matrix
coolingand inprecipitated into
the SLM process, the
coarse silicon particles, thus causing the diffraction peak corresponding
HRF hardness of the F group of specimens reached 98. The heat treatment process changed to silicon to rise.
In addition,
the the magnesium
silicon structure content in
and released the Al-10Si-Mg
residual alloy was
stress, which 1 wt.%,the
reduced andhardness
because the of the FH
group of specimens to 75.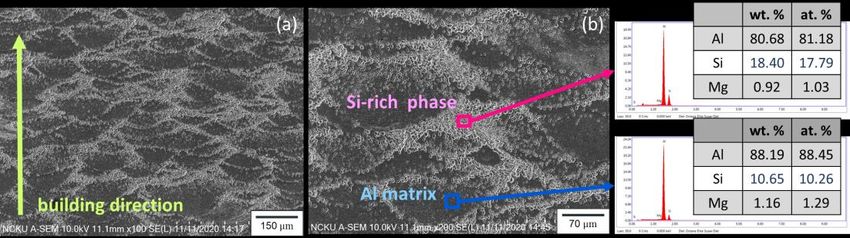
(1 1specimens.
1)), the MgFurthermore,
2Si phase diffraction peak data
the hardness was not clear
of the in case of
specimens arethe F andinFH
shown groups
Figure 10. of
Ow-
specimens.
ing to theFurthermore,
extremely finethe grains
hardness data of by
produced the the
specimens are shown
rapid cooling in Figure
in the 10. Ow-the
SLM process,
ingHRFto the extremely
hardness of fine
the Fgrains
group produced by the reached
of specimens rapid cooling
98. Thein the
heatSLM process,process
treatment the
HRF hardness of the F group of specimens reached 98. The heat treatment
changed the silicon structure and released residual stress, which reduced the hardness of process
changed
the FHthe silicon
group structure and
of specimens released residual stress, which reduced the hardness of
to 75.
Nanomaterials 2021, 11, 2131 8 of 17
the FH group of specimens to 75.
Figure 9. XRD patterns of the as-fabricated Al-10Si-Mg alloy before and after T6 heat treatment.
FigureFigure
9. XRD9. patterns of the of
XRD patterns as-fabricated Al-10Si-Mg
the as-fabricated alloy before
Al-10Si-Mg and after
alloy before and T6 heat
after T6treatment.
heat treatment.
Figure 10. HRF hardness of the as-fabricated Al-10Si-Mg alloy before and after T6 heat treatment.
Figure 10. HRF hardness of the as-fabricated Al-10Si-Mg alloy before and after T6 heat treatment.
3.2. of
Figure 10. HRF hardness Particle Erosion Wear
the as-fabricated Mechanism
Al-10Si-Mg alloy before and after T6 heat treatment.
According
3.2. Particle Erosionto studies
Wear in the literature [30–32], when a ductile metal material is hit
Mechanism
3.2. Particle
with Erosion
erodent Wear Mechanism
particles, the peak erosion rate appears at the ◦ –30◦ .
According to studies in the literature [30–32], when a impingement
ductile metal angles of 15
material is hit
Theerodent
with erosionto
According rates of the
studies
particles, in Fthe
the and
peak FH groups
literature
erosion ofappears
[30–32],
rate specimens
whenatathe as impingement
functions
ductile metalof the impingement
material
angles isofhit
15°–
with angle
erodentare illustrated
particles, in
the Figure
peak 11.
erosionThe erosion
rate rates
appears of
at the
the specimens
impingement in
30°. The erosion rates of the F and◦ FH groups of specimens as functions of the impinge- both
anglesgroups
of peaked
15°–
at an
30°.ment
The impingement
erosion
angle arerates angle
of the
illustrated F of 30
inand FH, 11.
Figure while
Thethe
groups of minimum
specimens
erosion erosion
rates ofasthe rate occurred
functions
specimens of the 90◦ . The
at groups
impinge-
in both
erosion rate decreasedinasFigure
the impingement angle increased ◦
after 30 rate
, which
ment angleatare
peaked anillustrated
impingement angle 11. Thewhile
of 30°, erosiontherates of the specimens
minimum erosion bothindicated
inoccurred
groups that
at 90°.
the ductile cutting mechanism dominated the wear fracture of
peaked at an impingement angle of 30°, while the minimum erosion rate occurred at 90°. both groups. In general,
the metallic materials with higher hardness have better wear resistance, but the results
presented in Figure 11 indicated that the wear resistance of the FH group of specimens was
superior to that of the group F specimens under all impingement angles. To clarify the wear
mechanism, we inspected the morphology of the erosion surface by using SEM (Figure 12),
and the results indicated that under impingement by irregularly shaped erodent particles,
many sharp grooves were formed in the F group of specimens because the Al2 O3 particles
cut through the material surface. By contrast, the FH group of specimens had a softer
matrix due to the heat treatment; the scratches on the erosion surface were gentler, and
many lip structures were formed adjacent to the erosion grooves. The main reason is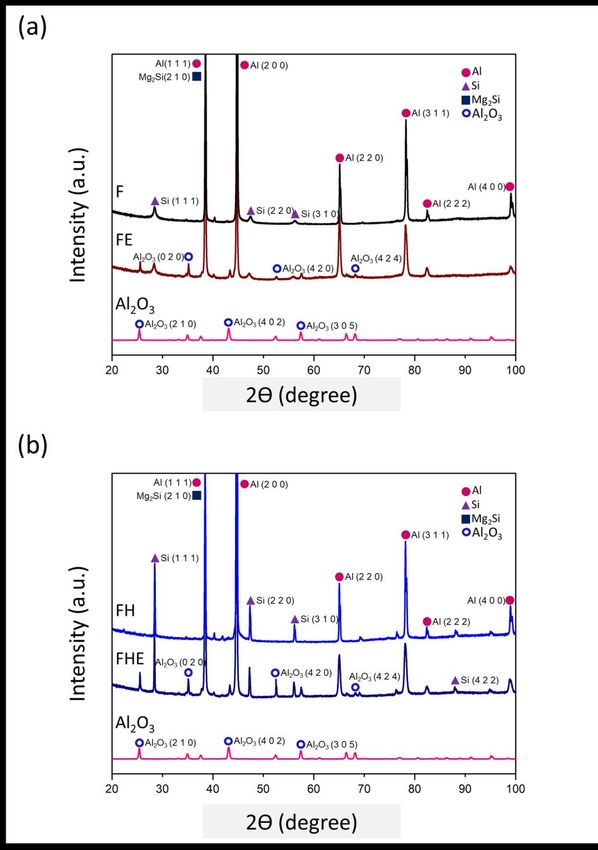
sults presented in Figure 11 indicated that the wear resistance of the FH group of speci-
mens was superior to that of the group F specimens under all impingement angles. To
clarify the wear mechanism, we inspected the morphology of the erosion surface by using
SEM (Figure 12), and the results indicated that under impingement by irregularly shaped
Nanomaterials 2021, 11, 2131 erodent particles, many sharp grooves were formed in the F group of specimens because 9 of 17
the Al2O3 particles cut through the material surface. By contrast, the FH group of speci-
mens had a softer matrix due to the heat treatment; the scratches on the erosion surface
were gentler, and many lip structures were formed adjacent to the erosion grooves. The
main reason is that
that heat heat treatment
treatment can generate
can generate strengthening
strengthening MgMg 2Si nanoprecipitates in
2 Si nanoprecipitates in the aluminum
the aluminum
matrix [33,34], which increases the resistance of the material
matrix [33,34], which increases the resistance of the materialtoto wear
wearandand microcrack
microcrack formation. Therefore, the lip structures were not completely separated from
formation. Therefore, the lip structures were not completely separated from the surface,
the surface, which led to the superior wear resistance of the Al-10Si-Mg alloy [21,24].
which led to the superior wear resistance of the Al-10Si-Mg alloy [21,24]. Moreover, based
Moreover, based on the erosion subsurface morphologies corresponding to different im-
pingementon the erosion
angles, subsurface
as depicted morphologies
in Figure corresponding
13, the FH group of specimens tohad
different
a higherimpingement
sur- angles,
as depicted
face roughness in Figure
than the F group13,
of the FH group
specimens of specimens
because had a of
the softer matrix higher surface
the former led roughness than
the F group
to the formation of lipofstructures.
specimens because
However, the softer
because matrix
changes in the ofmomentum
the formercompo-
led to the formation
of liptostructures.
nent normal However,
the erosion surface of the because changes
Al2O3 particles in theincrease
gradually momentum component normal to
as the impinge-
the erosion
ment angle increases,surface of the
many pits Al2 O3inparticles
appeared gradually
both groups at highincrease
impingementas the impingement angle
angles.
Therefore, in the follow-up
increases, many pits experiments,
appeared1000 g of Al
in both 2O3 particles
groups at high wasimpingement
used to study angles.
the Therefore,
erosion-induced phase transformation
in the follow-up experiments, of 1000
both groups
g of Alof O
2 3specimens
particles at an
was impingement
used to study the erosion-
angle ofinduced
90°. Furthermore, the effects ofof
phase transformation the phase
both transformation
groups of specimens induced
at anby the heat
impingement angle of 90◦ .
generated due to particle
Furthermore, theimpingement
effects of theand erosion-induced
phase transformation microcracks
inducedonbythe mechan-
the heat generated due to
ical properties and impact toughness of the SLM Al-10Si-Mg alloy were evaluated.
particle impingement and erosion-induced microcracks on the mechanical properties and
impact toughness of the SLM Al-10Si-Mg alloy were evaluated.
Figure 11. Erosion rate of the as-fabricated Al-10Si-Mg alloy before and after T6 heat treatment as a
Nanomaterials 2021, 11, x FOR PEER
Figure 11.REVIEW
Erosion rate of the as-fabricated Al-10Si-Mg alloy before and after T6 heat treatment as a 10 of 17
functionfunction of the impingement
of the impingement angle. angle.
Figure
Figure 12.12. Erosion
Erosion surface
surface morphology
morphology of as-fabricated
of the the as-fabricated Al-10Si-Mg
Al-10Si-Mg alloy alloy
beforebefore andT6
and after after
heatT6
heat treatment.
treatment.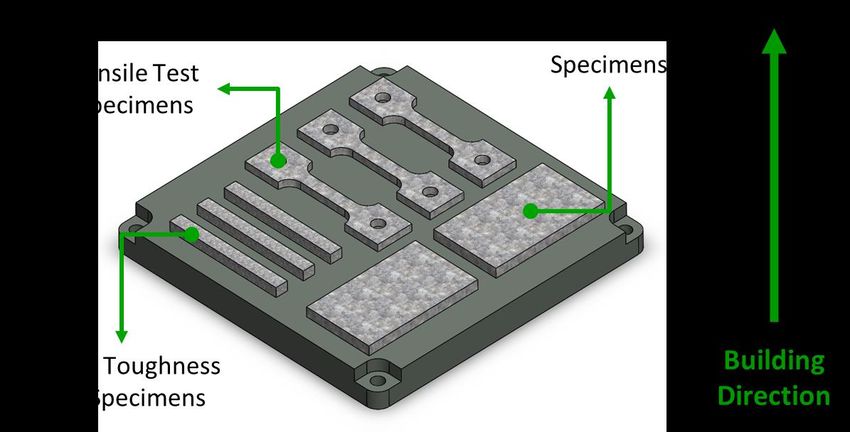
Nanomaterials 2021, 11, 2131 10 of 17
Figure 12. Erosion surface morphology of the as-fabricated Al-10Si-Mg alloy before and after T6
heat treatment.
Figure
Figure 13.
13. Erosion
Erosion subsurface
subsurface morphology
morphology of
of the
the as-fabricated
as-fabricated Al-10Si-Mg alloy before
Al-10Si-Mg alloy before and
and after
after T6
T6 heat
heat treatment.
treatment.
3.3.
3.3. Erosion
Erosion Induced
Induced Phase
Phase Transformation
Transformation
In
In particle erosion, theceramic
particle erosion, the ceramic particles
particleshithit
thethesurface
surfaceof the
of metal specimens
the metal at high
specimens at
speed, and their kinetic energy is converted into heat energy, which
high speed, and their kinetic energy is converted into heat energy, which can generate can generate temper-
atures of 400–500
temperatures °C instantaneously
of 400–500 [22,23,31]
◦ C instantaneously and cause
[22,23,31] andsurface oxidation
cause surface to formtoAlform
oxidation 2O3.
As depicted in Figure 14a,b, the F group of specimens transformed
Al2 O3 . As depicted in Figure 14a,b, the F group of specimens transformed into the FE into the FE group of
specimens after erosion. The diffraction peaks corresponding
group of specimens after erosion. The diffraction peaks corresponding to Al2 O3 were to Al 2O3 were generated at
six specificatdiffraction
generated six specificangles 2θ, and
diffraction the 2θ,
angles same andresults
the samewere obtained
results werefor the F group
obtained for theofF
specimens transformed
group of specimens into the FE
transformed intogroup
the FEof group
specimens. A comparison
of specimens. of the XRD
A comparison patterns
of the XRD
of the F, of
patterns FE,the
FH, F, and
FE, FH,FHEand groups
FHEof specimens
groups with thatwith
of specimens of the
thatAlof
2Othe
3 ceramic
Al2 O3 particles
ceramic
used in the
particles used erosion
in the experiment revealedrevealed
erosion experiment that only sixonly
that specific diffraction
six specific peaks peaks
diffraction corre-
sponding to the Al O phase of the erodent particles appeared in
corresponding to the Al2 O3 phase of the erodent particles appeared in the patterns of the
2 3 the patterns of the FE
and FHE groups of specimens. Notably, no ceramic particles remained
FE and FHE groups of specimens. Notably, no ceramic particles remained on the erosion on the erosion sur-
face of the
surface specimens
of the specimens observed
observed using
usingSEM
SEM (Figure
(Figure12).
12).ItItcan
canbebeinferred
inferredthat
that the
the particle
erosion caused (1) the formation
formation of of a surface
surface Al Al22O33 film;
film; (2)
(2) high
high temperature
temperature of the surface
to lead to redissolution of the supersaturated silicon into the α-Al matrix, resulting in a
slight dip in the silicon phase diffraction peak of the specimens specimens after after the
the particle
particle erosion;
erosion;
(3) deformation of the grains after erosion and microcrack formation [34]. In this light, it
is interesting to investigate the effect of particle erosion on the mechanical strength and
fracture toughness of the SLM Al-10Si-Mg alloy. alloy.
3.4. Changes in Tensile Mechanical Properties Caused by Erosion
The F and FH groups of specimens were compared, as illustrated in Figure 15a,b. The
yield strength (YS) and ultimate tensile strength (UTS) of the F group of specimens reached
181.63 and 297.75 MPa, respectively, but their uniform elongation (UE) and total elongation
(TE) were both 1.87% (low ductility). After T6 heat treatment, the UTS decreased from
297.75 to 286.02 MPa; YS increased from 181.63 to 221.09 MPa; UE and TE increased to
2.33% and 2.70% (ductility improvement), respectively. The morphologies of the tensile
fracture surface and the tensile fracture subsurface of the F and FH groups of specimens
are depicted in Figure 16a,b. The F group of specimens had insufficient ductility and broke
before necking. By contrast, the FH group of specimens, on which small dimples were
observed upon tensile fracture, had higher ductility. Based on a comparison of the tensile
fracture subsurface presented in Figure 16c,d, the F group of specimens fractured within
an extremely short time, resulting in a sharper fracture subsurface profile than that of the
FH group of specimens. The difference between the two groups can be compared more
clearly by using the enlarged views presented in Figure 16e,f. The failure of the FH groupNanomaterials 2021, 11, 2131 11 of 17
of specimens was attributed to the maximum shear stress induced by the tensile force, and
Nanomaterials 2021, 11, x FOR PEER REVIEW 11 of 1
the fracture subsurface profile was undulating and oriented at approximately 45◦ with
respect to the tensile direction.
Figure 14. XRD pattern: (a) XRD
Figure 14. the F pattern:
group of(a)specimens converted
the F group to FEconverted
of specimens after erosion;
to FE(b) theerosion;
after FH group of specimens
(b) the FH group con-
verted to FHE after
of erosion.
specimens converted to FHE after erosion.
According to thein
3.4. Changes literature [23], the local
Tensile Mechanical high temperature
Properties and high pressure gener-
Caused by Erosion
ated by the impact of high-speed particles during erosion softened
The F and FH groups of specimens were compared, as theillustrated
matrix in in
theFigure
region15a,b. Th
close to 200
yield strength (YS) and ultimate tensile strength (UTS) of the F group ofthespecimen
µm below the Al-alloy surface. In addition, ceramic particles accompanying
fluid hit the surface
reached of the
181.63 metal
and specimen
297.75 at high speeds,
MPa, respectively, but which distorted
their uniform and deformed
elongation (UE) and tota
the crystal grains near the surface and generated microcracks [35]. Thus,
elongation (TE) were both 1.87% (low ductility). After T6 heat treatment, in this study, the
the UTS de
F and FHcreased
groupsfrom
of specimens were subjected to particle erosion with an impingement
297.75 to 286.02 MPa; YS increased from 181.63 to 221.09 MPa; UE and TE
angle of 90 ◦ on both sides to analyze the changes in their mechanical properties and impact
increased to 2.33% and 2.70% (ductility improvement), respectively. The morphologies o
toughness (Figure 6).
the tensile fracture surface and the tensile fracture subsurface of the F and FH groups o
specimens are depicted in Figure 16a,b. The F group of specimens had insufficient ductil
ity and broke before necking. By contrast, the FH group of specimens, on which smal
dimples were observed upon tensile fracture, had higher ductility. Based on a comparison
of the tensile fracture subsurface presented in Figure 16c,d, the F group of specimens frac
tured within an extremely short time, resulting in a sharper fracture subsurface profilNanomaterials 2021, 11, 2131 12 of 17
After erosion, the YS and UTS of the FE group of specimens decreased from 182.63
and 297.75 MPa to 145.77 and 261.86 MPa, respectively, compared with the F group of
specimens. The YS and UTS of the FHE group of specimens decreased from 221.09 and
286.02 MPa to 147.74 and 197.03 MPa, respectively, compared with the FH group of
specimens. By contrast, the UE and TE of the FE group of specimens increased from 1.87%
to 4.93%, compared with the F group of specimens. The UE and TE of the FE group
Nanomaterials 2021, 11, x FOR PEER REVIEW 12 of of
17
specimens increased from 2.33%. The experimental results indicate that under severe
erosion conditions, the tensile strength of the as-fabricated Al-10Si-Mg alloy decreases, but
the softening of the Al matrix due to the high surface temperature increases the elongation
than that of the
significantly. FH group ofafter
Furthermore, specimens.
erosion,The difference
Young’s between
moduli of the the two groups
specimens can
of the twobe
compared more clearly by using the enlarged views presented in Figure 16e,f. The
groups tend to decrease (Figure 16), indicating that erosion not only affects the changes in failure
of the FH
tensile groupand
strength of specimens
elongation was attributed
but also directlytodegrades
the maximum shear
material stress induced
elasticity. by the
The coefficient
tensile force, and the fracture subsurface profile was undulating and oriented at approxi-
of elasticity (Figure 17). These results directly affect the impact toughness of SLM Al-10Si-
mately
Mg 45° with respect to the tensile direction.
alloy.
Figure 15. (a) Mechanical strength and (b) elongation of the F, FH, FE, and FHE groups of specimens.
Figure 15. (a) Mechanical strength and (b) elongation of the F, FH, FE, and FHE groups of speci-
mens.Nanomaterials 2021, 11, 2131 13 of 17
Nanomaterials 2021, 11, x FOR PEER REVIEW 13 of
Nanomaterials 2021, 11, x FOR PEER REVIEW 14 of 17
tensile
Figure 16. (a,b) Tensile strength
fracture andmorphology;
surface elongation (c,d)
but also directly
fracture degrades
subsurface; materialviews
(e,f) enlarged elasticity.
of the The coeffi-
fracture subsur-
Figure 16.
cient of (a,b) Tensile fracture surface morphology; (c,d) fracture subsurface; (e,f) enlarged views
face of F and FH groups of elasticity
specimens.(Figure 17). These results directly affect the impact toughness of SLM
ofAl-10Si-Mg
the fracture subsurface
alloy. of F and FH groups of specimens.
According to the literature [23], the local high temperature and high pressure gene
ated by the impact of high-speed particles during erosion softened the matrix in the regi
close to 200 μm below the Al-alloy surface. In addition, ceramic particles accompanyi
the fluid hit the surface of the metal specimen at high speeds, which distorted and d
formed the crystal grains near the surface and generated microcracks [35]. Thus, in th
study, the F and FH groups of specimens were subjected to particle erosion with an im
pingement angle of 90° on both sides to analyze the changes in their mechanical propert
and impact toughness (Figure 6).
After erosion, the YS and UTS of the FE group of specimens decreased from 182.
and 297.75 MPa to 145.77 and 261.86 MPa, respectively, compared with the F group
specimens. The YS and UTS of the FHE group of specimens decreased from 221.09 a
286.02 MPa to 147.74 and 197.03 MPa, respectively, compared with the FH group of spe
imens. By contrast, the UE and TE of the FE group of specimens increased from 1.87%
4.93%, compared with the F group of specimens. The UE and TE of the FE group of spe
Changes in the stress–strain imens
curve of increased
SLM from alloy
Al-10Si-Mg 2.33%. Theand
before experimental
afterafter results
erosion: indicate
(a) groups that
F andFFE under
and severe erosi
Figure 17.17.
Figure Changes in the stress–strain curve of SLM Al-10Si-Mg alloy before and erosion: (a) groups and FE(b)
and
groups FH and
(b) groups FHFHE.
and FHE. conditions, the tensile strength of the as-fabricated Al-10Si-Mg alloy decreases, but t
softening of the Al matrix due to the high surface temperature increases the elongati
significantly.
3.5. Changes Furthermore,
in Impact Toughness Causedafter erosion, Young’s moduli of the specimens of the tw
by Erosion
groups tend to decrease (Figure 16), indicating that erosion not only affects the changes
In this study, an impact fracture test was performed to evaluate the impact toughness
of the specimens from the four groups. The energy absorbed per unit area was calculated
at the point of specimen fracture. The morphology of the impact fracture surface was ob-
served with SEM to clarify the fracture mechanism. Figure 18 shows that the impact frac-
ture toughness of the specimens increased by approximately 20% after the T6 heat treat-
ment. However, due to the composite effect of microcracks and the matrix softeningNanomaterials 2021, 11, 2131 14 of 17
3.5. Changes in Impact Toughness Caused by Erosion
In this study, an impact fracture test was performed to evaluate the impact toughness
of the specimens from the four groups. The energy absorbed per unit area was calculated
at the point of specimen fracture. The morphology of the impact fracture surface was
observed with SEM to clarify the fracture mechanism. Figure 18 shows that the impact
fracture toughness of the specimens increased by approximately 20% after the T6 heat
treatment. However, due to the composite effect of microcracks and the matrix softening
caused by the erosion, the impact toughness of the specimens decreased. Comparing group
F and FE, as well as group FH and FHE, respectively, the impact toughness decreased by
about 11%. The surface morphology of the region near the starting point of the fracture was
inspected using SEM (Figure 19). The F group of specimens exhibited superior ductility,
and their fracture-induced dimples were smaller and denser than those of the FH group of
specimens. Compared with the characteristics of tensile failure, the specimens are subjected
to the shear force, which is rapid and parallel to the fracture surface during the impact,
so that the specimens of groups FE and FHE have the same cracking wave pattern as the
impact direction. After erosion, the surface layer of the SLM Al-10Si-Mg alloy was softened
at high temperatures, and the microcracks induced by erosion directly decreased Young’s
Nanomaterials 2021, 11, x FOR PEER REVIEW
modulus of the material, thus leading to a decrease in the impact toughness of the15SLM of 17
Al-10Si-Mg alloy.
Figure 18.Impact
Figure18. Impacttoughness
toughnessofofspecimens
specimensfrom
fromeach group
each before
group (F, (F,
before FH)FH)
andand
afterafter
(FE,(FE,
FHE) erosion
FHE) ero-
in terms
sion of theofenergy
in terms absorbed
the energy per unit
absorbed perarea.
unit area.Nanomaterials 2021, 11, 2131 15 of 17
Figure 18. Impact toughness of specimens from each group before (F, FH) and after (FE, FHE) ero-
sion in terms of the energy absorbed per unit area.
Figure 19. Impact fracture surfaces of the (a) F, (b) FE, (c) FH, and (d) FHE groups of specimens.
Figure 19. Impact fracture surfaces of the (a) F, (b) FE, (c) FH, and (d) FHE groups of specimens.
4. Conclusions
(1) After the T6 heat treatment of SLM Al-10Si-Mg alloy, the supersaturated silicon solid
redissolved into the aluminum matrix and formed strengthening Mg2 Si nanopre-
cipitates in the aluminum matrix. The SLM process produced extremely fine grains
with high hardness. After the T6 heat treatment, the microstructure of the material
changed, and stress was released, which reduced the hardness of the material.
(2) The maximum and minimum erosion rates of the F and FH groups of specimens
occurred at 30◦ and 90◦ , respectively. The erosion fracture was dominated by the
ductile cutting mechanism. The T6 heat treatment improved the ductility of the
material and generated strengthening Mg2 Si nanoprecipitates, which can improve
the wear resistance of the material.
(3) The tensile strength of the SLM Al-10Si-Mg alloy decreased after erosion. The high
surface temperature induced by particle impingement softened the aluminum matrix
and increased the elongation significantly. Moreover, erosion of the die reduced
Young’s modulus and impact toughness of the SLM Al-10Si-Mg alloy.
Author Contributions: Methodology, B.-C.H.; investigation, B.-C.H.; data curation, B.-C.H.; writing—
original draft preparation, B.-C.H.; writing—review and editing, F.-Y.H.; supervision, F.-Y.H. All
authors have read and agreed to the published version of the manuscript.
Funding: This research received no external funding.
Institutional Review Board Statement: Not applicable.
Informed Consent Statement: Not applicable.
Data Availability Statement: The data presented in this study are available on request from the
corresponding author.
Acknowledgments: The authors are grateful to the Instrument Center of National Cheng Kung
University and the Ministry of Science and Technology of Taiwan (Grant No. MOST 108-2221-E-006-
140-MY3) for their financial support.
Conflicts of Interest: The authors declare no conflict of interest.Nanomaterials 2021, 11, 2131 16 of 17
References
1. Wu, L.; Zhu, H.; Gai, X.; Wang, Y. Evaluation of the mechanical properties and porcelain bond strength of cobalt-chromium
dental alloy fabricated by selective laser melting. J. Prosthet. Dent. 2014, 111, 51–55. [CrossRef]
2. Yasa, E.; Kruth, J.-P. Microstructural investigation of Selective Laser Melting 316L stainless steel parts exposed to laser re-melting.
Procedia Eng. 2011, 19, 389–395. [CrossRef]
3. Cherry, J.; Davies, H.; Mehmood, S.; Lavery, N.; Brown, S.; Sienz, J. Investigation into the effect of process parameters on
microstructural and physical properties of 316L stainless steel parts by selective laser melting. Int. J. Adv. Manuf. Technol. 2015, 76,
869–879. [CrossRef]
4. Zhang, J.; Song, B.; Wei, Q.; Bourell, D.; Shi, Y. A review of selective laser melting of aluminum alloys: Processing, microstructure,
property and developing trends. J. Mater. Sci. Technol. 2019, 35, 270–284. [CrossRef]
5. Chang, K.C.; Zhao, J.R.; Hung, F.Y. Effects of Hyper-High-Temperature Solid-Solution Treatment on Microstructure Evolution
and Nanoprecipitation of the Al-Ni-Cu-Fe-Zr-Sc Alloy Manufactured by Selective Laser Melting. J. Alloys Compd. 2021, 883,
160781. [CrossRef]
6. Zhang, W.N.; Wang, L.Z.; Feng, Z.X.; Chen, Y.M. Research progress on selective laser melting (SLM) of magnesium alloys: A
review. Optik 2020, 207, 163842. [CrossRef]
7. Gieseke, M.; Noelke, C.; Kaierle, S.; Wesling, V.; Haferkamp, H. Selective laser melting of magnesium and magnesium alloys. In
Magnesium Technology 2013; Springer: Cham, Switzerland, 2013; pp. 65–68.
8. Zhang, L.C.; Attar, H. Selective laser melting of titanium alloys and titanium matrix composites for biomedical applications: A
review. Adv. Eng. Mater. 2016, 18, 463–475. [CrossRef]
9. Zhao, J.-R.; Hung, F.-Y.; Lui, T.-S.; Wu, Y.-L. The relationship of fracture mechanism between high temperature tensile mechanical
properties and particle erosion resistance of selective laser melting Ti-6Al-4V alloy. Metals 2019, 9, 501. [CrossRef]
10. Wu, J.; Wang, X.; Wang, W.; Attallah, M.; Loretto, M. Microstructure and strength of selectively laser melted AlSi10Mg. Acta
Mater. 2016, 117, 311–320. [CrossRef]
11. Yan, Q.; Song, B.; Shi, Y. Comparative study of performance comparison of AlSi10Mg alloy prepared by selective laser melting
and casting. J. Mater. Sci. Technol. 2020, 41, 199–208. [CrossRef]
12. Liu, X.; Zhao, C.; Zhou, X.; Shen, Z.; Liu, W. Microstructure of selective laser melted AlSi10Mg alloy. Mater. Des. 2019, 168, 107677.
[CrossRef]
13. Liu, Y.; Liu, Z.; Jiang, Y.; Wang, G.; Yang, Y.; Zhang, L. Gradient in microstructure and mechanical property of selective laser
melted AlSi10Mg. J. Alloy. Compd. 2018, 735, 1414–1421. [CrossRef]
14. Tradowsky, U.; White, J.; Ward, R.; Read, N.; Reimers, W.; Attallah, M. Selective laser melting of AlSi10Mg: Influence of
post-processing on the microstructural and tensile properties development. Mater. Des. 2016, 105, 212–222. [CrossRef]
15. Trevisan, F.; Calignano, F.; Lorusso, M.; Pakkanen, J.; Aversa, A.; Ambrosio, E.P.; Lombardi, M.; Fino, P.; Manfredi, D. On the
selective laser melting (SLM) of the AlSi10Mg alloy: Process, microstructure, and mechanical properties. Materials 2017, 10, 76.
[CrossRef]
16. Brandl, E.; Heckenberger, U.; Holzinger, V.; Buchbinder, D. Additive manufactured AlSi10Mg samples using Selective Laser
Melting (SLM): Microstructure, high cycle fatigue, and fracture behavior. Mater. Des. 2012, 34, 159–169. [CrossRef]
17. Chen, K.-J.; Hung, F.-Y.; Lui, T.-S.; Tsai, C.-L. Improving the applicability of wear-resistant Al–10Si–0.5 Mg alloy obtained through
selective laser melting with T6 treatment in high-temperature, and high-wear environments. J. Mater. Res. Technol. 2020, 9,
9242–9252. [CrossRef]
18. Zhu, Y.; Zou, J.; Zhao, W.; Chen, X.; Yang, H. A study on surface topography in cavitation erosion tests of AlSi10Mg. Tribol. Int.
2016, 102, 419–428. [CrossRef]
19. Zou, J.; Zhu, Y.; Pan, M.; Xie, T.; Chen, X.; Yang, H. A study on cavitation erosion behavior of AlSi10Mg fabricated by selective
laser melting (SLM). Wear 2017, 376, 496–506. [CrossRef]
20. Zhao, J.-R.; Hung, F.-Y.; Lui, T.-S. Erosion Resistance and Particle Erosion-Induced Tensile Embrittlement of 3D-Selective Laser
Melting Inconel 718 Superalloy. Metals 2020, 10, 21. [CrossRef]
21. Harsha, A.; Bhaskar, D.K. Solid particle erosion behaviour of ferrous and non-ferrous materials and correlation of erosion data
with erosion models. Mater. Des. 2008, 29, 1745–1754. [CrossRef]
22. Hung, F.-Y.; Chen, L.-H.; Lui, T.-S. Phase transformation of an austempered ductile iron during an erosion process. Mater. Trans.
2004, 45, 2981–2986. [CrossRef]
23. Liou, J.; Lui, T.; Chen, L. SiO2 particle erosion of A356. 2 aluminum alloy and the related microstructural changes. Wear 1997, 211,
169–176. [CrossRef]
24. Malik, J.; Toor, I.; Ahmed, W.; Gasem, Z.; Habib, M.; Ben-Mansour, R.; Badr, H. Evaluating the effect of hardness on erosion
characteristics of aluminum and steels. J. Mater. Eng. Perform. 2014, 23, 2274–2282. [CrossRef]
25. Chang, K.-C.; Zhao, J.-R.; Hung, F.-Y. Microstructure, mechanical properties, and fatigue fracture characteristics of high-fracture-
resistance selective laser melting Al-Ni-Cu alloys. Metals 2021, 11, 87. [CrossRef]
26. Tran, H.-C.; Lo, Y.-L. Systematic approach for determining optimal processing parameters to produce parts with high density in
selective laser melting process. Int. J. Adv. Manuf. Technol. 2019, 105, 4443–4460. [CrossRef]
27. Hadadzadeh, A.; Amirkhiz, B.S.; Li, J.; Mohammadi, M. Columnar to equiaxed transition during direct metal laser sintering of
AlSi10Mg alloy: Effect of building direction. Addit. Manuf. 2018, 23, 121–131. [CrossRef]You can also read