DRAFT Truck impact chart - Technical Advisory Procedure - Australian Trucking Association
←
→
Page content transcription
If your browser does not render page correctly, please read the page content below

DRAFT

Truck impact chart

                                                 Technical
                                                 Advisory
                                                 Procedure

         Developed by the ATA Industry Technical Council
                   2.2 edition – March 2018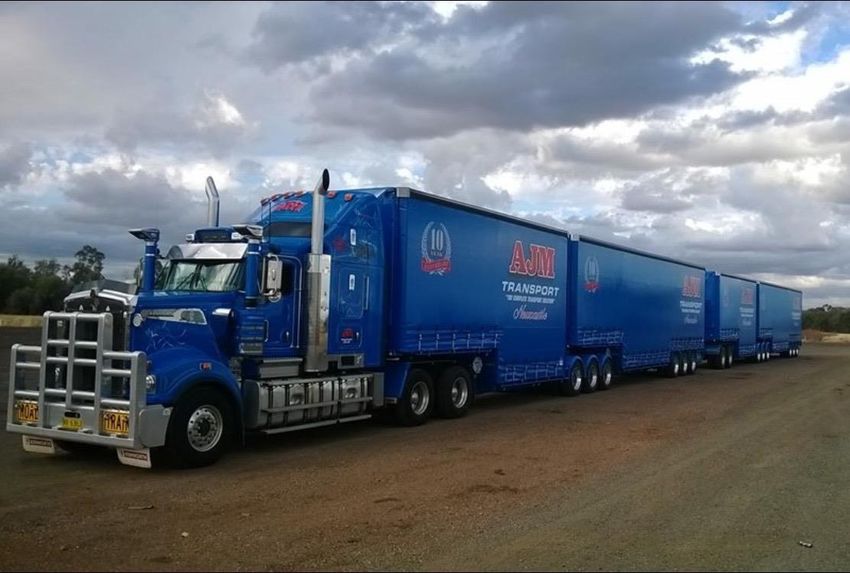
© 2010 Australian Trucking Association Ltd (first edition)
© 2016 Australian Trucking Association Ltd (2.1 edition with minor updates)

This work is copyright. Apart from uses permitted under the Copyright Act 1968, no part may be
reproduced by any process without prior written permission from the Australian Trucking Association.
Requests and inquiries concerning reproduction rights should be addressed to the Communications
Manager, Australian Trucking Association, 25 National Circuit, Forrest ACT 2603 or ata@truck.net.au.

About this Technical Advisory Procedure (TAP):

This Technical Advisory Procedure is published by the Australian Trucking Association Ltd
(ATA) to assist the road transport industry in achieving improved access for higher
productivity freight vehicles.

This TAP is not, nor is it intended to be, complete or without exceptions.

The Technical Advisory Procedure is a guide only and its use is entirely voluntary.
Recommendations or procedures may not be suitable for or applicable to all operators.
Operators should consider their own circumstances, practices and procedures when using
this Technical Advisory Procedure.

Operators must comply with the Australian Design Rules (ADRs), the Australian Vehicle
Standards Regulations, roadworthiness guidelines and any specific information and
instructions provided by manufacturers in relation to the vehicle systems and components.

No endorsement of products or services is made or intended. Brand names, where used in this
Technical Advisory Procedure, are for illustrative purposes only.

Suggestions or comments about this Technical Advisory Procedure are welcome. Please
write to the Industry Technical Council, Australian Trucking Association, Minter Ellison
Building, 25 National Circuit, Forrest ACT 2603.

DISCLAIMER

The ATA makes no representations and provides no warranty that the information and
recommendations contained in this Technical Advisory Procedure are suitable for use by, or
applicable for all operators, up to date, complete or without exception. Reliance or use upon the
information or recommendations is voluntary and the user accepts all risks and responsibility for any
such reliance or use and to the maximum extent permitted by law the ATA excludes all liability to any
person arising directly or indirectly out of any such reliance or use.

Truck impact chart – 2.2 edition, March 2018                                                Page 2 of 26
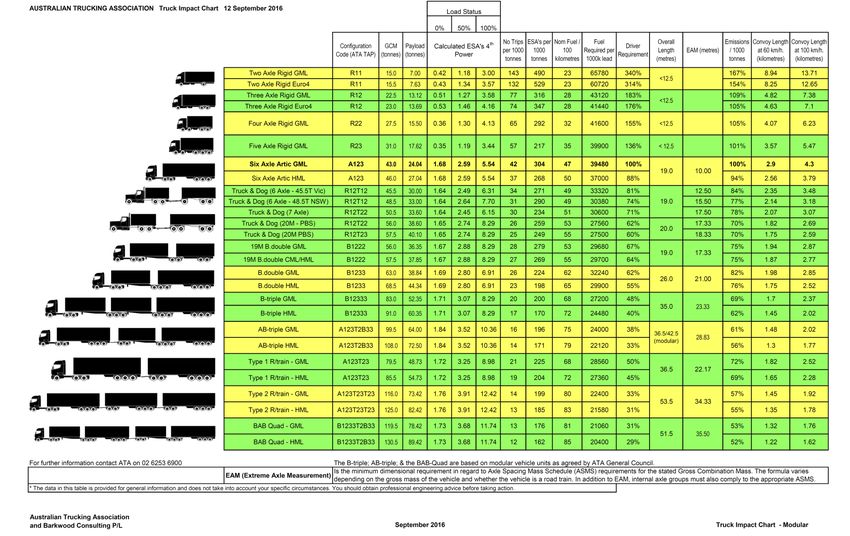
Table of Contents

   Disclaimer                                                                   2

   1) Introduction                                                              4

   Part 1: Truck Impact Chart

   2) Understanding the Truck Impact Chart (Chart)                              4

   3) The Truck Impact Chart                                                    9

   4) Illustrated example using the Chart                                     10

   Part 2: Additional supportive information

   5) Other areas that may assist with the uptake of HPFVs                    11

               a) Engine exhaust emissions                                    11

               b) Fuel quality                                                13

               c) Truck versus car fuel consumption comparison                13

               d) Driving license category and requirements                   14

               e) Specific additional requirements for a 26 m B-double        15

               f) Safety developments and the ADRs                            15

               g) Safety statistics                                           15

   Part 3: Performance Based Standards (PBS) and non modular
   configurations and their impact                                            17

              a. Low speed swept path                                         18

              b. Static rollover threshold                                    19

              c. High speed transient tracking                                20

              d. Rearward amplification                                       21

   Appendix 1 – Truck impact chart, modular combination

   Appendix 2 – Truck impact chart, non-modular combination

Truck impact chart – 2.2 edition, March 2018                             Page 3 of 26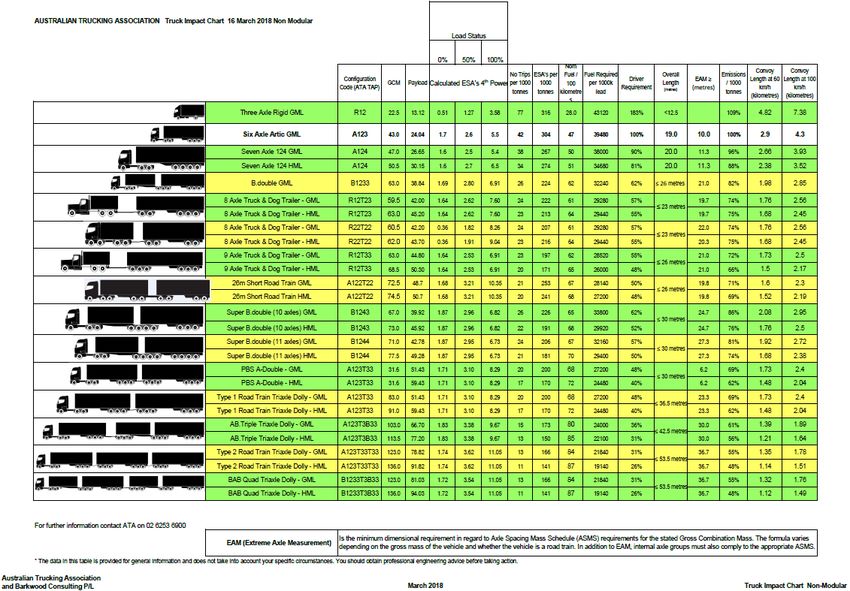
1) Introduction

This Technical Advisory Procedure (TAP) has been developed by the ATA Industry
Technical Council (ITC) to assist operators and assets managers in assessing the
impact of Higher Productivity Freight Vehicles (HPFV) for a transport task on the
road network.

The Truck Impact Chart (TIC) is used in comparing the impact of different vehicle
combinations for a range of parameters to assist with access determination. However
it is not the whole story, no matter how big or small the combination is, access still
needs take into account the ability of the unit to negotiate its way through or within
the area.

The original authors David Coonan (ATA, now retired) and Bob Woodward
(Barkwood Consulting) published the first edition of the truck impact chart in 2010.
This second edition document builds on the original and includes updated vehicle
combinations, axle loadings and detailed explanations.

Western Australia and the Northern Territory have not implemented the national
framework as managed by the National Heavy Vehicle Regulator and as a result
there are some different arrangements there and some parts of the chart will not
apply in the jurisdications.

Part 1: Truck Impact Chart

    2) Understanding the chart

To support the foundations of the chart, key vehicle operating information was sourced
via a survey of operators covering fuel consumption, tare/payload and operational
environment for the range of configurations. This foundation is sound moving into the
future as the conditions and assumptions typically move relative to each other. In
percentage terms, nothing changes.

    a) General comments
The key freight task benchmark is based on moving 1,000 tonnes of payload with a
lead of 1,000 kilometres (a thousand kilometres out laden and a thousand kilometres
back unladen). This won’t be true all of the time in the real world, but is indicative of
how trucks operate and provides a consistent point for the chart’s calculations.

The base configuration (highlighted in the chart) has been lifted from a three axle
rigid in the first edition to a six axle semi-trailer operating under general access mass
limits for this the second edition.

Unless otherwise stated the combination is based on a tandem converter dolly. This
will create a modular configuration which means that when a long combination is
broken down and the tandem drive prime mover replaces the dolly, this will allow it to
comply with the GML requirements.

Truck impact chart – 2.2 edition, March 2018                                    Page 4 of 26
It should be noted that general freight vehicles frequently cube out before they weigh
out which means they don’t operate at the axle group’s mass limits, further reducing
the pavement wear.
b) Description of the configuration
It is useful to understand the coding used to identify the following selected longer
vehicles and combinations. Descriptions are often used but can be too broad and
often add confusion.
Code breakdown
A – Articulated unit
R – Rigid unit
T – Trailer unit
B – B trailer
n – Numbers refer to the number of axles in each axle group
A123T2B33 describes the truck shown on the front cover or more commonly referred
to as an AB-triple. It is an articulated unit with a single steer axle, tandem drive
pulling a 3 axle semi, plus an additional dog B-double trailer set made up of a 2 axle
converter dolly, 3 axle A-trailer and 3 axle B-trailer.
For full explanation of the coding, refer to description of truck configurations TAP.
c) Gross Combination Mass (GCM, tonnes)
The Australian Design Rules (ADRs) define the GCM as value specified for the
vehicle by the ‘Manufacturer’ as being the maximum of the sum of the ‘Gross Vehicle
Mass’ of the drawing vehicle plus the sum of the ‘Axle Loads’ of any vehicle capable
of being drawn as a trailer. However, within this document we are only interested in
the maximum mass of the vehicle and any trailers that may lawfully be driven on
road, being the sum of the allowable axle loads.
d) Payload (tonnes)
Maximum payload is the difference between GCM and the combination’s tare weight.
Payloads used in the Truck Impact Chart are based on combination averaged tare
weights and payload data based on the average of the feedback for the particular
combination from the ATA operator survey.
e) Mass limits
General Mass Limits (GML) – It is the heavy vehicle general axle mass limits
prescribed in the Heavy Vehicle National Law (HVNL) that apply to public roads in
Australia unless otherwise limited by load restriction signs.
Concessional Mass Limits (CML) – It is a mass exception under the HVNL which
allows concessional mass limits for particular vehicles or vehicle combinations
dependent on certain conditions being met (e.g. must hold NHVAS Mass
Management Accreditation).
Truck impact chart – 2.2 edition, March 2018 Page 5 of 26The mass exception allows tandem and tri-axle groups to be 5% above general mass
limits (GML), with a maximum gross mass increase of 1.0 tonne for a vehicle up to a
GCM of 55.0 tonnes and 2.0 tonne for a vehicle exceeding a GCM of 55.0 tonnes.
Refer to the National Heavy Vehicle Regulator (NHVR) website for further details –
https://www.nhvr.gov.au/
Higher Mass Limits (HML) – It is a mass exception under the HVNL which allows
higher mass limits on approved routes for particular vehicles or vehicle combinations
dependent on specific conditions being met.
Typically, heavy vehicles will be allowed higher mass limits entitlements provided:-
• Operators of the vehicles or combination running HML on triaxle groups are
accredited under the Mass Management Module of the National Heavy Vehicles
Accreditation Scheme (NHVAS), with an accreditation label fitted to the hauling
unit.
• Vehicles are fitted with certified road friendly suspensions.
• Vehicles are operating on an authorised HML route.
• Intelligent Access Program (IAP) registration may also be required.
Road Friendly Suspensions (RFS) - The requirements for RFS certification is cover
in VSB 11 – Certification of Road Friendly Suspensions.1 A listing of certified RFS
systems is available on the Commonwealth Department of Infrastructure and
Transport’s website.2 Table 1 shows a comparison of the mass limits permitted
under the three mass limit regimes.
Comparison Maximum mass Maximum mass Maximum mass
permitted under permitted under permitted under
GML (tonnes) CML (tonnes) HML (tonnes)
Tandem axle group 16.5 17.0 17.0
Triaxle group 20.0 21.0 22.5
Quad axle group 27.0
20.0 NA
(Under review) (PBS only)
Single drive axle on a bus 9.0 NA 10.0
Table 1: Comparison of the 3 mass limits for axle groups fitted with dual tyres
1
https://infrastructure.gov.au/roads/vehicle_regulation/bulletin/pdf/vsb_11.pdf
2
https://infrastructure.gov.au/roads/vehicle_regulation/suspension.aspx
Truck impact chart – 2.2 edition, March 2018 Page 6 of 26Table 2 has been provided to illustrate the different mass limits for a 9 axle B-double
truck (B1233). The information has been taken from the National Heavy Vehicle
Mass and Dimension Limits fact sheet, February 20143.
Maximum Allowable Single Twin Steer Single Tandem Triaxle
Type of Mass Length GVM/GCM Steer Axle Axle Axle Axle Group
Limit Group Group
(metres) (tonnes) (tonnes) (tonnes) (tonnes) (tonnes) (tonnes)
GML 25.0 62.5 6.0 N/A N/A 16.5 20.0 per tri
axle group
CML 25.0 64.5 6.0 N/A N/A 16.5 21.0 per tri
axle group
HML 25.0 68.0 6.0 N/A N/A 17.0 22.5 per tri
axle group
Table 2: Example to illustrate the impact of the different mass limits for B-double truck
26 m is available to eligible vehicles
f) Equivalent Standard Axles (ESA)
Equivalent Standard Axle (ESA) is a method of standardizing various axle
configurations and loads and their effects on road pavements. ESAs are assessed by
calculating the ratio of a load on an axle or axle group divided by a reference load
and then raising the ratio to the fourth power.
In the TIC, ESA’s are calculated using the sum of the ESA’s for zero load (empty)
plus the ESA’s for 100% loaded and multiplied by the number of trips as required for
the transport task.
The 50 percent load factor has been used as a benchmark reference. For the ESA’s
of a vehicle or vehicle combination this is laden to 50 percent of its payload capacity.
ESA’s per trip are calculated on the basis of: one way laden to gross combination
mass and one way unladen (nil payload). This is typical of a lot of operations.
g) Number of trips per 1,000 tonnes
This is the number of trips taken for the listed combination to move 1,000 tonnes of
payload based on the payload estimate for the combination listed earlier in the chart.
h) Nominal fuel / 100 kilometres (l/100 km) and fuel required per 1,000 km.
Fuel used is a predication based on feedback from the operator survey for a range of
equipment within each category.
i) CO2 emissions / 1,000 tonnes
Reference is based on total fuel consumption for moving a 1,000 tonnes payload,
shown in percentage terms.
j) Driver requirement
This provides a guide to the number of drivers for the freight task and therefore the
number of trucks required.
3 www.nhvr.gov.au ….
Truck impact chart – 2.2 edition, March 2018 Page 7 of 26k) Overall length
The maximum legal allowable overall length of the combination - bumper to bumper.
This does not included permitted vehicles PBS units.
l) Road space required, new parameter
This indicates the space the combination takes up on the road moving 1,000 tonnes
of payload at both 60 km/h and 100 km/h with the recommended gap between
vehicles of 3 seconds, with the gap equivalent to 50 metres and 83.4 metres
respectively for the speeds noted. Additionally it should be noted this is applicable for
dry weather and the gap between vehicles should double in wet weather and for
other hazardous conditions.
M) Limitations with the data
An operator survey was used to collect key information about the truck fleet,
including fuel consumption and tare mass. There is confidence in this data, however
it is averaged and does not take into account different truck applications or
operational parameters.
For example, 26 m B-Double is principally a line haul unit operating between
distribution centres with little impact on urban delivery.
The truck’s application drives the need for different body types - from bulk
commodities to construction material to fuel to refrigerated or dry goods. The
commodity type impacts on the combination’s tare and fuel consumption.
Currently these issues are beyond the scope of this TAP.
Truck impact chart – 2.2 edition, March 2018 Page 8 of 26The Truck Impact Chart Table 3: Truck impact chart Truck impact chart – 2.2 edition, March 2018 Page 9 of 26
3) Illustrated example using the Truck Impact Chart
185%
192%
203%
50%
74%
Comparing three key models:-
semi-trailer, A123
B-double, B1233 and
A-double A123R23.
A-double
The relative merits of the High Productivity
79.5
36.5
48.7
72%
50%
225
21
Freight Vehicles becomes clearer with the:
B-double having about 74% of impact on
road, uses 82% of fuel for 62% of the
number trips to move the same amount of
payload (1,000 tonnes) compared to a
semi-trailer.
147%
137%
162%
62%
74%
Comparison of key road freight delivery configurations
A-double having about 74% of impact on
road, uses 72% of fuel for half the number
trips to move the same amount of payload
(1,000 tonnes) compared to a semi-trailer.
B-double
63.0
26.0
38.8
82%
62%
224
26
Semi Trailer
100%
100%
43.0
19.0
24.0
304
42
ESA's per 1,000 tonnes of payload moved
Trips per 1,000 tonnes of payload moved
Maximum Combination Length (metres)
Fuel required per 1,000 km lead
Driver requirement
GCM (tonne) GML
Payload (tonne)
Table 4: Truck impact chart - summary
Truck impact chart – 2.2 edition, March 2018 Page 10 of 26Part 2: Additional supportive information
4) Other important areas advantaged with HPFVs.
a) Engine exhaust emissions
Heavy vehicle exhaust emissions are until the 1 November 2016 a generation
ahead of light vehicle (car) requirements.
Light Standard ADR79/00 ADR79/01 ADR79/02 ADR79/04
vehicle Mandatory in 1/Jan/04* 1/Jan/06 1/Jul/10 1/Nov/16
– petrol Aust.
Equivalent
European Euro 2 Euro 3 Euro 4 Euro 5
requirement
Heavy Standard ADR70/00 ADR80/00 ADR80/02 ADR80/03
vehicle Mandatory in 1/Jan/96 1/Jan/03 29/Feb/08 1/Jan/11
– diesel Aust.
Equivalent
European Euro l Euro III Euro IV Euro V
requirement
Equivalent US
EPA ‘91 EPA ‘98 EPA ‘04 EPA ‘07
requirement (Model Year ’00)
Table 5: Comparison of exhaust emission for cars / light vehicles (GVM ≤ 3,500 kg) and trucks /
heavy vehicles (GVM > 3,500 kg)
Notes
⃰ This is the applicability date for the petrol standard (ADR79/00) with
diesel being mandated a year earlier.
• ADR80/01 became mandatory 1 Jan 2008 and was replaced by
ADR80/02 on the 29 February 2008 with both ADRs requiring the same
emission standard.
• ADR79/04 mandates the Euro 5 standard from 1 Nov 2016 for all cars /
light vehicles (GVM ≤ 3,500 kg) with ADR79/03 mandated Euro 5 for
new model and model families only from 1 Nov 2010.
• New emission standards introduced with a new Australian Design Rule
apply initially only to any new model or model families being introduced
into the market and current selling models or model families are
typically allowed another year to comply to the new standard.
One pre ADR70/00 truck produces the same amount of noxious emissions
(particulate material, PM and nitrous oxides, NOx) as seventy ADR80/03 Euro 5
trucks produce today (see Chart 1)
Therefore introduction of HPFVs, which are new vehicles in virtually all cases, will
introduce vehicles with significantly lower emissions.
Truck impact chart – 2.2 edition, March 2018 Page 11 of 26Chart 1: Comparison of UN ECE Emission standards
Chart 1 above only compares two of the four typical diesel noxious emissions
components detailed in compliance standards. These two illustrate the key issue of
emissions control of the internal combustion engine. By lowering one, the other is
inherently increased.
Particulate Material (PM) is the incomplete
combustion of the fuel, in a similar way that
carbon monoxide is also the incomplete
combustion of the fuel. Increased combustion
temperature will lower PM levels.
Nitrous Oxide (NOx) Air is composed of
approximately 79% nitrogen, 21% oxygen and
1% other gases. NOx results from high
combustion temperature. The higher the
temperature and more NOx produced within
the combustion chamber. Lowering the
combustion temperature will lower NOx.
Chart 2: Trade-off between NOx and PM
In order to meet ADR80/02 or later exhaust emission standards, some form of
exhaust gas after treatment system was required as part of the emission solution.
There are basically two methodologies to approach to achieve compliance to
ADR80/03 exhaust emission standards. For most suppliers, compliance to ADR80/04
will require all available technologies to be applied to achieve a solution that will
satisfy the authority with limited impact on the vehicle’s operation.
Truck impact chart – 2.2 edition, March 2018 Page 12 of 26b) Fuel quality
Sulphur is found in all crude oil to varying degrees and is difficult to remove in the
refining process. Sulphur is typically the key cause of sulphur dioxide in the exhaust
pipe emissions, which leads to acid rain. It also encourages development of black
smoke development and can “poison” the catalyst pollution treatment blocks in the
exhaust system.
Table 5 is a comparison of the sulphur content of fuels.
Regular unleaded petrol contains 15 times the amount of sulphur as diesel.
Fuel type Sulphur content, Effective from
maximum allowed
(ppm)
Diesel 10 1 Jan 2009
Petrol, Premium
50 1 Jan 2008
Unleaded (PULP)
Petrol, Regular
150 1 Jan 2005
Unleaded (ULP)
Table 6: Comparison of sulphur content in fuels
Note: ppm = part per million or 0.000,1% by volume.
c) Truck versus car fuel consumption/efficiency comparison
Australia’s bestselling car for 2015, the 2015 Toyota Corolla achieved an ADR
certified fuel consumption for a combined cycle of 6.1, an urban cycle of 8.0 and
extra cycle of 5.0 l/100km4.
A typical B-double on the road between Melbourne and Sydney, for economic
reasons achieves fuel consumption better than 1.7 km/l.
Productivity B-Double A-Double Toyota Corolla
GCM 63.0 tonne 79.5 tonne 4 x 100 kg
Payload 39 tonne 49 tonne (4 passengers & gear)
Fuel Consumption
1.61 1.49 16.4 (or 6.1 l/100 km)
(km/litres)
6.56 or a tenth of the
Metric - payload x fuel
62.8 73.0 efficiency of a B-
(tonne x km / litres)
double!
Table 7: Comparison of efficiencies
Cars play an important part of the transport map, but as illustrated in Table 5 above
they are not the most efficient means of transport no matter how convenient even
when it is assumed they are fully loaded.
4 http://www.greenvehicleguide.gov.au/GVGPublicUI/home.aspx
Truck impact chart – 2.2 edition, March 2018 Page 13 of 26As a general rule a truck’s fuel consumption increases at a rate slower than the
equivalent increase in a truck combination’s payload. However, as payload increases
the combination’s ability to accelerate is reduced (ie keeping up with traffic), hill
climbing ability is reduced and manoeuvrability around the roads is reduced which
reduces the physical road network options available for the combination to access.
d) Driving license category and requirements
Licence categories and requirements are similar around Australia. A driver of a B-
double combination requires a Multi Combination (MC) license for which the driver
must have had at least one year of experience in either a Heavy Combination (HC)
or a Heavy Rigid (HR) vehicle for at least 1 year, plus a further two years holding a
car licence.
Driving licence You are eligible for
classes What you can drive? this
(> 4.5 t GVM)
LR - Rigid vehicles with a GVM of more than after holding a car
Light Rigid 4.5 tonnes, but not more than 8 tonnes licence for 1 year
MR - Rigid vehicles with 2 axles and a GVM of after holding a car
Medium Rigid more than 8 tonnes. licence for 1 year
HR - Rigid vehicle with 3 or more axles and a after holding a car
Heavy Rigid GVM of more than 8 tonnes. licence for 2 year
HC - Heavy combination vehicles, such as a after holding a car
Heavy Combination prime mover towing a semi-trailer, or rigid licence for 2 year with
vehicles towing a trailer with a GVM of at least 1 year of
more than 9 tonnes. holding either a
medium rigid or heavy
rigid vehicle license
MC - Multi combination vehicles such as road after holding a heavy
Multi Combination trains and B-doubles. combination or heavy
rigid licence for at
least 1 year
Table 8: Comparison of the requirements for driving license categories
Truck impact chart – 2.2 edition, March 2018 Page 14 of 26e) Specific additional requirements for a 26 m B-double
The 26 m B-double combination was introduced in 2006 and had the mandatory
requirement for the fitment of a front underrun protection device (FUPD ECE R93);
ECE R29 Cab design and there was a limit on trailing length. These features were
not a requirement for semi-trailer, truck/dog or road train combinations, until required
by the ADRs as listed below.
f) Safety developments and the Australian Design Rule
ADR 84/00 front underrun protection device (FUPD) were mandated as of 1 January
2012 for trucks with a GVM greater than 12 tonnes.
ADR35/04 heavy commercial truck braking mandated antilock brake systems (ABS)
as of 1 January 2015. (Prime movers used in B-doubles were required to have anti-
lock brakes since 1986)
g) Safety statistics
NTI 2015 Major Accident Investigation report5 and subsequent related presentations
provides the following relevant findings:-
• B-doubles are a safer alternative with 40% share of the freight (including
rigids) and only 24% of major losses.
• Over the past decade, there has been a 30% increase in the freight carried
and 35% decline in the heavy vehicle related fatalities.
• Single vehicle truck accidents attributed to 72% of the losses with the balance
of 28% involving collisions with third party vehicles.
• In collisions involving fatalities, the truck was not at fault on 84% of occasions.
5
www.nti.com.au/supporting/trucking/latest-report.php
Truck impact chart – 2.2 edition, March 2018 Page 15 of 26Additionally, the following table prepared by AustRoads lays out a compelling case
for HPFVs.
Total
Accident type by severity Total serious &
Minor Moderate Serious Major
Rate per 100 km accidents major
accidents
Articulated
21 22 16 13 72 29
Conventional (69%)
Trucks Rigid Truck
42 34 19 7 102 26
(31%)
Conventional incident
27.5 25.7 16.9 11.1 81.3 28
weight , total
Articulated
8 2 2 5 18 7
(69%)
HPFVs
Rigid Truck
20 26 4 2 53 6
(31%)
Observed HPFVs incident
11.7 9.4 2.6 4.1 27.9 6.7
weighted total
Total HPFVs incident
15.8 16.3 14.3 7.1 53.5 21.4
savings (rate per 100 km)
Observed HPFVs weight
57% 63% 85% 63% 66% 76%
incident savings (%)
Table 9: Quantifications of the benefits resulting from the use of HPFV.
Sourced Austroads report, FS18056
6
Austroads report, FS1805 – Quantifications of the benefits resulting from the use of HPFV.
http://www.austroads.com.au/news-events/item/170-quantifying-the-benefits-of-high-productivity-vehicles
Truck impact chart – 2.2 edition, March 2018 Page 16 of 26Part 3: Performance Based Standards (PBS) and non modular
configurations and their impact
PBS is an alternative heavy vehicle compliance scheme. It is intended to provide an
alternative compliance path for vehicles that did not meet the size and weight limits
for heavy vehicle and vehicle combinations that are prescribed in legislation.
PBS vehicles must meet sixteen safety standards and four infrastructure standards
(the PBS standards) to ensure they fit the existing road network and are safe. The
scheme has been in operation since October 2007.
Four of the PBS standards are outlined below:
Static rollover threshold
The steady-state level of lateral acceleration that a vehicle can sustain during
turning without rolling over.
Low speed swept path
The maximum width of the vehicle combination swept path in a prescribed 90°
low speed turn with an outside of tyre steer radius of 12.5 metres.
High speed transient tracking
The lateral distance that the last-axle on the rear trailer tracks outside the path
of the steer axle in a sudden evasive manoeuvre.
Rearward amplification
Measures the ‘whip crack’ effect of a lane change manoeuvre
Charts 3 to 6 compare the results for vehicles of mid-range performance
representing each of the generic vehicle classes. The charts therefore indicate, in
general, the relative performance for each configuration against the standards.
Truck impact chart – 2.2 edition, March 2018 Page 17 of 26a) Static rollover threshold
The steady-state level of lateral acceleration that a vehicle can sustain during turning
without rolling over.
Static Rollover Threshold
0.7
0.6
0.5
0.4
SRT
0.3
0.2
0.1
0.0
Chart 3: Comparison of Static Rollover Threshold (SRT) for mid-range vehicle combinations
Static Roll Threshold (SRT) is influenced by vehicle mass, the dimensions and
mechanical properties of the vehicle and the centre of gravity height of the load.
The PBS standards for SRT are:
• not less than 0.40g for road tankers hauling dangerous goods in bulk and
buses and coaches; and
• not less than 0.35g for all other vehicles.
The vehicles used to construct Chart 3 are generic and use similar components and
therefore give a representative outcome only. Not all vehicles using the size and
weight limits for heavy vehicle and vehicle combinations that are prescribed in
legislation meet the Performance Based Standards for SRT.
Truck impact chart – 2.2 edition, March 2018 Page 18 of 26Rather than showing absolute values, Charts 4, 5 and 6 show the results
for each configuration as a ratio compared to the result for the prime
mover/semi-trailer combination, the A123.
b) Low speed swept path
The maximum width of the vehicle’s swept path in a prescribed 90° low speed turn
with an outside of tyre steer radius of 12.5 metres.
Low speed swept path
2.0
ratio to LSSP of A123
1.5
1.0
0.5
0.0
Chart 4: Comparison of low speed swept path for mid-range vehicle combinations
It can be seen from chart 4 that low speed swept path generally increases with
vehicle length but not proportionally as low speed swept path is influenced by the
length of the individual units and the number of couplings.
Truck impact chart – 2.2 edition, March 2018 Page 19 of 26c) High speed transient offtracking
The lateral distance that the last-axle on the rear trailer tracks outside the path of the
steer axle in a sudden evasive manoeuvre.
High-Speed Transient Offtracking
3.0
ratio to HSTO of A123
2.5
2.0
1.5
1.0
0.5
0.0
Chart 5: Comparison of high speed transient offtracking for mid-range vehicle combinations
Chart 5 shows that the A-coupled multi-combination vehicles have greater transient
offtracking (i.e. less desirable) than similar length B-coupled vehicles
Truck impact chart – 2.2 edition, March 2018 Page 20 of 26d) Rearward amplification
Measures the ‘whip crack’ effect of a lane change manoeuvre, i.e. the tendency for
the rear trailer to have a much larger lateral response (sideways motion), thus
experiencing higher levels of lateral acceleration than the towing unit.
Rearward Amplification
2.5
ratio to RA of A123
2.0
1.5
1.0
0.5
0.0
Chart 6: Comparison of rearward amplification for mid-range vehicle combinations
Chart 6 shows that the A-coupled multi-combination vehicles have significantly
greater undesirable rearward amplification than B-coupled vehicles.
e) Road Network Classification for PBS vehicles
The PBS road network has been classified into four levels:
• Level 1: Similar to General access
• Level 2: Similar to B-double routes
• Level 3: Similar to Double (Type I) road train routes
• Level 4: Similar to Triple (Type II) road train routes
Seven of the PBS safety standards have different performance levels for the different
levels of access, including Low Speed Swept Path and High Speed Transient
Offtracking.
Truck impact chart – 2.2 edition, March 2018 Page 21 of 26Truck Impact Chart for PBS and non-modular configuration Table 10: Truck impact chart – non modular combinations Truck impact chart – 2.2 edition, March 2018 Page 22 of 26
TAP development process, history and validation

The TAP development process

The ITC will approve the need for the creation of a new TAP or the triennial routine
review of an existing TAP. The nominated editor(s), who are listed below, with
support of the ITC and specialist industry technical members as required, will agree
on the TAP content with approval by a majority vote of ITC members. A suitably
qualified and experience ATA appointed peer reviewer will further review the
publication and if necessary, recommended changes. These changes will then be
reviewed and approved again by a majority vote of ITC members before the
document is released.

Document version control

 Edition Date                  Nature of change / comment                  Editor(s)
 First         June 2010       Initial release                             David Coonan, ATA,
                                                                           National Manager – Policy
                                                                           Bob Woodward – Barkwood
                                                                           Consulting
 Second        Aug 2016        Extensively updated with detailed           Chris Loose, ATA,
                               explanations added.                         Senior Adviser Engineering
 2.1           Sept 2016       Minor update to the modular table for the   Chris Loose, ATA,
                               19 m B-double combinations.                 Senior Adviser Engineering
 2.2           Mar 2018        Update Non-modular combinations;            Bob Woodward, ATA, Chief
                               common configuration reference.             Engineer.
The next is expected on or before August 2021.

Drafting committee

 Edition      Date             Drafting                    Organisation / Qualifications
 Second       July 2016        Bob Woodward                Barkwood Consulting
 2.1          Sept 2016        Bob Woodward                Barkwood Consulting
 2.2          March 2018       Bob Woodward                ATA Chief Engineer

Peer review
 Edition      Date             Peer Reviewer               Organisation / Qualifications
 First        June 2010        Bob Pearson                 Pearsons Transport Resource Centre, BEng
 Second       July 2016        Bob Pearson                 Pearsons Transport Resource Centre, BEng
 2.1          Sept 2016        Bob Pearson                 Pearsons Transport Resource Centre, BEng
 2.2          March 2018       Bob Pearson                 Pearsons Transport Resource Centre, BEng

Truck impact chart – 2.2 edition, March 2018                                                 Page 23 of 26
About the ATA Industry Technical Council: The Industry Technical Council (ITC) is a standing committee of the Australian Trucking Association (ATA). The ITC’s mission is to improve trucking equipment, its maintenance and maintenance management. The ITC was established in 1995. As a group, the ITC provides the ATA with robust professional advice on technical matters to help underpin ATA policymaking. It is concerned with raising technical and maintenance standards, improving the operational safety of the heavy vehicle sector, and the development of guidelines and standards for technical matters. ITC performs a unique service in the Australian trucking industry by bringing operators, suppliers, engineers and other specialists together in a long-term discussion forum. Its members provide expert and independent advice in the field to inform the work of the ITC. The outcomes from ITC benefit all ITC stakeholders and the industry at large. The ITC operates under the Australian Trucking Association’s Council, which formulates industry policy for the implement by the organisation. Joining ITC: We welcome applications to join the ITC. For further information, please call the ATA (02) 6253 6900 email ata@truck.net.au or download information from the ATA website www.truck.net.au by follow the links under the members tab to join here. Truck impact chart – 2.2 edition, March 2018 Page 24 of 26
Appendix 1: Modular combinations

     Appendix 1 – TIC modular combinations
Appendix 2: Non modular combinations
Appendix 2 TIC non modular/PBS combinations
Truck impact chart – 2.2 edition, March 2018 Page 26 of 26You can also read