US Traffic Hotspots Traffic Hotspots - Inrix
←
→
Page content transcription
If your browser does not render page correctly, please read the page content below
INRIX: US TRAFFIC HOTSPOTS

                            The      UnitedHotspots
                            US Traffic                States’
                            Measuring the impact of congestion in the United States
                            Traffic Hotspots
                            INRIX Research

                                                                          1
                            Bob Pishue
                            Measuring the impact of congestion in the United States
                            September 2017

                             INRIX Research
                             Graham Cookson & Bob Pishue
                             July 2017

INRIX RESEARCH | INTELLIGENCE THAT MOVES THE WORLD
ABOUT INRIX RESEARCH
Launched in 2016, INRIX Research uses proprietary INRIX
big data and expertise to make the movement of people and
goods more efficient, safer and convenient.
We achieve this by leveraging 500 Terabytes of INRIX
data from 300 million different sources covering over five
million miles of road, and combining it with our other data
sources including global parking, origin and destination
trip data, fuel, point of interest, public transport, and road
weather information. Together, our data provide a rich and
fertile picture of urban mobility that enable us to produce
valuable and actionable insights for policy makers, transport
professionals, automakers and drivers.
The INRIX Research team has researchers in Europe
and North America and is comprised of economists,
transportation policy specialists and data scientists with a
mix of research backgrounds from academia, think tanks
and commercial research and development groups. We have
decades of experience in applying rigorous, cutting-edge
methodologies to answer salient, real-world problems.
INRIX Research develops original, relevant and global
research content to inform decision makers, transportation
officials and the traveling public. In addition to our research
outputs, INRIX Research is a valuable and free resource for
journalists, researchers and policymakers. We assist with
data, analysis and expert commentary on all aspects of
urban mobility and smart cities. Spokespeople are available
globally for interviews.

                                      INRIX RESEARCH | INTELLIGENCE THAT MOVES THE WORLD
INRIX: US TRAFFIC HOTSPOTS

                                CONTENTS

TABLES                          1 EXECUTIVE SUMMARY                               2
1 INRIX 2016 Global
  Traffic Scorecard
2 INRIX Roadway
  Analytics Top 25 Traffic
                            3   1.1 INTRODUCTION
                                1.2 KEY FINDINGS
                                                                                   2
                                                                                   5      1
  Hotspots                 14
                                2 METHODOLOGY                                     6
3 INRIX Roadway
  Analytics Top Hotspots        2.1 INRIX ROADWAY ANALYTICS: TRAFFIC HOTSPOTS      6
  by City                  16
                                2.1.1 TRAFFIC HOTSPOT EXAMPLE: WORST IN AMERICA    8
4 INRIX Roadway
  Analytics Impact Factor       2.2 ECONOMIC COST OF CONGESTION                   11
  Ranking – U.S. Cities   19
5 I-80 Smart Corridor
  Before and After         21   3 U.S. TRAFFIC HOTSPOTS                           13
                                3.1 TOP 25 TRAFFIC HOTSPOTS                       13
                                3.2 TOP TRAFFIC HOTSPOT IN EACH CITY              15
FIGURES                         3.3 CITY TOTALS                                   17
1 Bottleneck Results
  Summary Table             8
                                4 INRIX CASE STUDIES                              19
2 Mapping Hotspots          8
3 Traffic Jams by Time
                                4.1 SAN FRANCISCO BAY AREA                        19
  of Day, Duration and          4.2 SEATTLE REGION                                22
  Frequency                10
4 The Bay Area’s Worst
  Hotspot                  19   5 CONCLUSION                                      23
5 Northbound I-405
  Weekday Travel Time
  Index                    22

INRIX RESEARCH | INTELLIGENCE THAT MOVES THE WORLD
INRIX: US TRAFFIC HOTSPOTS

       1 EXECUTIVE SUMMARY

       1.1                                                               For this study, INRIX Research used the

2
                                                                         25 most congested U.S. cities from the
       INTRODUCTION                                                      INRIX 2016 Global Traffic Scorecard.1 Table
                                                                         1 displays each city and their 2016 cost
       INRIX Roadway Analytics                                           of congestion to drivers and households
                                                                         within them.2 To understand the impact of
       identified the worst traffic                                      congestion at the street level instead of the
       hotspots in America’s                                             household level, INRIX Research leveraged
                                                                         the “bottleneck tool” in the INRIX Roadway
       25 most-congested cities to                                       Analytics platform.
       learn more about the health
                                                                         INRIX Roadway Analytics captures the duration
       of the road and transportation                                    and maximum length of every traffic jam.
       network. As public officials                                      Traffic jams that occur at the same locations
                                                                         along a stretch of road are called “traffic
       consider increasing                                               hotspots.” INRIX Research then estimated
       transportation spending,                                          the lost time, wasted fuel and carbon
                                                                         emitted at each traffic hotspot based on
       strategically targeting                                           inflation-adjusted United States Department
       investments will be crucial to                                    of Transportation (USDOT) values of time.
                                                                         Besides offering a digestible way to examine
       unlocking maximum benefits.                                       the severity of specific traffic hotspot, the cost
                                                                         of congestion also provides an economic value
       INRIX Roadway Analytics is the first cloud-                       to gauge future investment.
       based, on-demand traffic analytics platform
       available in 47 countries across North                            At of the time of this writing, the Trump
       America, Europe and the Middle East.                              administration has signaled interest in
       It provides state and local transportation                        spending one trillion dollars on infrastructure,
       agencies with easy access to powerful                             a large portion of which would be geared
       road analysis and insights stemming from                          toward surface transportation improvements.
       highly-granular INRIX XDTM segments.                              Though funding and financing questions
       INRIX Roadway Analytics allows transportation                     remain, it will be important that any
       planners and analysts to leverage big data                        infrastructure package prioritize projects to
       to monitor changes in traffic patterns, target                    generate the most benefit at the least cost.
       transportation improvements to maximize
       benefits and produce visualizations to convey
       important information to decision makers.

      1. Since 18th ranked Tacoma, WA and 26th ranked Concord, CA fall within a Metropolitan Statistical Area
      covered in this study, 27th ranked Columbia, MD was included.
      2. The cost per city in the INRIX 2016 Global Traffic Scorecard may not reflect similarly to the results of
      this study, as the costs in Scorecard are based on household data provided by the National Household
      Travel Survey. In addition, this study focuses on the Metropolitan Statistical Area as defined by the Census
      Bureau, not the INRIX Urban Area used in the Scorecard.

                                                                               INRIX RESEARCH | INTELLIGENCE THAT MOVES THE WORLD
INRIX: US TRAFFIC HOTSPOTS

        Table 1: INRIX 2016 Global Traffic Scorecard
                                                                                                             3
                                                     INRIX 2016 GLOBAL TRAFFIC SCORECARD

         RANK     CITY                  PEAK HOURS      TOTAL COST OF    RANK    CITY                PEAK HOURS    TOTAL COST
                                        SPENT IN        CONGESTION                                   SPENT IN      OF
                                        CONGESTION                                                   CONGESTION    CONGESTION
         1        Los Angeles, CA       104             $9.7b            14      San Diego, CA       46            $1.4b

         2        New York, NY          89              $16.9b           15      Minneapolis, MN     40            $1.2b

         3        San Francisco, CA     83              $2.5b            16      Stamford, CT        39            $67m

         4        Atlanta, GA           71              $3.1b            17      Philadelphia, PA    38            $2.5b

         5        Miami, FL             65              $3.6b            19      Phoenix, AZ         37            $1.5b

         6        Washington, D.C.      61              $3.0b            20      Baton Rouge, LA     36            $271m

         7        Dallas, TX            59              $2.9b            21      Denver, CO          36            $1.2b

         8        Boston, MA            58              $2.9b            22      Santa Barbara, CA   36            $101m

         9        Chicago, IL           57              $5.2b            23      Nashville, TN       34            $517m

         10       Seattle, WA           55              $2.0b            24      Detroit, MI         33            $1.5b

         11       Houston, TX           52              $2.5b            25      Pittsburgh, PA      33            $944m

         12       Portland, OR          47              $1.0b            27      Columbia, MD        32            $42m

         13       Austin, TX            47              $810m                    U.S. Total                        $295b

INRIX RESEARCH | INTELLIGENCE THAT MOVES THE WORLD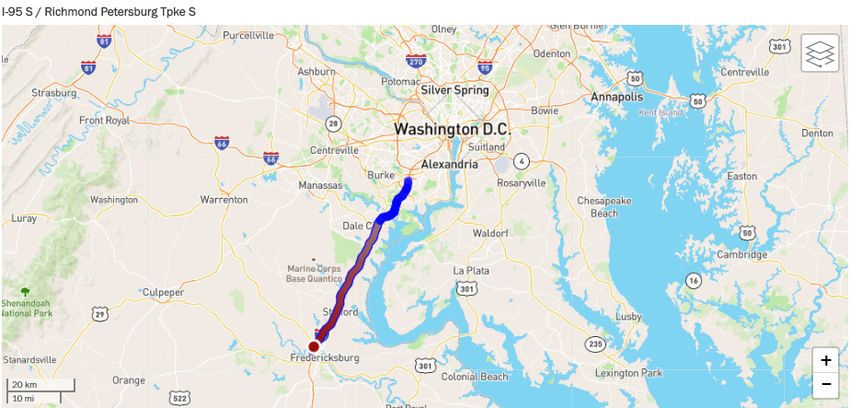
INRIX: US TRAFFIC HOTSPOTS

4

                                 INRIX RESEARCH | INTELLIGENCE THAT MOVES THE WORLD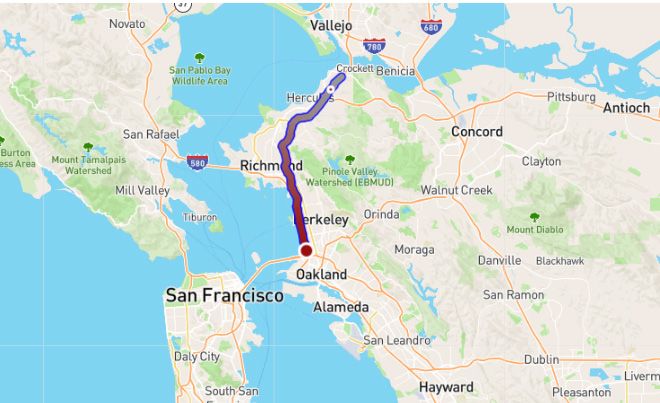
INRIX: US TRAFFIC HOTSPOTS

      1.2                                               New York ranked second, with an Impact

                                                                                                            5
                                                        Factor of 8.2 million, 30 percent lower
      KEY FINDINGS                                      than L.A., resulting in an estimated cost of
                                                        $64 billion over the next decade. The Impact
      Drivers in Los Angeles faced                      Factor and cost of hotspots in Los Angeles
                                                        and New York combined surpassed the next
      the greatest impact from                          five cities added together: Washington D.C.
      traffic hotspots, followed                        (IF: 3.8m; $29bn), Atlanta (IF: 3.7m; $29bn),
                                                        Dallas (IF: 3.6m; $28bn), Chicago (IF: 3.6m;
      by New York, Washington                           $28bn) and San Francisco (IF: 3.5m; $27bn).
      D.C., Atlanta and Dallas.
                                                        The nation’s worst single traffic hotspot
      Per capita, Angelenos were                        identified was located on Interstate 95
      most affected by traffic jams                     Southbound at Exit 133A in the Washington
                                                        D.C. region near Fredericksburg, VA.
      but Stamford, San Francisco                       This traffic hotspot is comprised of 1,394
      and San Diego had the most                        traffic jams over the two-month study period,
                                                        with an average duration of 33 minutes
      severe traffic jams, although                     stretching an average maximum length of
      fewer of them. Across all 25                      6.47 miles – leading to an Impact Factor of
                                                        297,633 (1,394 x 33 x 6.47). Based on
      cities, traffic hotspots are                      Impact Factor, this hotspot is estimated to
      estimated to cost drivers                         cost drivers $2.3 billion through 2026.

      $480 billion over the next ten                    Stamford, CT had the second-highest Impact
      years in lost time, wasted fuel                   Factor per capita and the highest Impact
                                                        Factor per traffic jam, suggesting that the
      and carbon emitted.                               area has a disproportionately-high level of
                                                        congestion at traffic hotspots for its size,
      The U.S. Traffic Hotspot Study provides insight   something not reflected in its 22nd overall
      into the 25 cities most affected by traffic       ranking. The opposite was found in New York
      congestion as identified by the INRIX 2016        City - though ranked second, had the 17th-
      Global Traffic Scorecard. New York had more       highest Impact Factor per capita.
      traffic hotspots than any other city analyzed
      (13,608), yet drivers in Los Angeles faced        In another example, San Francisco (ranked
      the highest economic burden of hotspots.          seventh) had nearly double the Impact Factor
      More than 128,000 traffic jams occurred in        per traffic jam than Atlanta (ranked fourth),
      L.A. between March and April 2017, resulting      despite an Impact Factor just six percent lower
      in an Impact Factor of 11.7 million. Based on     than Atlanta. This suggests that traffic jams,
      Impact Factor, the economic cost of Los           when they occur, are more severe in the Bay
      Angeles’ hotspots are estimated at more           Area than Atlanta.
      than $90 billion over the next ten years if
      congestion levels remain constant.

INRIX RESEARCH | INTELLIGENCE THAT MOVES THE WORLD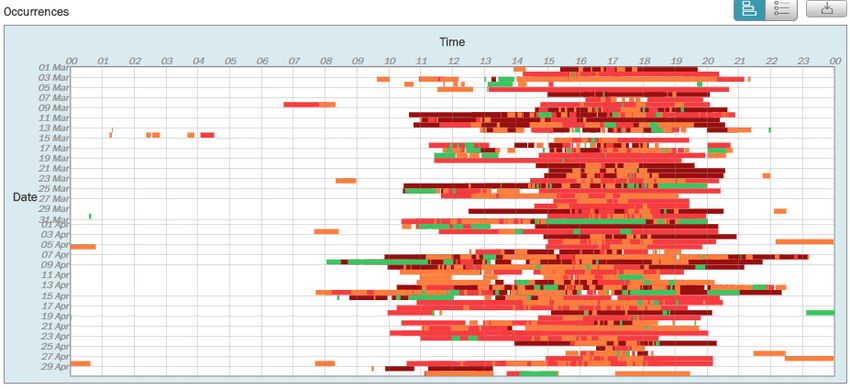
INRIX: US TRAFFIC HOTSPOTS

       2 METHODOLOGY

       2.1 INRIX ROADWAY                                 In other words, a “traffic jam” is an

6      ANALYTICS: TRAFFIC
       HOTSPOTS
                                                         occurrence of congestion at a specific location
                                                         on the road network. It may be caused by a
                                                         physical bottleneck (e.g. where three lanes
                                                         of traffic are reduced to two), an accident,
       INRIX operates the most                           construction, or by the volume of traffic
                                                         relative to the available road space – common
       robust driver network in                          on urban freeways during the peak periods.
       the world, gathering data                         The INRIX Roadway Analytics bottleneck tool
                                                         is agnostic to the cause of the congestion,
       from more than 300 million                        and is meant to be used as a planning
       connected cars and devices,                       and evaluation tool that allows users to
                                                         prioritize investment spending, benchmark
       equating to nearly two                            transportation facilities and maximize benefits
       billion data points per day.                      for road users and public agencies. As traffic
                                                         jams often form frequently at the same
       Its automotive-grade traffic                      location, the bottleneck tool aggregates and
       services are available on                         summarizes these locations. In this report, the
                                                         locations of these repeated traffic jams are
       over five million miles of                        called traffic hotspots.
       road worldwide.
                                                         The impact of the congestion caused by
       INRIX combines anonymous, real-time               hotspots is calculated by multiplying the
       GPS probe data and hundreds of market-            average duration in minutes, average
       specific criteria that affect traffic – such as   maximum length in miles, and the number of
       construction and road closures, real-time         traffic jams to generate the “Impact Factor”
       disruptions, sporting and entertainment           score (duration x length x number of traffic
       events, weather forecasts and school              jams). This score allows traffic hotspots to be
       schedules – to provide the most accurate          ranked in terms of severity.
       picture of current and historical
       travel conditions.

       This real-time traffic data is at the heart of
       the INRIX Roadway Analytics platform. A key
       feature of the platform is the bottleneck tool
       that identifies and evaluates every traffic jam
       within a customizable study area and time-
       period. The detection of a traffic jam is based
       on comparisons of travel speeds to reference
       speeds, which are the proxy of the free flow
       or uncongested speed. A potential traffic jam
       is detected when speeds on a segment drop
       to 65 percent of the reference speed, and is
       confirmed if speeds stay below 65 percent
       for more than two minutes. The congestion
       occurrence will only be cleared once speeds
       rise above 75 percent of the reference speed.

                                                              INRIX RESEARCH | INTELLIGENCE THAT MOVES THE WORLD
INRIX: US TRAFFIC HOTSPOTS
For this study, INRIX Research analyzed two
WHAT IS A ROAD’S FRC?
7
months of traffic data between March and
April 2017 using the Roadway Analytics
FRC stands for Functional Road bottleneck tool. While the period chosen
Classification and is how roads are should accurately reflect traffic conditions on
classified into a hierarchy in the INRIX corridors with a large degree of confidence,
Roadway Analytics platform. By dividing local traffic conditions may generate
roads into classes, transportation some bias.
engineers and government agencies can
benchmark and monitor by the specific For example, on March 30, 2017, a portion
purpose of a set of road segments. of Interstate 85 in Atlanta collapsed due to a
fire under the bridge. The new span opened
FRC1 = Limited-access highways, to northbound and southbound traffic on May
like those encompassing the 15, 2017. Events like the I-85 collapse may
original Interstate Highway System. generate traffic hotspots that would normally
Prime examples include Interstate 95, score lower or not be present, while at the
Interstate 90 and Interstate 5. same time de-emphasizing traffic hotspots
occurring on I-85 in that specific area. Hence,
FRC2 =Roads in this classification are local conditions – including highway and
considered freeways or expressways, with bridge construction, repairs, traffic incidents,
somewhat-limited access and similar road closures and other disruptions – need to
functions to FRC1. Prominent examples be taken into consideration when analyzing
include the Southern State Parkway / Belt the impact of traffic hotspots in this report.
Parkway in New York City and the Glenn
Anderson Freeway (I-105) in Los Angeles.
FRC3 = These roads typically serve
high traffic volumes and intra area travel
between downtowns and residential
areas. Compared to FRC1 and FRC2,
multiple FRC3s typically surround an
urban center, carrying people and goods
through the region. Examples of FRC3 in
urban areas include Broadway and 2nd
Avenue in Manhattan.
FRC4 and FRC5 = Roads under the
FRC4 classification typically connect to
higher-level arterial streets. Folsom Street
in San Francisco and New Hampshire Ave
NW in Washington D.C. are examples of
FRC4 streets.
INRIX RESEARCH | INTELLIGENCE THAT MOVES THE WORLDINRIX: US TRAFFIC HOTSPOTS
2.1.1 TRAFFIC HOTSPOT
8 EXAMPLE: WORST IN
AMERICA
Figure 1, the “Summary Table,” provides a
list of the 6,097 aggregated traffic hotspots
across the Washington D.C. region and each
traffic hotspot’s characteristics, while Figure 2
provides a visualization of the traffic hotspot
being studied. Though this study largely
focused on the aggregated traffic hotspots
instead of individual instances of traffic jams,
INRIX Roadway Analytics also provides greater
insights into traffic.
Figure 1: Bottleneck Results Summary Table
Figure 2: Mapping Hotspots
INRIX RESEARCH | INTELLIGENCE THAT MOVES THE WORLDINRIX: US TRAFFIC HOTSPOTS
9
INRIX RESEARCH | INTELLIGENCE THAT MOVES THE WORLDINRIX: US TRAFFIC HOTSPOTS
Interstate 95 Southbound at Exit 133A near Figure 3 reveals why these improvements are
10
our nation’s capital was America’s worst needed. Every traffic jam on I-95 Southbound
traffic hotspot. This hotspot was comprised during the study period is shown by time of
of 1,394 traffic jams over two months, with day, duration and frequency.
an average duration of 33 minutes stretching
an average maximum length of 6.47 miles
– leading to an Impact Factor of 297,633
(1,394 x 33 x 6.47). Based on Impact Factor,
this traffic hotspot is estimated to cost drivers
$2.3 billion over the next 10 years in in lost
time, wasted fuel and carbon emitted.
But Virginia Department of Transportation
(VDOT) officials aren’t just standing by.
Their partnership with Transurban will add
2.2 miles of reversible lanes to extend the
I-95 Express Lanes to the south to alleviate
heavy congestion caused by weaving. Officials
have also planned and funded other projects
in the vicinity, like the I-95 Rappahannock
River Crossing, a two-lane collector distributor
road between the Route 17 and Route 3
interchanges to reduce congestion in the
southbound direction.
Figure 3: Traffic Jams by Time of Day, Duration and Frequency
INRIX RESEARCH | INTELLIGENCE THAT MOVES THE WORLDINRIX: US TRAFFIC HOTSPOTS
2.2 ECONOMIC COST OF In addition to the assumptions, a value of time
11
must be established. A value of time allows
CONGESTION transportation agencies and public officials
to accurately gauge whether a project’s costs
Traffic hotspots on the outweigh the travel time benefits. For the
purposes of this study, INRIX Research based
roadway lead to economic value of time estimates from USDOT figures:
losses in time, fuel and $12.81 per hour commuting, $25.19 per
hour for business travel and $9.51 per hour
carbon to drivers, bus for all other travel purposes. Approximately 17
riders and freight movers. percent of person trips in the country are
reported to be for commuting, while three
Using the Impact Factor percent is business-related. The reminder of
score, the economic cost trips – errands, school, social and recreational
– are classified as other.3
of congestion at hotspots
can be estimated, providing Trip-specific vehicle occupancy values from the
Federal Highway Administration, when applied
a measure transportation to the USDOT value of time, along with a
professionals and public congestion factor, provided an average hourly
value of time of $33.11. When wasted fuel
officials to consider and the value of carbon emitted were factored
when evaluating strategic in, an hour in congested travel was estimated
to cost $34.50, or $0.57 per minute.
infrastructure investments.
Since hotspots varied in terms of FRC and
Due to both the range of FRC roads and number of available general purpose, auxiliary
the number of roads contained in the study, and merging lanes stretching a roadway,
simplifying the economic cost calculation INRIX Research based estimates using a
requires consideration and assumption of conservative two-lane road assumption.
three variables: INRIX Research estimated the density of
vehicles at 150 vehicles per lane-mile.
1. Average number of lanes of traffic in traffic While level of service F conditions state that
hotspots unstable congestion happens at densities
greater than 67, vehicle density can be
2. Average number of vehicles per mile of much greater.
traffic hotspot
Multiplying these factors together provided
3. Average vehicle occupancy a conversion factor of 172.50, which was
applied to the Impact Factor produced in INRIX
Roadway Analytics to generate the economic
cost of traffic hotspots.
3. “2009 National Household Travel Survey,” Federal
Highway Administration, Table 9, at http://nhts.ornl.
gov/2009/pub/stt.pdf.”
INRIX RESEARCH | INTELLIGENCE THAT MOVES THE WORLDINRIX: US TRAFFIC HOTSPOTS
For the purposes of this study, INRIX Research
12
assumed the two-month period, multiplied by
six, to be the annual total for estimating the
cost of congestion. The present value of the
cost of congestion over the next decade was
estimated using the social discount rate of
seven percent, as recommended by the Office
of Management and Budget. A ten-year period
was chosen as it can take as many years from
project inception to completion, especially
on complex highway projects through urban
areas. A hotspot’s cost should be measured
alongside potential project benefits to
determine if investment is warranted.
INRIX RESEARCH | INTELLIGENCE THAT MOVES THE WORLDINRIX: US TRAFFIC HOTSPOTS
3 U.S. TRAFFIC HOTSPOTS
3.1 TOP 25 TRAFFIC Table 2 presents the top 25 traffic hotspots
13
out of the cities studied. With five of the top
HOTSPOTS 10 hotspots, and 10 out of the top 25, drivers
in Los Angeles were most affected by traffic
The 25 top-ranked U.S. hotspots. However, the single most severe
traffic hotspot was on I-95 Southbound in
cities in the INRIX 2016 Washington D.C. Traffic jams on I-95 stretched
Global Traffic Scorecard were an averaged 6.47 miles with an average
duration of 33 minutes, leading to $2.3 billion
analyzed further to pinpoint in lost time, wasted fuel and carbon emitted
the locations of traffic over the next decade.
hotspots. INRIX Roadway The top 25 traffic hotspots represented
Analytics identified more a significant share of the total Impact
Factor. Only 0.04 percent of hotspots were
than 800,000 traffic jams represented in the top 25, yet they made up
at nearly 108,000 traffic over five percent of the total Impact Factor.
This was especially evident in Washington
hotspots between March D.C. and L.A. The three Washington D.C.
and April 2017. The top 25 hotspots in the top 25 were responsible for
15 percent of the city’s total Impact Factor.
hotspots are estimated to In L.A., more than 11 percent of the city
cost drivers over $25 billion Impact Factor was concentrated in the top 25.
over the next decade. Just nine cities had a hotspot in the top 25.
Twenty-four out of the top 25 traffic hotspots
are limited access highways (FRC1). The only
expressway (FRC2) in the top 25 was the Belt
Parkway in New York.
INRIX RESEARCH | INTELLIGENCE THAT MOVES THE WORLDINRIX: US TRAFFIC HOTSPOTS
Table 2: INRIX Roadway Analytics Top 25 Traffic Hotspots
RANK CITY TRAFFIC HOTSPOT AVG. AVG. MAX TRAFFIC IMPACT 2026
DURATION LENGTH (MILES) JAMS FACTOR ECONOMIC
(MIN) COST
1 Washington, D.C. I-95 S at Exit 133A to Fairfax 33 6.47 1,394 297,633 $2.3bn
County Parkway
2 Los Angeles, CA I-405 N at Exit 43 to Exit 21 23 5.12 2,032 239,288 $1.9bn
3 Los Angeles, CA I-405 S at Exit 22 to Exit 45 24 4.98 1,403 167,687 $1.3bn
4 Los Angeles, CA US-101 S at Exit 3B to CA-134/ 355 4.22 108 161,795 $1.3bn
CA-170
5 Chicago, IL I-90 W at 81A to Exit 56B 79 8.55 238 160,757 $1.3bn
6 Los Angeles, CA I-405 N at Exit 53 to 38B 40 5.61 680 152,592 $1.2bn
7 Washington, D.C. I-95 N at Exit 143B to SR-608 33 4.51 936 139,305 $1.1bn
8 Los Angeles, CA US-101 S at Exit 13B to Exit 34 124 4.54 241 135,673 $1.1bn
9 Washington, D.C. I-495 Beltway at Route 201 to 39 5.08 684 135,514 $1.1bn
Exit 4A
10 San Diego, CA I-15 N at Exit I-215 to Gopher 177 13.71 54 131,040 $1.0bn
Canyon Road
11 New York, NY Brooklyn Queens Expy E at Exit 64 4.37 462 129,212 $1.0bn
28A to W Shore Expy
12 Houston, TX I-45 S Exit 46A to Exit 63 75 5 340 127,500 $992m
13 New York, NY I-95 N / Cross Bronx Expy at Exit 155 3.35 243 126,178 $981m
4A to Route 46
14 San Francisco, CA I-80 W at Emeryville to CA-4 53 4.35 504 116,197 $904m
15 Los Angeles, CA I-5 S at I-10 to CA-170 76 7.41 201 113,195 $880m
16 Atlanta, GA I-285 S at I-20 to Route 23 74 10.38 143 109,841 $854m
17 Atlanta, GA I-75 N at Exit 271 to I-75/I-85 62 8.99 187 104,230 $811m
18 New York, NY Belt Pkwy E at Crossbay Blvd to 115 7.16 122 100,455 $781m
I-278
19 Los Angeles, CA I-10 E at I-5/I-10 Exit 135C to 26 9.04 422 99,187 $771m
Exit 1A Santa Monica
20 Seattle, WA I-5 S at Pike St to 128th St/Exit 39 6.14 406 97,221 $756m
186
21 Los Angeles, CA I-5 N Exit 146A to Exit 126B 86 6.13 184 97,001 $754m
22 Chicago, IL I-90 E at Exit 50B to I-294 48 6.56 304 95,724 $744m
23 Los Angeles, CA I-10 W at I-110 to Exit 19C 112 3.79 218 92,537 $720m
24 Los Angeles, CA I-405 N at Exit 70 to I-105 22 12.03 349 92,366 $718m
25 New York, NY I-95 S / Cross Bronx Expy at 155 3.76 158 92,082 $716m
Alexander Hamilton Bridge to
Exit 6A
INRIX RESEARCH | INTELLIGENCE THAT MOVES THE WORLDINRIX: US TRAFFIC HOTSPOTS
3.2 TOP TRAFFIC HOTSPOT For example, the I-278 Eastbound traffic
15
hotspot at Brooklyn Bridge Park was the
IN EACH CITY number one rated traffic hotspot in New York
City, but the 11th-ranked traffic hotspot in the
Though just nine cities had country. This hotspot was estimated to cost
drivers on that stretch of road more than one
hotspots in the top 25, traffic billion dollars over the next ten years.
problems were present in
Some traffic hotspots have long durations
every city studied. Table 3 but happen two to three times per weekday
shows the top traffic hotspot on different sections of the road. Other traffic
jams occur multiple times every weekday
in each city, along with a but break up and reform often. While the
traffic hotspot’s start and aggregated summary allows a high-level look
into these top traffic hotspots, INRIX Roadway
end points, duration, length Analytics allows users to dive further into each
and number of traffic jams traffic jam and their related incidents.
that occurred within the
study period. Also provided is
the present value of cost of
congestion across the next
decade, discounted at seven
percent annually.
INRIX RESEARCH | INTELLIGENCE THAT MOVES THE WORLDINRIX: US TRAFFIC HOTSPOTS
Table 3: INRIX Roadway Analytics Top Hotspots by City
RANK CITY TRAFFIC HOTSPOT AVG. AVG. TRAFFIC IMPACT 2026
DURATION MAX JAMS FACTOR ECONOMIC
(MIN) LENGTH COST
(MILES)
1 Washington, D.C. I-95 S at Exit 133A to Fairfax County 33 6.47 1,394 297,633 $2.3bn
Parkway
2 Los Angeles, CA I-405 N at Exit 43 to Exit 21 23 5.12 2,032 239,288 $1.9bn
5 Chicago, IL I-90 W at 81A to Exit 56B 79 8.55 238 160,757 $1.3bn
10 San Diego, CA I-15 N at Exit I-215 to Gopher Canyon 177 13.71 54 131,040 $1.0bn
Road
11 New York, NY Brooklyn Queens Expy E at Exit 28A to 64 4.37 462 129,212 $1.0bn
W Shore Expy
12 Houston, TX I-45 S Exit 46A to Exit 63 75 5 340 127,500 $992m
14 San Francisco, CA I-80 W at Emeryville to CA-4 53 4.35 504 116,197 $904m
16 Atlanta, GA I-285 S at I-20 to Route 23 74 10.38 143 109,841 $854m
20 Seattle, WA I-5 S at Pike St to 128th St/Exit 186 39 6.14 406 97,221 $756m
27 Boston, MA Massachusetts Tpke E at Boston U 35 6.16 401 86,456 $672m
Bridge to Oak St
33 Portland, OR US-26 E at I-405 to NW 185th Ave 77 4.2 253 81,820 $636m
39 Columbia, MD I-695 CCW at Baltimore Nat'l Pike to 81 6.64 148 79,600 $619m
Providence Rd
45 Philadelphia, PA Mid-County Expy S at E Rose Valley Rd 31 5.31 466 76,708 $597m
to Pearl Harbor Memorial Bridge
58 Stamford, CT I-95 S at Route 136 to Stratford Ave 56 6.32 197 69,722 $542m
63 Nashville, TN I-24 W at Antioch Pike to Rocky Fork Rd 39 4.85 353 66,770 $519m
64 Austin, TX I-35 N at Stassney Ln to Exit 223 97 3.67 185 65,858 $512m
74 Denver, CO US-36 W / I-270 at Exit 1 to Smith Rd 133 3.87 119 61,250 $476m
81 Miami, FL I-95 N at Exit 12A to US-1 33 7.79 229 58,869 $458m
83 Baton Rouge, LA I-10 E at College Dr to Port Allen Lock 161 7.17 50 57,719 $449m
84 Dallas, TX I-20 W at Exit 451 to Exit 466 109 4.57 115 57,285 $446m
122 Phoenix, AZ I-10 W at Exit 138 to Exit 151 32 7.56 212 51,287 $399m
158 Pittsburgh, PA Lincoln Hwy E at Fort Pitt Tunnel to 59 2.9 274 46,881 $365m
Settlers Ridge
385 Detroit, MI I-94 W at Inkster Rd to Gratiot Ave 28 5.54 179 27,766 $216m
401 Minneapolis, MN I-94 W at State Hwy 128 to 250th St 36 3.8 198 27,086 $211m
670 Santa Barbara, CA US-101 N at San Ysidro Rd to La 50 5.65 66 18,645 $145m
Conchita
INRIX RESEARCH | INTELLIGENCE THAT MOVES THE WORLDINRIX: US TRAFFIC HOTSPOTS
3.3 CITY TOTALS Across all 25 cities, the total cost of all
17
hotspots over the next decade were estimated
at more than $480 billion. Extrapolated across
To show the effects of all the country as a whole, the cost of hotspots
traffic hotspots at the city are expected to reach $2.2 trillion
through 2026.
level, the total number of
hotspots ranked by Impact Impact Factor can also be used with other
metrics to provide a better understanding of
Factor and Impact Factor traffic congestion across varying city sizes,
per capita are provided in densities and travel patterns. For example,
Stamford ranked 22nd in overall Impact
Table 4. Factor, indicating a moderate level of
congestion at traffic hotspots compared to its
While New York had more traffic hotspots peers. Yet Stamford had the second-highest
than any other city analyzed, drivers in Los Impact Factor per capita and the highest
Angeles faced the greatest impact from traffic Impact Factor per traffic jam. This suggests
hotspots, both in aggregate and per-capita. that the area has a disproportionately-high
In L.A., INRIX Roadway Analytics identified level of congestion at traffic hotspots for its
10,385 traffic hotspots comprised of more size, something not reflected in its 22nd
than 128,000 traffic jams between March overall ranking.
and April 2017. These hotspots summed to
an Impact Factor of 11.7 million. Based on In another example, San Francisco (ranked
Impact Factor, Los Angeles’ hotspots were seventh) had nearly double the Impact Factor
estimated to cost drivers in the city more than per traffic jam than Atlanta (ranked fourth),
$90 billion over the next ten years. despite a total Impact Factor just six percent
lower than Atlanta. This suggests that traffic
New York ranked second, with an aggregated jams, when they occur, are more severe in the
Impact Factor of 8.2 million, 30 percent Bay Area than Atlanta.
lower than L.A, despite having just 12 percent
fewer traffic jams, resulting in an estimated
$64 billion in lost time and wasted fuel
over the next decade. The Impact Factor
of hotspots in Los Angeles and New York
combined surpassed the next five cities
together: Washington D.C. (IF: 3.8m; $29bn),
Atlanta (IF: 3.7m; $29bn), Dallas (IF: 3.6m;
$28bn), Chicago (IF: 3.6m; $28bn) and San
Francisco (IF: 3.5m; $27bn).
INRIX RESEARCH | INTELLIGENCE THAT MOVES THE WORLDINRIX: US TRAFFIC HOTSPOTS
Table 4: INRIX Roadway Analytics Impact Factor Ranking – U.S. Cities
IMPACT IMPACT CITY TRAFFIC TRAFFIC IMPACT IMPACT 2026 COST
FACTOR FACTOR PER JAMS HOTSPOTS FACTOR FACTOR PER OF
RANK CAPITA RANK TRAFFIC JAM CONGESTION
1 1 Los Angeles, CA 128,116 10,385 11,692,591 91.3 $90.9bn
2 17 New York, NY 113,373 13,608 8,215,036 72.5 $63.9bn
3 5 Washington, D.C. 50,077 6,097 3,758,733 75.1 $29.2bn
4 4 Atlanta, GA 58,536 8,554 3,714,123 63.5 $28.9bn
5 9 Dallas, TX 44,754 6,720 3,644,525 81.4 $28.3bn
6 18 Chicago, IL 40,259 7,719 3,631,591 90.2 $28.2bn
7 3 San Francisco, CA 29,964 2,587 3,458,305 115.4 $26.9bn
8 13 Houston, TX 34,836 4,417 3,058,004 87.8 $23.8bn
9 16 Miami, FL 60,008 6,596 2,449,631 40.8 $19.1bn
10 10 Boston, MA 26,844 4,158 2,429,229 90.5 $18.9bn
11 8 Seattle, WA 23,562 2,675 1,929,802 81.9 $15.0bn
12 21 Philadelphia, PA 29,979 6,232 1,896,048 63.2 $14.7bn
13 12 San Diego, CA 14,971 1,936 1,602,278 107.0 $12.5bn
14 15 Denver, CO 16,636 2,258 1,226,504 73.7 $9.5bn
15 22 Phoenix, AZ 18,937 3,441 1,220,561 64.5 $9.5bn
16 11 Portland, OR 15,086 2,365 1,154,218 76.5 $9.0bn
17 6 Nashville, TN 18,128 2,602 1,081,459 59.7 $8.4bn
18 7 Austin, TX 12,231 1,727 1,076,441 88.0 $8.4bn
19 19 Columbia, MD 16,132 2,856 1,046,558 64.9 $8.1bn
20 23 Detroit, MI 17,158 4,284 1,019,345 59.4 $7.9bn
21 24 Minneapolis, MN 9,767 1,903 799,619 81.9 $6.2bn
22 2 Stamford, CT 5,687 777 729,130 128.2 $5.7bn
23 25 Pittsburgh, PA 10,253 2,744 530,395 51.7 $4.1bn
24 14 Baton Rouge, LA 5,389 1,090 389,416 72.3 $3.0bn
25 20 Santa Barbara, CA 1,671 174 146,996 88.0 $1.1bn
INRIX RESEARCH | INTELLIGENCE THAT MOVES THE WORLDINRIX: US TRAFFIC HOTSPOTS
4 INRIX CASE STUDIES
4.1 SAN FRANCISCO BAY San Francisco also had fewer individual
AREA
The San Francisco area
traffic jams than Chicago (40,000 jams)
and Houston (35,000 jams). This suggests
that traffic congestion is far more severe and
concentrated in the Bay Area than in many
19
ranked seventh in the traffic of the other cities studied, reflected in San
Francisco’s second-highest Impact Factor per
hotspot study for impact traffic jam.
– third in the U.S. in the
I-80 Westbound was the Bay Area’s largest
INRIX 2016 Global Traffic traffic hotspot, stretching nearly the whole
Scorecard. Yet despite corridor, starting close to the Bay Bridge and
ending just before the Carquinez Bridge – as
the high rankings in both shown in Figure 4. Noting that this corridor
studies, the Bay Area only is chronically congested, transportation
officials recently upgraded this stretch of
registered about 2,500 traffic I-80 to a “smart corridor.” The technology
hotspots comprised of nearly improvements regulate entrance ramps
onto the freeway, provide drivers up-to-date
30,000 traffic jams – 5,100 information travel and incident information,
fewer traffic hotspots than and adjust traffic lights on adjacent and
parallel roads to ease congestion. Part of the
sixth-placed Chicago and smart corridor technology went into official
1,800 fewer than eighth- operation beginning in April 2016 and was
nearly fully operational by September of
ranked Houston. last year. The primary goal of the project
was to reduce secondary accidents and
improve safety.
Figure 4: The Bay Area’s Worst Hotspot
INRIX RESEARCH | INTELLIGENCE THAT MOVES THE WORLDINRIX: US TRAFFIC HOTSPOTS
INRIX analyzed traffic conditions between the Outside of the morning period, eastbound
20
Bay Bridge and the Carquinez Bridge between travel on I-80 saw a relative decrease in
2014 and 2017, using the January through travel times versus 2016 in the 5:00PM to
May period, to study the year over year impact 10:00PM hours and a lower than average
to I-80 specifically. increase in the earlier afternoon hours.
Table 5 shows westbound and eastbound INRIX Research recommends that more data
travel time changes on I-80 between be used to analyze the health of the I-80
Emeryville and the Carquinez Bridge. corridor. Though not the primary goal of the
Because the smart corridor is only active in project, another year of data would help
the westbound direction, eastbound figures determine if the westbound enhancements
have been included to compare travel time had a sizeable effect on travel times.
changes to the original configuration.
Heading westbound, average travel times
increased between three and six percent over
2016 levels during the 6:00AM to 8:00AM
morning commute period, yet decreased in
the 9:00AM and 10:00AM hours. However,
the increases have been lower than the
annual growth rate between 2014 and 2016.
For example, between 2014 and 2016
travel times grew at an average 8.75 percent
annually, yet the 2016 to 2017 change was
5.26 percent. It should be noted that 2016
saw a significant increase in travel times
over 2015.
INRIX RESEARCH | INTELLIGENCE THAT MOVES THE WORLDINRIX: US TRAFFIC HOTSPOTS
Table 5: I-80 Smart Corridor Before and After
21
PERCENTAGE GROWTH IN TRAVEL TIMES - PERCENTAGE GROWTH IN TRAVEL TIMES -
WESTBOUND EASTBOUND
TIME % CHANGE 2016 TO AGR 2014 TO TIME % CHANGE AGR 2014 TO
2017 2016 2016 TO 2017 2016
6:00am 5.96% 11.80% 6:00am 1.38% -0.10%
7:00am 5.26% 8.75% 7:00am -0.48% 0.00%
8:00am 3.66% 3.38% 8:00am -0.58% -0.38%
9:00am -1.45% 3.49% 9:00am 0.38% -0.66%
10:00am -0.30% 4.35% 10:00am 0.19% -0.34%
11:00am 2.03% 4.68% 11:00am -0.57% 0.43%
12:00pm 1.55% 5.82% 12:00pm -3.52% 2.58%
1:00pm 2.02% 5.06% 1:00pm -2.03% 3.24%
2:00pm -0.52% 5.02% 2:00pm 6.53% 5.55%
3:00pm -5.44% 2.72% 3:00pm 4.27% 12.84%
4:00pm -2.57% -1.30% 4:00pm 1.91% 13.21%
5:00pm -3.07% -2.29% 5:00pm -0.42% 10.98%
6:00pm -2.24% -2.05% 6:00pm -3.62% 11.27%
7:00pm 2.83% -0.84% 7:00pm -2.72% 8.89%
8:00pm 3.10% 0.44% 8:00pm -8.30% 8.23%
9:00pm 2.52% 0.44% 9:00pm -14.31% 10.49%
10:00pm 3.90% 0.34% 10:00pm -10.19% 7.22%
11:00pm 4.98% 0.74% 11:00pm -4.16% 4.91%
INRIX RESEARCH | INTELLIGENCE THAT MOVES THE WORLDINRIX: US TRAFFIC HOTSPOTS
4.2 SEATTLE REGION To reduce congestion on that stretch of
22
I-405, WSDOT converted the shoulder to
a “hard running shoulder” during the PM
Interstate 405, along with commute period. This 1.8-mile addition to
Interstate 5, are main the roadway is similar in principle to the
“Smart Motorways” concept in the U.K., using
North-South corridors in the shoulders and lane management to improve
Seattle region. In September traffic flow during the peak period. I-405’s
shoulder running began in Spring 2017 and
2015, the Washington State has greatly reduced congestion on the I-405
Department of Transportation Corridor, thereby freeing up the toll lane and
lowering toll prices.
(WSDOT) implemented
Express Toll Lanes on the Using INRIX Roadway Analytics Performance
Charts, INRIX Research compared weekday
I-405 corridor, managed with travel on the two-month period between June
variable pricing, between and July of 2016 to June and July of 2017
for a view of before and after operations.
Bellevue in the south end and Figure 4 displays the Travel Time Index (TTI)
Lynnwood on the north end. on northbound travel on the stretch of I-405
between Bothell and Lynnwood. TTI reflects
Approximately half way through the corridor, speeds above the reference, or free-flow
heading northbound at State Route 522, speed. For example, the northbound TTI in
two toll lanes merge into one toll lane, while 2016 at 5:00pm was 1.93, indicating a 93
general purpose capacity reduces from three percent increase in travel times over free-flow.
lanes to two. The high occupancy vehicle After WSDOT completed the shoulder running
lane was converted to a toll lane in this project, TTI dropped to 1.58 in 2017, leading
section with no added capacity, creating a to an 18 percent decrease in travel times.
physical traffic bottleneck. This traffic hotspot
was causing chronic congestion heading This large decrease during the PM commute
northbound between Bothell and Lynnwood, came at a cost of $11.6 million and appears
with the general-purpose lanes and the to be having a positive impact on travel times.
toll lane congested during the PM peak Using the Smart Motorways concept can be
period commute. an effective tool to provide congestion relief
without the need to purchase additional rights
of way.
Figure 5: Northbound I-405 Weekday Travel Time Index
2
1.5
Travel Time Index
1
0.5
0
9 AM 10 AM 11 AM 12 PM 1 PM 2 PM 3 PM 4 PM 5 PM 6 PM 7 PM 8 PM
May/June 2016 May/June 2017
INRIX RESEARCH | INTELLIGENCE THAT MOVES THE WORLDINRIX: US TRAFFIC HOTSPOTS
5 CONCLUSION
Many state and local As noted in Wired Magazine, states are
23
stepping up to fill the gap in federal
transportation agencies have infrastructure spending:4
enacted long-term programs
“On Election Day, Americans in cities and
to improve urban mobility. regions across the US approved some
Yet despite future gains, $170 billion in public transit funding, plus
billions more to improve roads, rail, ports, and
transportation agencies face bicycle and pedestrian infrastructure.”
a few uphill battles to tackle
Although in the early stages, government
congestion at traffic hotspots. officials across the country have enacted
long-term transportation programs, such as
Though Los Angeles drivers have it the worst, California’s recently-passed Senate Bill 1 - the
traffic hotspots affect nearly every major Road Repair and Accountability Act of 2017.
American city, sometimes disproportionately, This package invests $54 billion over the next
as in the case of cities like Stamford. decade to fix roads, freeways and bridges in
To combat traffic hotspots, many state and communities across California and puts more
local governments are moving forward with a dollars toward transit and safety. These funds
host of projects to improve travel times and will be split equally between state and local
reduce delay. investments. Similar legislation has recently
been enacted in other states to pay for
Chicago’s top hotspot, for example, on I-90 maintenance, preservation and transportation
westbound at North Newcastle Avenue, is just enhancements, like Washington state’s
four miles east of a recent roadway expansion $16 billion Connecting Washington plan and
project on the Jane Addams Memorial Tollway. New Jersey’s $16 billion Transportation Trust
Illinois Tollway recently added a lane in Fund capital program.
each direction, which increased westbound
peak hour travel speeds by 64 percent. The New York City Department of
It also activated “smart” features, such as Transportation is focusing on improving
dynamic travel time information, active lane mobility, enhancing safety and reducing
management and shoulder running for buses emissions at the city-level through the
and emergency vehicles. Citywide Congested Corridors Project.
This planning study concentrates on fourteen
roadways throughout the city, and will
implement recommendations to reduce
congestion and improve New Yorkers’ quality
of life.
4.”US Cities, Spurned by Washington, Fund Transit Themselves,” by Aarian Marshall, WIRED,
Nov. 2016, at https://www.wired.com/2016/11/us-cities-spurned-washington-fund-transit/
INRIX RESEARCH | INTELLIGENCE THAT MOVES THE WORLDINRIX: US TRAFFIC HOTSPOTS
Other regional efforts are also underway.
24
Atlanta’s Transform 285/400 project will
reduce congestion and improve safety in
metro Atlanta. Measure M in Los Angeles,
New York’s B.Q.E. from Atlantic Avenue to
Sands Street and the long running Transnet
program in San Diego are all helping to
improve mobility in their respective regions.
Even with bold programs like these, however,
budgets remain tight, requiring transportation
agencies to target investments for the most
severe traffic hotspots.
In many areas, local, state and federal funding
doesn’t meet basic maintenance, preservation
and expansion needs. The federal gas tax
has not increased since 1993, losing 40
percent of its purchasing power to inflation.
In many states, roadblocks to public-private
partnerships or an increasing difficulty to raise
funds or borrow on existing tax sources restrict
agencies to provide congestion relief that
could provide immediate benefit to travelers.
That’s why so many people are focused on
the White House’s intent to spend one trillion
dollars on infrastructure – and dedicating
a good amount to surface transportation.
Regardless of the funding or financing
mechanism, state and local transportation
agencies will need to rely on data and
analytics to provide a cohesive and accurate
benefit-cost analysis – and target any future
funds to maximize investments to benefit
drivers, transit riders and freight movers.
INRIX Roadway Analytics allows transportation
professionals the ability to recognize, analyze,
visualize and prioritize to improve urban
mobility in their city, region or state.
INRIX RESEARCH | INTELLIGENCE THAT MOVES THE WORLDINRIX: US TRAFFIC HOTSPOTS
NORTH AMERICA
10210 NE Points Drive
Suite 400
25
Kirkland
WA 98033
United States
+1 425-284-3800
info@inrix.com
INRIX RESEARCH | INTELLIGENCE THAT MOVES THE WORLDYou can also read