Deloitte Economics: Coronavirus Impact Monitor - Investing and saving during lockdown

Page created by Enrique Wise
 
CONTINUE READING
Deloitte Economics: Coronavirus Impact Monitor - Investing and saving during lockdown
Deloitte Economics: Coronavirus Impact Monitor
Investing and saving during lockdown
17th edition, 26 February 2021
Deloitte Economics: Coronavirus Impact Monitor - Investing and saving during lockdown
Coronavirus outbreak
Following the reintroduction of heavier restrictions combined with vaccine programmes, the
magnitude of new daily confirmed cases is decreasing globally compared to previous months
                                                                                                7-day rolling average new daily confirmed COVID-19 cases for selected countries (000s)
 •    The number of confirmed cases has reached 111 million, and
      almost 2.5 million people have lost their lives. With infection                              United States and Brazil        United Kingdom and Germany       Denmark and Sweden
      rates rising in winter, more stringent lockdown conditions
      were introduced in most European countries. However, while

                                                                               # Daily cases
      COVID-19 continues to spread across the globe, the
      magnitude of new cases has been in decline.
 •    In Denmark, following the lockdown and the rollout of
      vaccines, the magnitude of new daily confirmed cases has
      decreased, and the current number of people hospitalised is
      247 compared to approx. 600 at the end of January. Levels in
      Sweden have likewise been in decline following a high peak in
      mid-winter.
 •    A similar pattern is seen in the United States where the
      second wave likewise had a large impact, however, the                                       7-day rolling average new daily confirmed COVID-19 deaths for selected countries
      number of new cases is declining. The country reached a sad                                  United States and Brazil          United Kingdom and Germany     Denmark and Sweden
      milestone recently, passing 500,000 deaths.
 •    In contrast, Brazil has reported fewer cases, but recent figures
      do not indicate sharp decreases.
 •    Both Germany and the United Kingdom experienced a rise in
                                                                               # Daily deaths

      confirmed cases during winter, but new daily cases are
      declining. However, a number of small border-crossings
      between Denmark and Germany have recently been closed to
      cope with local outbreaks.
 •    With the outlook of potentially fewer restrictions, it will be
      interesting to see whether the impact of the virus can be kept
      low or whether the risk of a third wave will materialise.

Sources: World Health Organisation (WHO), the Danish Health Authority (Sundhedsstyrelsen), Worldometers, The Danish Ministry of Justice (Justitsministeriet)
Coronavirus Impact Monitor – 26 February 2021                                                       Page 2                                                            Deloitte Economics © 2021
Deloitte Economics: Coronavirus Impact Monitor - Investing and saving during lockdown
Impact on financial markets
Technology shares continue to increase in value, and despite uncertainty from the pandemic, the
number of Danish equity owners is on the rise
                                                                                                                                                Equity markets: Sectoral indices in Europe1
 •      European equity markets continue to show some sector
        divergence.
                                                                                                                                                      Major outbreak in Europe
 •      European Transport, Energy and Financial stocks have been                                                                                                                                                               135
                                                                                                               140
        increasing in value in the past month. Since the beginning of
        February, the indices are up by 8%, 9% and 10%, respectively.

                                                                                     (2 Jan 2020 = 100)
                                                                                                               120

                                                                                      Sectoral indices
        However, both Transport and Energy are still struggling to reach                                                                                                                                                        102
        the levels from early 2020, while Financial stocks are up by 1%.                                       100                                                                                                                 101

 •      Technology shares continue to increase in value and are up by                                                                                                                                                                86
                                                                                                                80
        35% since January 2020, however, with a lower return of 4% in                                                                                                                                                           83

        February than Transport, Energy and Financial stocks.                                                   60

 •      Medical & Pharmaceuticals shares are slightly above the levels                                          40
        from early 2020, however, the sector index has decreased by                                            30 1Dec
                                                                                                                    Jan   1 Feb 1 Mar 1 Apr 1 May 1 Jun           1 Jul    1 Aug 1 Sep 1 Oct 1 Nov 1 Dec         1 Jan    1 Feb 1 mar
                                                                                                                2019
        1% in the past month.                                                                                              Transport       Energy           Medical & Pharmaceuticals            Financial     Technology
 •      Despite uncertainty, many Danish private investors have
        entered the financial markets during the pandemic. The graph                                                      Danish equity owners                                              Danish private investments
                                                                                                                                                                      Kr. billion.
                                                                                                             11700
        in the left below corner indicates the number of Danish share
                                                                                                                                                                          30
        owners end of month and shows an increase in the past year.                                          11600
                                                                                                                                                                          20
 •      During lockdown private investors nearly tripled their
                                                                                     # Danish share owners
                                                                                      end of month (000s)

                                                                                                             11500                                                        10
        investments in equities, whilst shedding a sizeable amount of
        bond holdings due to low yields.                                                                     11400                                                         0

 •      The volume of trades has also increased significantly. According                                                                                              -10
                                                                                                             11300
        to Finanswatch.dk, based on data from VP Securities, Danish                                                                                                   -20
        private investors conducted more than 3 million trades of                                            11200
                                                                                                                                                                      -30
        shares in 2020, an amount 50% higher than in any year since                                                                                                                  2015    2016    2017      2018      2019    2020
                                                                                                             11100
        2010. It will be interesting to see whether the tendency will                                            nov-19       feb-20   maj-20      aug-20                      Mixed funds      Equity funds    Bond funds      Total
        sustain.

Note:     1) Refinitiv European sectoral price indices measured by Refinitiv (Thomson Reuters)
Sources: Thomson Reuters Eikon and S&P Capital IQ, VP Securities, Finanswatch.dk, TV2
Coronavirus Impact Monitor – 26 February 2021                                                                        Page 3                                                                                  Deloitte Economics © 2021
Deloitte Economics: Coronavirus Impact Monitor - Investing and saving during lockdown
Property prices surge during the restriction period
Across all regions and property types, prices are increasing in accordance with extra time being
spent at home and an increase in involuntary savings
 •    There is a continuation of the post-GFC property price increase                                  Index property prices – Denmark-wide
      in Denmark, backed by the corona lockdown conditions, causing
      more people to be at home for longer periods.                      140
 •    Lower interest rates to counter the recessionary effects of
      COVID have also encouraged re-mortgaging and new                   120
      mortgages, as the lower expected interest costs have inflated
      property prices through the demand side.                           100

 •    Apartments, especially in the major metropolitan areas,
                                                                          80
      continue to outpace both summer homes and family houses in
      terms of value per square metre, as well as the relative price
      increases. We are also seeing a heightened response to              60
                                                                                  2019K1        2019K2     2019K3     2019K4     2020K1     2020K2     2020K3
      geographic preferences, over the home quality during the
      period.                                                                                  Family home          Summer house          Apartments

 •    Unsurprisingly, the capital region projects the strongest growth
      in all three property types, with the largest increases across a                  Indexed highest growth property types and region (Capital) 2014-2020
      seven-year period                                                  140
 •    Amongst the most high-growth properties since 2014, we see
      that summer houses around the Copenhagen region outpaced           120
      the price increases of both houses and flats in any other urban
      centre (excl. the capital), with a 34% increase over the period.
                                                                         100
 •    Apartments in Copenhagen continue to reign supreme in the
      property market, with an indexed increase of more than 42%
                                                                          80
      across the study period. Given the interest rates and living
      preferences, this can be expected to continue in the next few
      years.                                                              60

                                                                                               Family house         Summer house          Apartments

Source:   Statistics Denmark
Coronavirus Impact Monitor – 26 February 2021                                  Page 4                                                              Deloitte Economics © 2021
Deloitte Economics: Coronavirus Impact Monitor - Investing and saving during lockdown
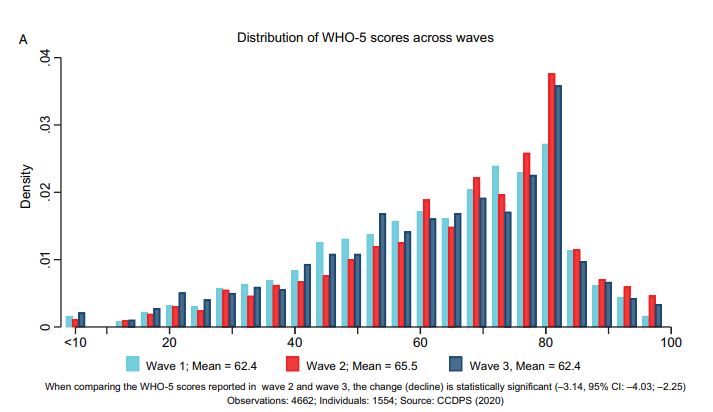
Financial distress for companies and employees
There is a linear increase in the number of business bankruptcies year-on-year across Denmark

                                                                                                                                                 Bankruptcies in active companies
 •    Since 2013, we have observed that there has been a gradual
      increase in the number of business bankruptcies in Denmark.                 350
                                                                                  300
 •    Whilst we do see a sharp uptick in bankruptcies at the
      beginning of 2021, there are several confounding factors which              250
      influence this, including the provision of state aid for those              200
      businesses which had issues with meeting payroll requirements,              150
      state loans for certain businesses, and lowered capacity to                 100
      process bankruptcies by the state bankruptcy office.                          50
 •    The upwards trend of bankruptcies could also be due to a larger                0

                                                                                          2013M11

                                                                                                              2014M07

                                                                                                                                  2015M03

                                                                                                                                                      2015M11

                                                                                                                                                                          2016M07

                                                                                                                                                                                              2017M03

                                                                                                                                                                                                                  2017M11
                                                                                                    2014M03

                                                                                                                        2014M11

                                                                                                                                            2015M07

                                                                                                                                                                2016M03

                                                                                                                                                                                    2016M11

                                                                                                                                                                                                        2017M07

                                                                                                                                                                                                                            2018M03
                                                                                                                                                                                                                                      2018M07
                                                                                                                                                                                                                                                2018M11
                                                                                                                                                                                                                                                          2019M03
                                                                                                                                                                                                                                                                    2019M07
                                                                                                                                                                                                                                                                              2019M11
                                                                                                                                                                                                                                                                                        2020M03
                                                                                                                                                                                                                                                                                                  2020M07
                                                                                                                                                                                                                                                                                                            2020M11
      increase, proportionally, to new business ventures, which can
      be the sign of a healthy economy and favourable bankruptcy
      laws.
 •    Per region, Copenhagen remains both the largest employer and
      the largest recipient of bankruptcy claims.
                                                                                                                                                      Bankruptcies by region 2020-21
 •    January this year saw the largest month-to-month increase in
      bankruptcy claims collectively across all regions, and as such
                                                                                                              Jan             Feb               Mar                 Apr              May                 Jun                 Jul                Aug             Sep                Oct               Nov              Dec    Jan
      represents a higher impact for government programmes like
      unemployment insurance funds and income protection.               Region Capital                         293                170                 101                 296            297                222                230               151                150                 160             180            376    621
 •    Given the process capacity of the government agencies, we may
      expect a return to normal for the number of bankruptcies in the   Region Sjælland                            51                65                 46                 54            117                      78              79                48                 60                 48                68          91    102
      long term, however, further state aid may be required avoid
                                                                        Region Syddanmark                          73             104                   53                 58                 51                  67              66                36                 80                 73                81          82    101
      sector specific bankruptcies in heavily COVID-affected
      industries, such as tourism, hospitality, shopping centres, and   Region Midtjylland                         99                83                 61                 59                 88                  56              82                50                 87                 95                82         116    219
      live entertainment.
                                                                        Region Nordjylland                         28                44                 34                 27                 38                  32              22                19                 32                 37                39          49     69

Source:   Nationalbanken, FoM, Statistics Denmark
Coronavirus Impact Monitor – 26 February 2021                                      Page 5                                                                                                                                                                                     Deloitte Economics © 2021
Q4 GDP update
As Q4 GDP numbers are published, figures indicate that the heavier restrictions put in place at the
end of 2020 have manifested less negatively than the restrictions in the first wave of the virus
     Q1 2020                                                                                              Quarter-on-quarter GDP growth for selected countries1:
                                                                                                                         Q1, Q2 Q3 and Q4 2020
     Q2 2020
     Q3 2020
                                                                                                                                                                                                                                                           22%
     Q4 2020                                                     19%
      16%           16%                                                      16%
                                                 12%                                     12%                                                                                                         12%
                                   9%                                                                  9%              9%              8%                                                                                                                                                                     8%
                                                                                                                                                     5%              5%                                            5%                                                                         5%
                                                          3%                                                   2%                                                                    2% 1%            3% 3%                     3%              3%                          3%                        3%
             1%             0%                                                                                                  0%          1% 0%            1%               1%                                           1%             0%             1%                                                                2%

                                          (1%)                      (1%)                  (1%) (2%) (2%)                        (1%)                         (2%)             (1%)                            (1%)    (2%)                                            0%               (1%)           (2%)            (1%)
 (3%)                       (2%)                                                (2%)                                                                                                 (3%)
             (5%)                                                     (5%)             (4%)                                                                                                                      (5%)    (4%)                                                                                            (3%)
                                                          (6%)                                                                                                    (7%)                                                                                                 (7%)
                                                                                                                                     (9%)      (8%)                                                                                       (8%) (7%)                                       (8%)
                                 (11%)                                                                              (10%)                                                                          (10%)                                                                                                   (10%)
                                                                          (12%)        (12%)        (11%)
                                                               (14%)
                  (18%)                     (17%)
     (19%)

                                                                                                                                                                                                                                                         (25%)
                                                                             Italy

                                                                                                                                                    Sweden
                                                 Mexico

                                                                                                                                                                    Denmark

                                                                                                                                                                                                                                               Iceland

                                                                                                                                                                                                                                                                                                             Brazil
                                                                                                                      Germany

                                                                                                                                                                                                                                                                           Australia
                    Spain

                                                                                                                                                                                                                                                                                                                          Russia
                                   OECD

                                                                                         Eurozone
                                                                 France

                                                                                                                                                                                                                                Finland
        UK

                                                                                                                                       US

                                                                                                                                                                                                      China

                                                                                                                                                                                                                                                                                              Japan
                                                                                                                                                                                                                  Norway
                                                                                                      Canada

                                                                                                                                                                                     South Korea

                                                                                                                                                                                                                                                              India
 •      New GDP figures for Q4 2020 have started to be released by various countries, including figures published for Denmark showing a 0.6% increase in Q4. This data captures
        the quarter when most countries began implementing heavier restrictions following the second wave of COVID-19.
 •      The published figures indicate modest changes compared to Q2 and Q3. The Nordic countries in general experienced a small increase in GDP in Q4, while France and Italy
        experienced decreases of around 1%-2%.
 •      In the Eurozone as a whole, GDP decreased by 0.6% in Q4 2020 based on data available at the time of writing. Comparing this with the Q2 figure showing a 11.7% drop
        followed by a 12.4% increase in Q3, this suggests that the second lockdown had a more modest impact on GDP growth in the Euro area compared to lockdowns in the first
        wave of the virus. However, it will be interesting to see how the restrictions will materialise in Q1 2021.
 •      Some countries have fared better than others. Based on data available at the time of writing, China, Japan and Mexico all experienced an increase of around 3%, however,
        both China and Japan experienced lower quarter-on-quarter growth in Q3 than the Eurozone countries.

Note:        1) Some figures are preliminary and subject to change
Source:      OECD
Coronavirus Impact Monitor – 26 February 2021                                                                                                       Page 6                                                                                                                              Deloitte Economics © 2021
Danish saving rates and private consumption levels
Recent analyses suggest that a high increase in savings during the first wave of COVID-19 was driven
by restrictions rather than precautionary consumers

     Savings rate, disposable income and private consumption                  Change in savings rate for selected countries                            Portion of precautious savings
     Billion DKK                 Percentage of disposable income   Change in savings rate in Q2 2020 in percentage points                 Percentage points

                              Disposable
                              income
                                                Private
                                                consumption

                                                                                                                                                     Financial crisis         COVID-19 pandemic
                           Savings rate (right axis)
                      Quarterly observations seasonally adjusted                                            Degree of lockdown, Q2 2020      Change in savings rate     Portion of precautious savings

 •      Household savings saw a historically high increase in Denmark during the first wave of the coronavirus, particularly due to a decrease in consumption, while disposable
        income remained relatively unchanged as illustrated in the figure to the left. A recent publication by Danmarks Nationalbank suggests that the increase in savings was
        driven by restrictions rather than precautious consumers.
 •      As shown, the increase in savings was positively correlated with heavier lockdown restrictions. Furthermore, in Denmark, the change in the savings rate was higher than
        during the financial crisis, while the share of precautious savings was lower, which could suggest that consumption levels may augment at a higher pace once society
        reopens than post the financial crisis.
 •      It remains to be seen, whether the savings rates will return to levels equivalent to those seen before the lockdowns were introduced once society reopens, and, if so, at
        what pace. Danmarks Nationalbank suggests three pattern scenarios: 1) a significantly precautious pattern and slow return to original saving rate levels either as a result of
        precautionary consumers or a slow reduction of restrictions; 2) slow conversion of savings into consumption despite reduction of restrictions; and 3) a high reduction in
        savings rate due to accumulated demand quickly being converted into consumption.
 •      From the changes in trading volumes of shares from private investors and housing prices with reference to the previous slides, it will be interesting to see how a potential
        change in the savings rate may affect these depending on the savings rate pattern that will materialise.

Source:    Danmarks Nationalbank: https://www.nationalbanken.dk/da/publikationer/Documents/2021/02/Economic%20Memo%20nr.%202%202021.pdf
Coronavirus Impact Monitor – 26 February 2021                                                         Page 7                                                                       Deloitte Economics © 2021
Socio-economic lockdown effects
Lifestyle effects of an extended restriction period can be severe

                                        Divorce rates – Denmark                                                    Distribution of WHO-5 scores across waves – Denmark

     2000,0
     1800,0          Lockdown (2020)
     1600,0
     1400,0
     1200,0
     1000,0
      800,0
      600,0
      400,0
      200,0
         -

                                       2018        2019           2020

 •     Indicators from 2020 may reflect a socioeconomic impact of corona and restrictions that could be associated with large economic costs.
 •     Over the 2020 period, there has been an increase in divorce rates in Denmark compared to levels from 2019.
 •     However, life under lockdown comes with its own mental and physical challenges. As a result of quarantine, some people may notice weight gain during the pandemic —
       one study suggests 22% of adults reported gaining weight during the COVID-19 pandemic.
 •     A recent study by Sønderskov et al. (2021) likewise highlights the impact of the virus on well-being by conducting a three-wave panel study from a survey representative of
       the Danish population measuring the reported well-being based on WHO-5 scores. Wave 1 indicates results from when the lockdown was introduced, wave 2 indicates
       spring when restrictions and the impact of the pandemic were decreasing, and wave 3 represents winter when a new lockdown was put in place. The results show a
       statistically significant decline in well-being between wave 2 and wave 3 and a covariation between well-being and the intensity of the COVID-19 pandemic and the
       associated societal restrictions, highlighting the pandemic’s psychological effects.
 •     In the United Kingdom, provisional data for England and Wales shows there were 5,460 deaths related to alcohol-specific causes registered in the first three quarters of
       2020 (Jan to Sept), a 16.4% increase compared with the same nine-month period in 2019.
 •      According to the ABS, there was a 37% drop in the number of Australians missing work, primarily due sick leave in the months after the initial restrictions in March.

Sources: Reuters, ONS.GOV.UK, ABS.ORG.AU Statistics Denmark, Sønderskov KM, Dinesen PT, Vistisen HT, and Østergaard SD. (2021)
Coronavirus Impact Monitor – 26 February 2021                                              Page 8                                                                Deloitte Economics © 2021
Coronavirus heatmap
Deloitte Economics’ view on the short-term outlook across selected sectors in Denmark

 Consumer
 • Consumer indexes keep increasing but intended spending on non-essential                                                      Denmark
    goods stay low.                                                                         Sector
 Energy & Resources                                                                                            Short term                      Outlook
 • Energy prices are starting to return to pre-crisis levels.

 Financial Services
                                                                                          Consumer         Neutral/Low impact             Moderate recovery
 • Valuation recovery stagnates, and the sector contemplates long-term
    changes and long-term depressed interest rates.
 Industrials                                                                       Energy & Resources       Moderate impact                 Slow recovery
 • The economic impact of the 2nd wave has been less severe compared to the
    first in spring 2020.
 Life Science & Health Care (LSHC)                                                  Financial Services        High impact                 Moderate recovery
 • Medical & Pharmaceuticals stocks have been performing well and are well
     above pre-outbreak levels. Less uplift from the vaccine than expected.
 Real Estate                                                                              Industrials       Moderate impact               Moderate recovery
 • Due to record breaking transactions volumes in Q4 2020 especially within
    residentials, the total transaction volume of 2020 ended up c. 20% above
    2019 levels. However, retail and hotels continue to struggle.                  Life Science & Health
                                                                                                           Neutral/Low impact         Growth opportunities
                                                                                            Care
 Technology, Media & Telco (TMT)
 • TMT sectors have shown relative resilient to COVID-19, as the world has
    gone digital.                                                                         Real Estate       Moderate impact               Moderate recovery
 Transport
 • The transport market is in recovery following the opening of several                   Technology,
    markets.                                                                                               Neutral/Low impact         Growth opportunities
                                                                                         Media & Telco
 Please note that variations in industries may occur. We refer to pages 12-16
 for an in-depth coverage of developments in selected industries.                         Transport         Moderate impact                 Slow recovery

Coronavirus Impact Monitor – 26 February 2021                                   Page 9                                                     Deloitte Economics © 2021
Key messages
Increased personal investing and saving rates, house prices, and negative health effects from COVID

 •    COVID-19 is continuing its spread across the world, with more than 111 million confirmed cases, and about 2.5 million people have lost their lives.
 •    With the second wave resulting in heavier restrictions in many countries, the magnitude of new daily confirmed in Europe and the United States has been in decline.
 •    European shares continue to show some sector divergence, however, despite uncertainty from the pandemic, Danish private investors are entering the market.
 •    As Q4 GDP numbers are published, the lockdown restrictions following the second wave have not manifested as negatively as seen in Q2, however, it will be interesting to
      see whether they will materialise in Q1 2021.
 •    The first wave of the pandemic led to an increase in the savings rate in Denmark, however, a recent analysis suggests that the majority of savings stem from involuntarily
      savings due to the imposed restrictions rather than from precautious reasons.
 •    House prices continue to surge and will be pushed higher for those wishing to live centrally to the major metropolitan areas.
 •    Bankruptcies have risen to start 2021, some due to delays but further government aid may be required for those firms operating in highly affected industries.
 •    There has been indications negative socio-economic outcomes from the lockdown for most Western countries, including higher alcohol consumption, increased divorce
      rates, lower fertility rates, weight gain, and mental distress.
 •    The government may need to provide support measures to soften the impact of continued restrictions or ease the lockdown.
 •    It remains to be seen how management of the virus will affect the efforts for economic recovery and how the impact and rollout of a vaccine will influence the level of
      aggression in solving this economic crisis across 2021.
 •    Deloitte Economics will continue monitoring the impact of the coronavirus in Denmark and globally. Find our updates here

                                                                 For questions on the contents of this report, please contact:

                      Majbritt Skov                                                     Tinus Bang Christensen                                  Peter Lildholdt
                      Partner, Head of Deloitte Economics                               Partner                                                 Vice President
                                                                                             Mobile: +45 30 93 44 63
                            Mobile: +45 30 93 54 71                                                                                                  Mobile: +45 40 35 25 36
                                                                                            tbchristensen@deloitte.dk
                            maskov@deloitte.dk                                                                                                       plildholdt@deloitte.dk

Disclaimer: The information in this document is intended for knowledge sharing only.

Coronavirus Impact Monitor – 26 February 2021                                               Page 10                                                          Deloitte Economics © 2021
Industry outlook

                   Consumer                     Page 12

                   Industrial                   Page 13

                   TMT                          Page 14

                   Energy & Resources           Page 15

                   Real Estate                  Page 16

Coronavirus Impact Monitor – 26 February 2021   Page 11   Deloitte Economics © 2021
Consumer           Industrials               TMT          Energy &
                                                                                  Resources           Real Estate

                      Industry outlook: Consumer
                      Consumer indexes keep increasing, but intended spending on non-essential goods stay low

                                                                                                 Highlights from the industry (as of 24 February 2021)

                                                                                                       Based on top 10 companies
                      130.0                                                                                                                       Deloitte State of the Consumer Tracker
                      120.0                                                                                                        118.7
                                                                                                                                   117.3     Consumers’ intention to spend more during the next four weeks
                      110.0
Indexed share price

                                                                                                                                           Clothing/                                                      Household                      Restaurant/
                      100.0                                                                                                                              Electronics   Furnishings       Groceries                       Medicine
                                                                                                                                           footwear                                                         goods                          takeout
                                                                                                                                    97.1
                       90.0                                                                                                         90.2

                       80.0

                       70.0                                                                                                                 -16%          -13%           -23%              22%             16%            10%              -20%

                       60.0
                        24 Dec 19      24 Feb 20         24 Apr 20    24 Jun 20   24 Aug 20     24 Oct 20      24 Dec 20   24 Feb 21         Consumers’ intended purchase channel
                                                    1                        2                    3
                                             Retail             Hospitality          Consumer                 MSCI World
                                                                                                                                             55%            51%              61%                                                             58%
                                                                                                                                                                                            80%             77%            79%
                         Retail index has moved from index 113.0 to 117.3 (since last update).                                               13%            14%                                                                              14%
                                                                                                                                                                             11%
                                                                                                                                             32%            35%              27%                     7%      8%    15%              9%       28%
                         Hospitality index has moved from index 87.5 to 97.1 (since last update).                                                                                           13%                            12%

                         Consumer index has moved from index 91.2 to 90.2 (since last update).
                                                                                                                                                                  In store         Online - Pickedup         Online - Delivered

                                                                                                           Trading multiples and economic outlook
                                              Index: MSCI World Retailing Index (top 10 companies)                                                Latest consumer confidence index4 (as of January 2020) has increased to
                                         Historical averages                        Coronavirus impact
                                          (EV/FY0 EBITDA)                            (EV/FY0 EBITDA)                                              98.6, illustrating a minor negative development, and thus still indicating a
                                                                                                      -1.2x                                       somewhat doubtful attitude towards the future economic development.

                                                15.2x                15.1x                    17.0x           15.8x                        101
                               13.7x                                                                                                                                                                                                          98.6
                                                                                                                                             98

                                                                                                                                             95
                                                                                                                                              Jan-07      Jan-09       Jan-11        Jan-13       Jan-15        Jan-17       Jan-19        Jan-21
                              10y avg.         5y avg.           3y avg.                Jan 1, 2020           Current
                                                                                                                                                                        Consumer confidence index (OECD-Europe)

                      Note:     1) MSCI World Retailing Index; 2) MSCI World Consumer Services Index; 3) MSCI Consumer Staples Index; 4) Based on OECD – Europe region
                      Sources: Capital IQ; MSCI; European Parliament; Deloitte State of the Consumer Tracker
                      Coronavirus Impact Monitor – 26 February 2021                                                           Page 12                                                                                 Deloitte Economics © 2021
Consumer            Industrials              TMT              Energy &
                                                                Resources       Real Estate

Industry outlook: Industrials
The economic impact of the 2nd wave has been less severe compared to the first in spring 2020

Markets has taken a “breather” the recent month with new mutations haunting                                             Strong Eurozone manufacturing PMI driven by rising demand and prices
                                                                                Indexed share price as of:
250
                                                                                  25 Feb        27 Jan                                          February (flash)          58.5
                                                                                                                                                                                       The last four months have
                                                                                                                                                    January                59.2
200                                                                                188.3           204.5                                          December               57.1          seen the PMI remain
                                                                                   121.9           122.1                                          November               56.7          significantly higher
                                                                                                                                   US
                                                                                                                                                  October              53.4
150                                                                                117.3           115.9                                                                               compared to the initial
                                                                                                                                                 September             53.2
                                                                                   104.1              99.4                                         August              53.1            months of the pandemic in
100                                                                                                                                                July               50.9             spring 2020, suggesting
                                                                                                                                                                                       that the economic impact
 50
                                                                                                                                                February (flash)         57.7          of the second wave of
 1 jan 20         1 Apr 20          1 jul 20         1 Oct 20      1 jan 21
                                                                                                                                                   January              54.8           virus infections has until
            Industrials      Materials          Automotive         MSCI World                                                                     December              55.2
                                                                                                                                                                                       now been less severe
                                                                                                                                                 November              53.6
                                                                                                                            Eurozone
      The recent week we have all witnessed a minor correction in the market impacting                                                             October              54.8
      almost all industries                                                                                                                      September             53.7        IHS Markit Manufacturing PMI:
                                                                                                                                                  August              51.7         Index =50:           No change
      The automotive industry is heavily affected by the development in Tesla which is                                                              July              51.8         Index 50:           Expansion

                                                                                                   Trading multiples1

                   MSCI World Industrials Index                                                MSCI World Materials Index                                            MSCI World Automotive Index

          Historical averages                    Coronavirus impact                   Historical averages                 Coronavirus impact                   Historical averages               Coronavirus impact
             (EV/EBITDA)                            (EV/EBITDA)                          (EV/EBITDA)                         (EV/EBITDA)                          (EV/EBITDA)                       (EV/EBITDA)
                                                         +5.8x
                                                                                                                                +1.3x                                                                    +0.2x
                                                                19.6x
      11.9x       13.6x       13.9x                  13.8x                                    12.1x          12.1x         11.8x        13.1x
                                                                                  10.7x                                                                     9.7x     10.0x        10.5x            11.0x       11.2x

  10y avg.       5y avg.     3y avg.            Jan 1, 20 Current                10y avg.     5y avg.    3y avg.          Jan 1, 20 Current               10y avg.   5y avg.      3y avg.        Jan 1, 20 Current

   Since last update (28 January 2021) the EV/EBITDA                             Since last update (28 January 2021) the EV/EBITDA                         Since last update (28 January 2021) the EV/EBITDA
   multiple is up from 17.8x to 19.6x                                            multiple is down from 13.7x to 13.1x                                      multiple is down from 11.6x to 11.2x

Note:       1) Data as of 25 February 2021
Source:     Capital IQ; MSCI World Indices; IHS Markit; Bloomberg
Coronavirus Impact Monitor – 26 February 2021                                                                 Page 13                                                                         Deloitte Economics © 2021
Consumer            Industrials            TMT             Energy &
                                                             Resources           Real Estate

Industry outlook: TMT
TMT sectors have shown relative resilient to COVID-19, as the world has gone digital

                                                                                 Highlights from the industry (as of 25 Feb 2021)

140                                                                                                                                   TMT perceived as a defensive sector, which has less to lose from COVID-19
                                                                                                       131
130                                                                                                    126
                                                                                                       126
120                                                                                                                                Telecom: Spend among consumers is often within a contract; demand is up; need
                                                                                                       119
110                                                                                                                                is not discretionary (new cars) or constrained (leisure).
100
 90                                                                                                                                Media and Entertainment: Financial impact varies across sub-sectors. Media
 80                                                                                                                                consumption up (e.g., Netflix, Disney+), but willingness/ability to pay may be
 70                                                                                                                                constrained, as economic outlook exacerbates. Events (consumer, business)
 60                                                                                                                                mostly heavily restricted; cinemas, theatres, museums mostly closed. TV and
  1 Jan 20                                                                                     25 Feb 21                           movie production mostly halted. Theme parks mostly closed.
       Information Technology1          Communication Services1          Media and Entertainment1          MSCI World
                                                                                                                                   Technology: Some segments (e.g., robotics, communication software) seeing
      TMT companies are trading above the overall equity market.                                                                   record demand; digital transformation being accelerated; companies catering to
                                                                                                                                   SMEs may suffer from customer liquidity.
      Media and Entertainment quickly recovered after the shockwave on the stock market. As
      people stay home, the entertainment market is making records.2

                                                                                      Trading multiples and economic outlook
                                    Index: MSCI World Information Technology1                                                      Gartner expects the global IT spending in 2020 to decline with ~3% but rebound
              Historical averages (EV/EBITDA)                       Coronavirus impact (EV/EBITDA)                                 with a grow rate of ~6% in 2021
                                                                                 +9.0x
                                                                                                                                   Strong demand for supporting remote working and online education resulted in a
                           26.6x             28.4x                                        37.0x
          21.4x
                                                                                                                                   brighter outlook for segments such as PCs and tablets
                                                                         28.0x
                                                                                                                                   Meanwhile, boards of directors and CEOs brought forward spending to accelerate
                                                                                                                                   digital transformation efforts in 2020 and beyond
        10y avg.          5y avg.           3y avg.                  Jan 1, 2020         Current

Note:      1) MSCI World industry indices used (top 10 companies for sector indices), 01-01-2020 = index 100; 2) In EMEA and selected Asian countries, physical games sales are up by 63% according to GamesIndustry.biz.
Source:    S&P Capital IQ, Gartner (4Q20 Update)
Coronavirus Impact Monitor – 26 February 2021                                                                 Page 14                                                                                  Deloitte Economics © 2021
Consumer             Industrials         TMT                 Energy &
                                                               Resources              Real Estate

Industry outlook: Energy & Resources
Energy prices are starting to return to pre-crisis levels

                                                                                 Highlights from the industry (as of 26 February 2021)

250                                                                                                                         Hydropower generation

200
                                                                                                                            − Prior to COVID, electricity prices were already pressured in the Nordics due to
                                                                                                                              a warm winter, which increased the generation capacity of Norwegian
150                                                                                                                           hydropower plants.

100
                                                                                                                            − Further, the mild winter decreased demand for electricity.
                                                                                                                            Lockdown affects demand
 50
                                                                                                                            − The COVID lockdown negatively affected the demand of public institutions,
  0                                                                                                                           private individuals and corporations.
 1 jan 20        1 mar 20      1 maj 20   1 jul 20       1 Sep 20          1 Nov 20      1 jan 21     1 mar 21
                                                                                                                            Carbon market prices
               Natural gas TTF, spot      Coal API2, spot            Nordic electricity future, Q4-20                       − Lower emissions of CO2 and other greenhouse gasses led to a decrease in
                                                                                                                              carbon prices.
   Mild winter puts pressure on Nordic electricity prices prior to the corona crisis.
                                                                                                                            − Coal became cheaper, thereby lowering overall prices, as coal is marginally
   Electricity demand decreased marginally due to COVID lockdowns.
                                                                                                                              price setting. This created a self-enforcing effect, which drove down prices
   Significant drop in carbon emissions, resulting in lower prices.                                                           even further.

                                                                                                         Economic outlook

                                                 Selected futures                            +58.6%
                 -33.1%
                                                                                                                            Both coal and gas prices are above pre-COVID levels, however electricity prices are
                                                     -21.2%
                                                                                                                            still depressed, although returning to a normal level
            35                                 33                                                   38
                          23                                  26                          24                                Electricity producers continue to be impacted by COVID, but we see indications of
                                                                                                                            a normalisation of prices, led by the carbon market, which has seen significant
                                                                                                                            price increases over the last 10 months
        Nordic power, Q2-22                Nordic power, FY-22                            EUA, Mar-21
                                           Jan 1, 2020             Feb   25, 20211

Note:       1) As of end September for Nordic Power, Q4-20
Source:     Thomson Reuters Eikon
Coronavirus Impact Monitor – 26 February 2021                                                                    Page 15                                                              Deloitte Economics © 2021
Consumer                        Industrials            TMT          Energy &
                                                                      Resources          Real Estate

Industry outlook: Real Estate
Following record transaction volumes in Q4, total 2020 volumes grew by c. 20% compared to 2019

                                                                                        Highlights from the industry (as of 25 February 2021)
                          110                                                                                 0.6                                          General recovery from COVID-19, but uncertainties influence the industry
                          100                                                                                 0.3                                          − The industry as a whole is not as severely hit, as some would have expected a

                                                                                                                     Risk-free interest rate (%)
    (2 Jan 2020 = 100)
     Stock price index

                           90                                                                                 0.0                                            year ago, as especially residential, offices and logistics are doing well. However
                                                                                                                                                             retail and hotels remain struggling and have not started the recovery as
                           80                                                                                 -0.3
                                                                                                                                                             restrictions continue or are reinforced following the second wave.
                           70                                                                                 -0.6                                         − In addition, uncertainty remain about the potential change to taxation of
                           60                                                                                 -0.9                                           properties from 2023, and also the government has announced that the new
                                                                                                                                                             public valuation model of commercial properties will be postponed, leaving even
                           50                                                                                 -1.2
                                                                                                                                                             more uncertainty about real estate taxation.
                                                                                                                                                           M&A market increased by c. 20% in 2020 compared to 2019
                                    STOXX Real Estate Index               Denmark Government Bond - 10 year
                                                                                                                                                           − Despite a troublesome Q2, the first three quarters of 2020 were at about the
                                                                                                                                                             same level as 2019. However, Q4 set new records in transaction volumes and
                           The leading Real Estate Index has increased steadily since March and is now trading at a 10%-
                                                                                                                                                             2020 came out c. 20% above 2019 in transaction volumes.
                           15% discount compared to January.
                                                                                                                                                           − We believe the Danish real estate market, especially residentials, has proved
                           Interest rates are around pre-COVID-19 level, supporting the Real Estate M&A market with
                                                                                                                                                             itself resilient and a safe heaven for investors, which will attract even more
                           cheap financing.
                                                                                                                                                             international investors going forward. We believe that 2021 will be at 2020 level.

                                                                                                Trading multiples and economic outlook
                                                  Index: Custom weighted average index1                                                            Continuing the tendency from our previous update, price multiples for the selected industry
                         Historical averages (EV/EBITDA)                  Coronavirus impact (EV/EBITDA)                                           companies increasingly exceed pre-COVID-19 levels. However, despite the recovered price
                                                                                        +1.8x                                                      multiples, there are companies with substantial retail and hotel assets which still struggle.

                                         30.0x                               30.7x               32.4x                                             As interest rates may continue at a record-low level, Real Estate assets will continue to be an
                         27.6x                            28.5x
                                                                                                                                                   attractive asset class.

                                                                                                                                                   Private housing prices are expected to continue to increase in Q1 2021, which is supported
                                                                                                                                                   by continuous strong demand and historic low supply.
                    10y avg.            5y avg.           3y avg.          1 Jan 2020           Current

Note:                    1) Based on Colliers International, Patrizia AG, Agat Ejendomme A/S, Jeudan A/S, and Park Street Nordicom A/S
Source:                  Finans Danmark, Capital IQ, Colliers International, Danmarks Statistik, Konjunkturanalyse 2019, and Cushman Wakefield RED
Coronavirus Impact Monitor – 26 February 2021                                                                             Page 16                                                                                     Deloitte Economics © 2021
Industry outlook: Deloitte contacts
How Deloitte can help you
                                                                                      Consumer                       Energy & Resources
 •    Please use the contact details opposite to get in touch with our
      Financial Advisory industry group leaders and find out how we can          Mads Damborg                        Troels Ellemose Lorentzen
      assist you.                                                                Partner                             Partner
 •    We are well-positioned to assist in a range of tasks, such as those
                                                                                 Email: madsdamborg@deloitte.dk      Email: tlorentzen@deloitte.dk
      below.
                                                                                 Mobile: +45 30 93 54 81             Mobile: +45 30 93 56 90

                              Focus areas                                        Financial Services               Life Science & Health Care

                                                                                 Tore Stürmer Heyden                 Mads Damborg
                           State aid packages
                                                                                 Partner                             Partner
                                                                                 Email: theyden@deloitte.dk
                                                                                                                     Email: madsdamborg@deloitte.dk
                      Liquidity scenario analysis                                Mobile: +45 30 93 00 33
                                                                                                                     Mobile: +45 30 93 54 81

                 Debt covenant advice and financing                         Government & Public Services                       TMT

                                                                                 Rikke Beckmann Danielsen            Kasper Svold Maagaard
                   Business restructuring and M&A                                Partner                             Partner

                                                                                 Email: rdanielsen@deloitte.dk       Email: kmaagaard@deloitte.dk
                Bankable business plan development                               Mobile: +45 30 93 56 92             Mobile: +45 30 93 54 54

           Stakeholder management and process control                                 Industrials                        Real Estate

                                                                                 Niels Stoustrup                     Mads Skaarup
                          Impact assessment                                      Partner                             Partner

                                                                                 Email: nstoustrup@deloitte.dk       Email: maskaarup@deloitte.dk
                Economic modelling and forecasting                               Mobile: +45 30 93 59 15             Mobile: +45 61 67 90 50

Coronavirus Impact Monitor – 26 February 2021                               Page 17                                              Deloitte Economics © 2021
Appendices

                        Deloitte Government Response Portal             Page 19

Coronavirus Impact Monitor – 26 February 2021                 Page 18             Deloitte Economics © 2021
Deloitte Government Response Portal
Database of financial, tax, business and social measures announced by governments globally

 •    To aid our clients in navigating the complex landscape of COVID-19 assistance programmes, we have developed a free digital portal that captures the latest financial, tax,
      business and social measures enacted by country.

                                                                           Access the portal!

Coronavirus Impact Monitor – 26 February 2021                                         Page 19                                                               Deloitte Economics © 2021
This communication contains general information only, and none of Deloitte Touche Tohmatsu Limited (“DTTL”), its global network of member
firms or their related entities (collectively, the “Deloitte organization”) is, by means of this communication, rendering professional advice or
services. Before making any decision or taking any action that may affect your finances or your business, you should consult a qualified
professional adviser. No representations, warranties or undertakings (express or implied) are given as to the accuracy or completeness of the
information in this communication, and none of DTTL, its member firms, related entities, employees or agents shall be liable or responsible for
any loss or damage whatsoever arising directly or indirectly in connection with any person relying on this communication. DTTL and each of its
member firms, and their related entities, are legally separate and independent entities.
Deloitte is a leading global provider of audit and assurance, consulting, financial advisory, risk advisory, tax and related services. Our global
network of member firms and related entities in more than 150 countries and territories (collectively, the “Deloitte organization”) serves four out
of five Fortune Global 500® companies. Learn how Deloitte’s approximately 330,000 people make an impact that matters at www.deloitte.com.
Deloitte refers to one or more of Deloitte Touche Tohmatsu Limited (“DTTL”), its global network of member firms, and their related entities
(collectively, the “Deloitte organization”). DTTL (also referred to as “Deloitte Global”) and each of its member firms and related entities are legally
separate and independent entities, which cannot obligate or bind each other in respect of third parties. DTTL and each DTTL member firm and
related entity is liable only for its own acts and omissions, and not those of each other. DTTL does not provide services to clients. Please
seewww.deloitte.com/about to learn more.
© 2021 Deloitte Statsautoriseret Revisionspartnerselskab. For information, contact Deloitte Global.
You can also read