IMPACT OF METEOROLOGICAL PARAMETERS AND POPULATION DENSITY ON VARIANTS OF SARS-COV-2 AND OUTCOME OF COVID-19 PANDEMIC IN JAPAN
←
→
Page content transcription
If your browser does not render page correctly, please read the page content below
Epidemiology and Infection                           Impact of meteorological parameters and
        cambridge.org/hyg
                                                             population density on variants of SARS-CoV-2
                                                             and outcome of COVID-19 pandemic in Japan
                                                             Nadim Sharif1             , Shamsun Nahar Ahmed1, Rubayet Rayhan Opu1,
        Original Paper
                                                             Muktasid Ud Daullah1, Shahriar Khan1                           , Ali Azam Talukder1, Shoko Okitsu2,
        Cite this article: Sharif N et al (2021). Impact
        of meteorological parameters and population          Hiroshi Ushijima2, Ming Zhang3 and Shuvra Kanti Dey1
        density on variants of SARS-CoV-2 and
                                                             1
        outcome of COVID-19 pandemic in Japan.                Department of Microbiology, Jahangirnagar University, Savar, Dhaka 1342, Bangladesh; 2Division of Microbiology,
        Epidemiology and Infection 149, e103, 1–16.          Department of Pathology and Microbiology, Nihon University, Tokyo, Japan and 3Department of Epidemiology
        https://doi.org/10.1017/S095026882100100X
                                                             and Biostatistics, College of Public Health, University of Georgia, Athens, GA, USA
        Received: 2 March 2021
        Revised: 16 April 2021                                   Abstract
        Accepted: 21 April 2021
                                                                 Although vaccines have become available, emergence and rapid transmission of new variants
        Key words:                                               have added new paradigm in the coronavirus disease-2019 (COVID-19) pandemic. Weather,
        Cluster mutations; COVID-19; Japan;                      population and host immunity have been detected as the regulatory elements of COVID-19.
        population density; variants; weather                    This study aims to investigate the effects of weather, population and host factors on the out-
        Author for correspondence:                               come of COVID-19 and mutation frequency in Japan. Data were collected during January
        Shuvra Kanti Dey,                                        2020 to February 2021. About 92% isolates were form GR clades. Variants 501Y.V1 (53%)
        E-mail: shuvradey@yahoo.com                              and 452R.V1 (24%) were most prevalent in Japan. The strongest correlation was detected
                                                                 between fatalities and population density (rs = 0.81) followed by total population (rs = 0.72).
                                                                 Relative humidity had the highest correlation (rs = −0.71) with the case fatality rate. Cluster
                                                                 mutations namely N501Y (45%), E484K (30%), N439K (16%), K417N (6%) and T478I
                                                                 (3%) at spike protein have increased during January to February 2021. Above 90% fatality
                                                                 was detected in patients aged >60 years. The ratio of male to female patients of COVID-19
                                                                 was 1.35:1. This study will help to understand the seasonality of COVID-19 and impact of
                                                                 weather on the outcome which will add knowledge to reduce the health burden of
                                                                 COVID-19 by the international organisations and policy makers.

                                                             Introduction
                                                             The ongoing pandemic namely, coronavirus disease-2019 (COVID-19) has been triggered by the
                                                             infection of a novel species of coronavirus (named 2019-novel coronavirus, 2019-nCoV) called
                                                             severe acute respiratory syndrome coronavirus-2 (SARS-CoV-2) of genera Betacoronavirus, family
                                                             Coronaviridae [1–3]. Human coronavirus 229E and OC43 were the first members of
                                                             Coronaviridae detected in patients with the symptoms of respiratory system infection and com-
                                                             mon cold during early 1960s [4]. Other members of the same genus Coronavirus namely,
                                                             SARS-CoV, HCoV NL63, HKU1 and MERS-CoV had caused local outbreaks with human
                                                             respiratory system infections in 2003, 2004, 2005 and 2012, respectively [1–5]. Among corona-
                                                             viruses, only SARS-CoV-2 has caused a severe and global pandemic [1–5].
                                                                 SARS-CoV-2 is a positive sense, non-segmented single-stranded RNA (ssRNA) virus with a
                                                             genome of ∼30 000 bases [1, 6]. The genome is consisted of a 5′ cap structure, 10 open-reading
                                                             frames (ORFs) namely, 1a, 1b, 3a, 3b, 6, 7a, 7b, 8a, 8b and 9b along with a 3′ poly (A) tail
                                                             [7–9]. First two ORFs from 5′ end namely ORF-1ab comprise of ∼20 000 bases and encode
                                                             for non-structural proteins (nsps) (replicase proteins). About 16 nsps (nsp1–nsp16) and
                                                             four major structural proteins – spike (S), envelope (E), membrane (M) and nucleocapsid
                                                             (N) have been identified and characterised [7–11]. Major structural proteins of
                                                             SARS-CoV-2 are encoded by the later ORFs of 3′ end (∼10 000 bases) [1, 2, 7–11].
                                                                 Various clinical manifestations have been reported from patients infected with COVID-19
        © The Author(s), 2021. Published by                  [1, 5]. The clinical manifestations can be characterised into serve, mild and asymptomatic
        Cambridge University Press. This is an Open          according to the duration and health outcome [1, 5, 12]. About 65% patients are asymptomatic
        Access article, distributed under the terms of
                                                             [12–14]. Among the symptomatic patients about 80–85% develop mild symptoms [1, 12–16].
        the Creative Commons Attribution licence
        (http://creativecommons.org/licenses/by/4.0/),       In mild cases, fever, cough and sore throat are the most common clinical features followed by
        which permits unrestricted re-use,                   chill, feelings of shaking, loss of taste or smell, headache, rash and muscle pain. Asymptomatic
        distribution, and reproduction in any medium,        patients and patients with mild symptoms have a good recovery rate [1, 5, 15, 16]. Clinical
        provided the original work is properly cited.        manifestations including acute pneumonia, acute respiratory syndrome, kidney failure, diffi-
                                                             culty in breathing and failure of multiple organs have been reported in severe cases [12–16].
                                                                 The first confirmed case of COVID-19 was reported from Wuhan, China in December
                                                             2019 [1]. As of 15 February 2021, about 110 million cases and 2.5 million fatalities of
                                                             COVID-19 have been confirmed from more than 221 countries and territories globally [17, 18].

Downloaded from https://www.cambridge.org/core. IP address: 46.4.80.155, on 16 Aug 2021 at 11:22:51, subject to the Cambridge Core terms of use, available at https://www.cambridge.org/core/terms
. https://doi.org/10.1017/S095026882100100X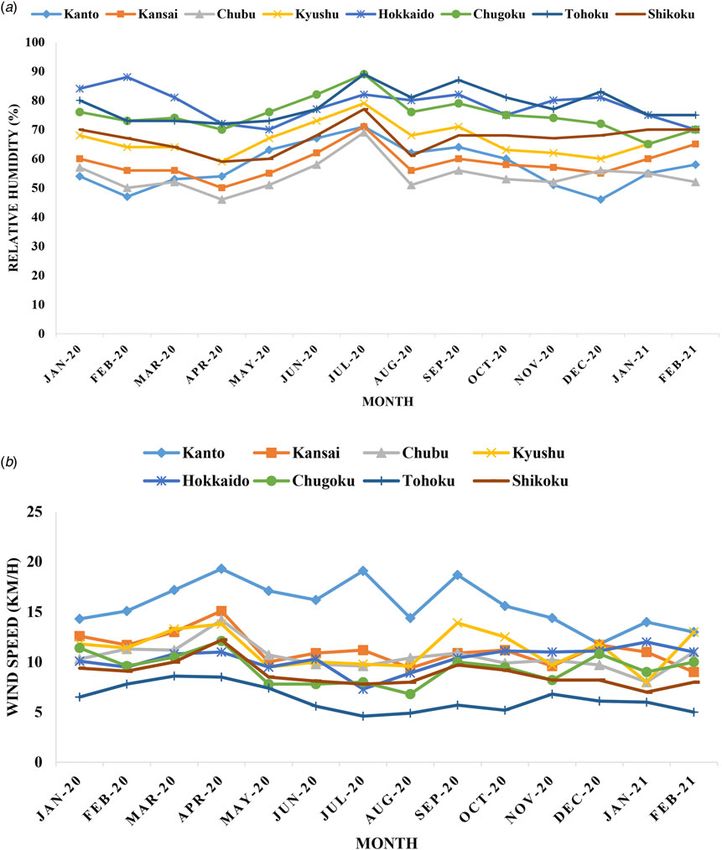
2                                                                                                                                                      Nadim Sharif et al.

       Fig. 1. (a) Map of spatial distribution of COVID-19 cases
       and fatalities in eight regions in Japan during January
       2020 to February 2021 and (b) monthly distribution of
       total cases and fatalities of COVID-19 in Japan.

       A sudden increase of COVID-19 cases, fatalities and transmission                          Japan. The case fatality rate has remained 18 persons per
       has been detected from October 2020 [17]. The first COVID-19                              thousand people during the first and second waves in Japan
       case was confirmed in January 2020 in Japan [19, 20]. As of 21                            [17, 20]. Among 47 prefectures, Tokyo (∼100 000 cases, 25%)
       February 2021, about 400 000 cases and 7000 casualties associated                         had the highest number of cases followed by Osaka (∼40 000
       with COVID-19 have been detected in Japan [17–21]. About 80%                              cases, 10%), Kanagawa (39 000 cases, 10%), Saitama (25 000
       cases and fatalities have been detected after 15 October 2020 in                          cases, 6%), Chiba (22 000 cases, 6%), Aichi (17 000 cases, 4%),

Downloaded from https://www.cambridge.org/core. IP address: 46.4.80.155, on 16 Aug 2021 at 11:22:51, subject to the Cambridge Core terms of use, available at https://www.cambridge.org/core/terms
. https://doi.org/10.1017/S095026882100100X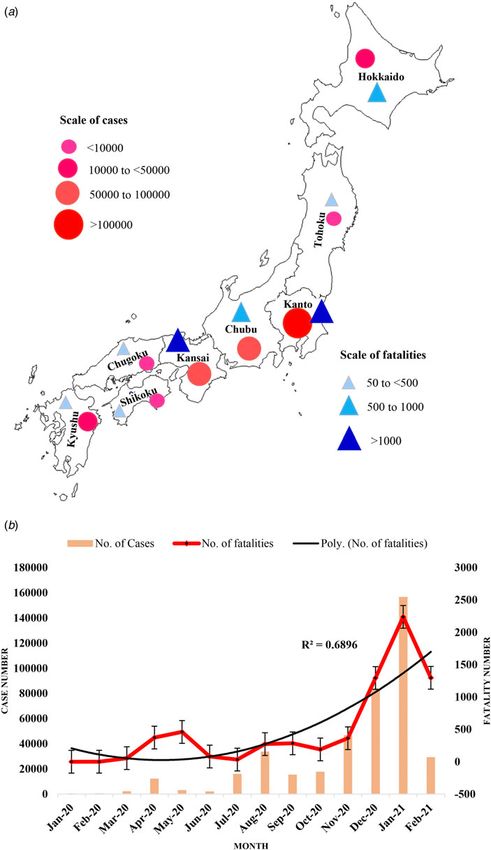
Epidemiology and Infection                                                                                                                                                     3

        Table 1. Distribution of COVID-19 cases, fatalities, case fatality rate and death         Table 2. Trends of total COVID-19 cases, fatalities and case fatality rate in the
        rate in eight different regions in Japan                                                  top 20 prefectures in Japan

                          No. of       No. of       Case fatality rate    Death rate per                                No. of total        No. of total          Case fatality rate
           Regions        cases       fatalities    per 10 000 cases     100 000 persons             Prefecture            cases             fatalities           per 10 000 cases

           Kanto         215 000        1726                80                    4                  Tokyo                100 302                891                      89
           Kansai          77 000       1740               226                    8                  Osaka                  43 901               930                     212
           Chubu           57 100         781              137                    4                  Kanagawa               41 035               482                     117
           Kyushu          33 500         496              148                    3                  Saitama                25 384               359                     141
           Hokkaido        17 514         550              314                   10                  Aichi                  24 126               402                     167
           Chugoku          8170          141              173                    2                  Chiba                  22 518               254                     133
           Tohoku           3400          133              391                    1                  Hokkaido               17 514               607                     347
           Shikoku          2700           55              204                    1                  Hoyogo                 16 580               412                     248
                                                                                                     Fukuoka                16 247               192                     118
                                                                                                     Kyoto                   8510                122                     143
        Hokkaido (16 000 cases, 4%) and Hyogo (15 000 cases, 4%),
        respectively. Population density of Japan is 900 persons/mi2                                 Hiroshima               4828                 92                     191
        with a collective population of about 126 000 000. As of 15                                  Shizuoka                4608                 77                     167
        February 2021, a total of ∼7 800 000 tests have been recorded
                                                                                                     Tochigi                 3775                 48                     127
        with 5.3% positive incidence [17, 18, 20].
            The spread of COVID-19 is significantly affected by weather                              Miyagi                  3457                 22                      64
        [21]. Meteorological parameters including relative humidity                                  Okayama                 2345                 23                      98
        (RH), ultraviolet (UV) intensity, wind velocity, ambient tempera-
                                                                                                     Nagano                  2290                 35                     153
        ture, rain fall and snowfall have contributed significantly to shape
        the wave of COVID-19 pandemic [22–25]. Weather parameters                                    Shiga                   2132                 31                     145
        regulated the viability, and transmission of COVID-19 [21–24].                               Fukushima               1735                 45                     259
        Furthermore, total population, density of population, duration
                                                                                                     Nagasaki                1530                 28                     183
        of lockdown, tendency of common people to maintain social dis-
        tance and COVID-19-related health practices, movement fre-                                   Yamagata                  510                13                     255
        quency, transportation of infected persons across borders,
        gatherings during sports, social and religious events etc. have con-
        tributed significantly to the spread of COVID-19 [22–28].                                 Tohoku (35°82′ N to 139°57′ E), Kanto (36°45′ N to 139°69′ E),
            Mutation at receptor binding sites (RBDs) of spike protein is                         Chubu (35°1′ N to 136°53′ E), Kansai (34°6′ N to 135°5′ E),
        mainly involved in the origin of recent variants of SARS-CoV-2                            Chugoku (35°8′ N to 104°1′ E), Shikoku (33°7′ N to 133°6′ E) and
        [29–31]. Deletion, indels and cluster of substitution point muta-                         Kyushu (32°5′ N to 130°8′ E) with 47 prefectures were included
        tions at RBDs influence the origination of escape variants with                           in this study. This study was conducted during February 2020
        a high growth rate. Numerous parameters of host and weather                               to February 2021.
        influence the mutational events [30–32]. Inside host body, the
        immune system, presence of coinfection and antiviral drug pres-
        sure are shaping mutations in coronavirus genome. Besides, para-                          Study data collection and data availability
        meters of weather specifically UV radiation, high ambient
        temperature, RH and snowfall have regulatory roles in evolving                            The data regarding the COVID-19 pandemic were retrieved by
        mutant viruses [22–25].                                                                   using an unbiased approach from official databases of Japan
            The principal objective of this study is to investigate the impact                    Government (https://www.mhlw.go.jp/stf/seisakunitsuite/bunya/
        of regulatory factors specially, weather on mutation frequency in                         0000164708_00079.html), COVID-19 information and resources
        SARS-CoV-2 in Japan. Other objectives of this study are to specify                        (https://corona.go.jp/en/) and coronavirus situation report in Japan
        the relationship between mutations at RBDs and host factors, and                          (https://toyokeizai.net/sp/visual/tko/covid19/en.html). Collected data
        to determine the impact of weather on the outcome of COVID-19                             were cross-matched by analysing the COVID-19 data form
        pandemic in Japan. We also analysed the impact of population                              Word Health Organization (https://www.who.int/emergencies/
        density, social gatherings and lockdown on the incidence and cas-                         diseases/novel-coronavirus-2019), Worldometers (www.world
        ualties in Japan. This study will create a better understanding of                        ometers.info/coronavirus/) and COVID-19 dashboard by Johns
        the effects of various regulatory factors on mutations of                                 Hopkins University (https://coronavirus.jhu.edu/map.html).
        SARS-CoV-2 and outcome of COVID-19 in Japan.                                                  Weather data including maximum temperature (°C), average
                                                                                                  temperature (°C), minimum temperature (°C), UV index, snow-
                                                                                                  fall, precipitation, wind velocity (km/h), rain fall (mm) and RH (%)
        Materials and methods                                                                     were retrieved from Japan Meteorological Agency (https://www.
                                                                                                  jma.go.jp/jma/indexe.html) and weather underground (https://
        Study regions and time period
                                                                                                  www.wunderground.com/global/JP.html). The collected meteoro-
        This study determined the impact of weather on COVID-19 in                                logical data were cross-checked with the data from AccuWeather
        Japan. Eight regions in Japan namely, Hokkaido (44°N to 143°E),                           (www.accuweather.com), meteoblue (www.meteoblue.com) and

Downloaded from https://www.cambridge.org/core. IP address: 46.4.80.155, on 16 Aug 2021 at 11:22:51, subject to the Cambridge Core terms of use, available at https://www.cambridge.org/core/terms
. https://doi.org/10.1017/S095026882100100X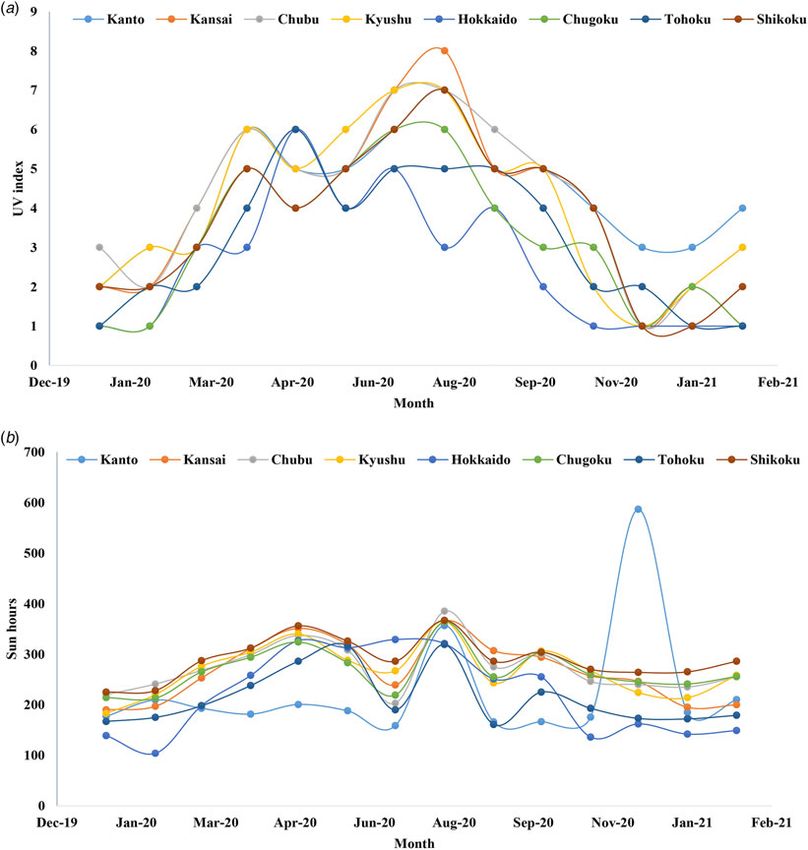
4                                                                                                                                                      Nadim Sharif et al.

       Fig. 2. Monthly distribution of minimum temperature (min temp), average temperature (avg temp) and maximum temperature (max temp) in (a) Kanto; (b) Kansai;
       (c) Chubu; (d) Kyushu; (e) Hokkaido; (f) Chugoku; (g) Tohoku and (h) Shikoku during January 2020 to February 2021 in Japan.

       Yahoo Japan (https://weather.yahoo.co.jp/weather/) in this study.                         sequences of Japanese SARS-CoV-2 isolates multiple sequence
       SARS-CoV-2 whole genome analysis was conducted using reference                            alignment was performed by operating ClustalW Multiple
       genome sequences from the website of GISAID (https://www.gisaid.                          Alignment algorithm in BioEdit 7.2.6 software. Clades were
       org/) [33]. Data on the occurrence of gatherings, social and religious                    defined according to the presence of specific markers following
       events, sports events and lockdown were collected from the govern-                        the GISAID system [33]. Nucleotide and peptide sequences of
       ment of Japan website (https://www.japan.go.jp/) and Japan govern-                        whole genome of the selected isolates were analysed by using
       ment news (https://www.japan.go.jp/kizuna/).                                              MEGA X to determine deletion, indels and substitution point
                                                                                                 mutations [9, 22].

       Whole genome and mutational analysis of SARS-CoV-2
       variants                                                                                  Statistical analysis
       The whole genome sequences of SARS-CoV-2 variants in Japan                                All data were sorted and analysed using unbiased statistical
       were analysed using Chromas 2.6.5 (Technelysium, Helensvale,                              approaches. Appropriate correlation analysis was performed to
       Australia). Sequence homology of the selected whole genomes                               determine the association between two variables by using a mono-
       was deduced by using the nucleotide BLASTn program of                                     tonic function of Spearman’s rank correlation coefficient (rs) [22].
       NCBI (https://blast.ncbi.nlm.nih.gov/Blast.cgi). Using the refer-                         The Spearman’s rank correlation coefficients (rs) were calculated
       ence strains (NC_045512/Wuhan-Hu-1) and whole genome                                      between weather factors and cases as well as weather factors

Downloaded from https://www.cambridge.org/core. IP address: 46.4.80.155, on 16 Aug 2021 at 11:22:51, subject to the Cambridge Core terms of use, available at https://www.cambridge.org/core/terms
. https://doi.org/10.1017/S095026882100100X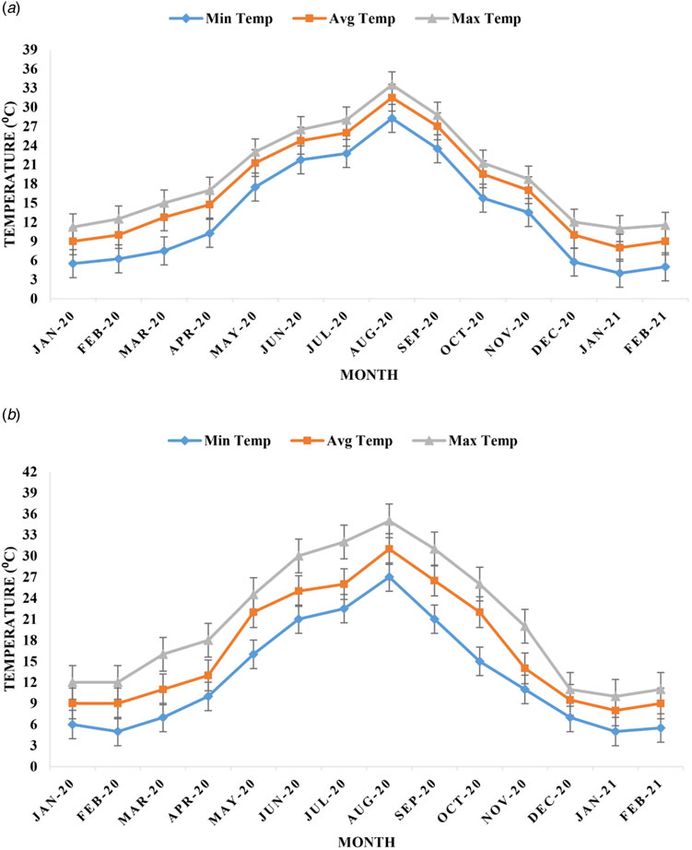
Epidemiology and Infection                                                                                                                                                    5

                                                                                                                                Fig. 2. Continued.

        and casualties [22, 25]. Furthermore, associations between host                           in Japan. All of the 47 prefectures in eight regions have been
        factors and mutation frequency, weather parameters and muta-                              hit by the second wave of COVID-19. Kanto is burdened with
        tional events of SARS-CoV-2 were also determined by using the                             the highest number of cases (215 000), whereas Kansai has the
        Spearman’s rank correlation coefficient (rs). The below equation                          most number of fatalities (about 1800) (Table 1). The
        is used to calculate the coefficient in this study:                                       number of cases in Kanto is followed by Kansai (∼77 000),
                                                                                                 Chubu (∼57 000), Kyushu (∼34 000) and Hokkaido (∼18 000),
                                                        di2                                       respectively (Table 1). Twenty prefectures burdened with the
                                     rs = 1 − 6                                                   most number of cases and fatalities have been studied. The highest
                                                   n(n2 − 1)
                                                                                                  number of cases was detected in Tokyo (∼100 000) followed by
        Here, ‘n’ represents the number of observations, ‘di’ represents the                      Osaka (∼44 000) and other prefectures. The highest number of
        difference between the ranks of observations and rs represents the                        fatality was found in Osaka (∼1000), whereas Hokkaido had the
        Spearman’s correlation coefficient.                                                       highest case fatality rate (Table 2).

                                                                                                  Analysis of factors of weather
        Results
                                                                                                  Amid parameters of weather, temperature, UV ray intensity, RH,
        Temporal and spatial distribution of COVID-19 cases and
                                                                                                  rainfall, snowfall, wind speed, atmospheric pressure and sun
        fatalities
                                                                                                  hours were analysed for their role in COVID-19. Three tempera-
        A sharp increase in both cases and fatalities of COVID-19 has                             tures were documented during January 2020 to February 2021.
        been detected after October 2020 in Japan. About 75% of cases                             The mean of maximum temperature was about 15 °C, and ranged
        and fatalities have occurred during October 2020 to February                              from −3 to 41 °C in eight regions in Japan. The mean of average
        2021 (Fig. 1a and b). Although the cases and casualties have                              temperature was 13 °C and minimum temperature was 8 °C in
        increased, the case fatality rate has remained constant near 1.8                          Japan during the last 14 months of COVID-19 pandemic

Downloaded from https://www.cambridge.org/core. IP address: 46.4.80.155, on 16 Aug 2021 at 11:22:51, subject to the Cambridge Core terms of use, available at https://www.cambridge.org/core/terms
. https://doi.org/10.1017/S095026882100100X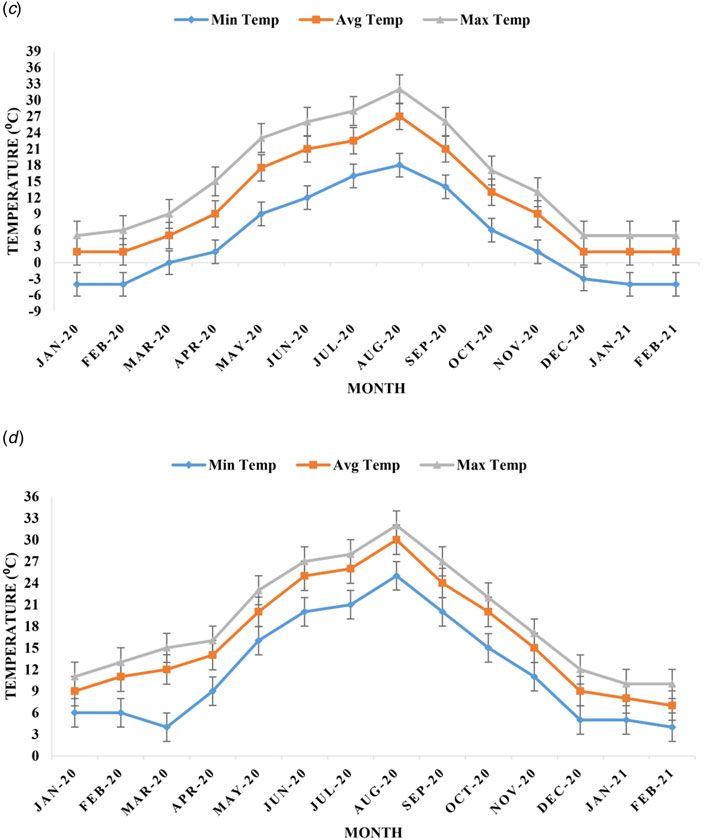
6                                                                                                                                                      Nadim Sharif et al.

       Fig. 2. Continued.

       (Fig. 2a–h). The mean values of minimum, maximum and aver-                                Japan. The highest rainfall was detected in Hokkaido during
       age temperature varied ±6 °C in eight regions. The lowest tem-                            February 2020 and 2021.
       perature was detected in Hokkaido (−16°C) in February 2020.                                  RH, wind speed and atmospheric pressure are also significant
       A peak of three temperatures in eight regions was confined in                             factors of weather related to COVID-19. Average RH ranged from
       August 2020 in Japan. Temperature started to decrease and                                 45% to 90% during January 2020 to February 2021 in Japan
       both cases and fatalities of COVID-19 started to increase from                            (Fig. 5a and b). The highest value of RH was recorded in
       September 2020.                                                                           Chugoku (90%) and Tohoku (90%) in July 2020, followed by
          Sun hours or the amount of day light duration and UV ray                               Hokkaido (85%) in February 2020. A peak of average RH for
       intensity are important weather factors that regulate the spread                          eight regions in Japan was detected in July 2020. The highest aver-
       and mutations of SARS-CoV-2. The lowest average UV intensity                              age RH was detected in Hokkaido (80%) followed by Chugoku
       was 1 in Hokkaido during January 2021. The highest average                                (78%) and Tohoku (77%), respectively. Atmospheric pressure var-
       UV intensity was 9 in Kansai during July 2020 (Fig. 3a). The                              ied around 1 atm during the pandemic in Japan.
       average value of UV intensity ranged from 1 to 9 during the                                  Velocity of wind was recorded and analysed. The average
       COVID-19 pandemic. One peak of average UV intensity was                                   wind speed per month was detected between 4 and 20 km/h in
       confined during April 2020 and another one during August                                  Japan. The highest average wind speed was detected in Kanto
       2020. After August 2020, UV index declined while the cases                                (16 km/h) followed by Kyushu (13 km/h) and Kansai (12 km/h),
       and fatalities increased. The sun hours ranged from 95 to 600 h                           respectively (Fig. 5a and b). The growth rate of cases in Kansai
       per month. A peak of the sun hours was also detected in                                   was the highest. The lowest average wind speed was detected in
       August 2020 (Fig. 3b).                                                                    Tohoku during the COVID-19 pandemic.
          The amount of rainfall and snowfall were also analysed in this                            The total population and population density of eight regions in
       study. The highest rainfall was detected in Kyushu (690 mm)                               japan were also analysed. Kanto (43.4 million) had the highest
       in July 2020 followed by Chugoku (580 mm) and Tohoku                                      number of total population followed by Kansai (22.6 million),
       (420 mm) (Fig. 4). Snowfall was not persistent in eight regions.                          Chubu (21.4 million), Kyushu (14.5 million), Tohoku (8.9 mil-
       Only seasonal snowfall was recorded in most of the regions in                             lion), Chugoku (7.3 million), Hokkaido (5.4 million) and

Downloaded from https://www.cambridge.org/core. IP address: 46.4.80.155, on 16 Aug 2021 at 11:22:51, subject to the Cambridge Core terms of use, available at https://www.cambridge.org/core/terms
. https://doi.org/10.1017/S095026882100100X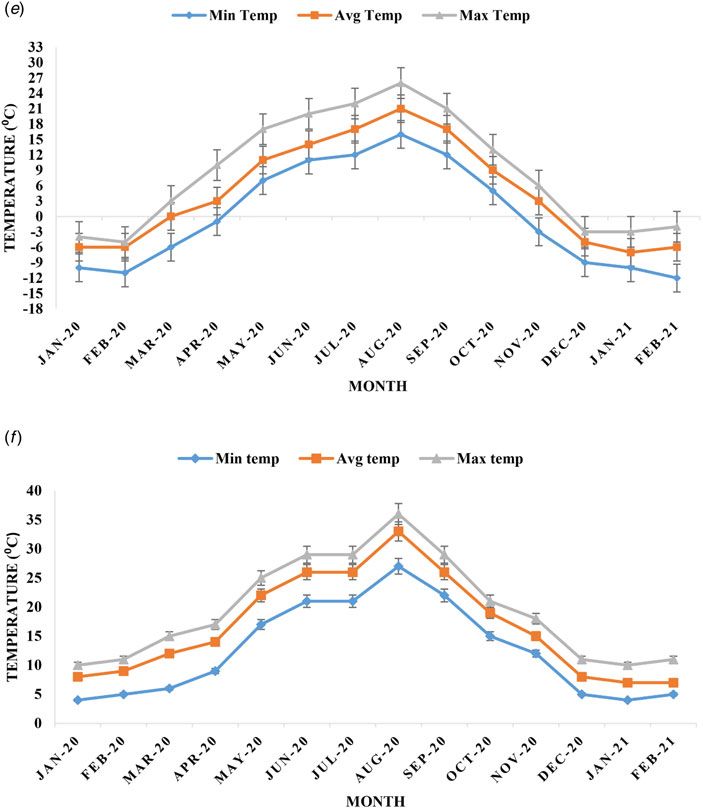
Epidemiology and Infection                                                                                                                                                    7

                                                                                                                                Fig. 2. Continued.

        Shikoku (3.8 million), respectively. Kanto (1300 persons/km2) was                         (rs = −0.47), respectively. Both the total population (rs = 0.59)
        the most densely populated region followed by Kansai (690 per-                            and population density (rs = 0.47) were strongly correlated with
        sons/km2), Chubu (320 persons/km2), Kyushu (307 persons/                                  the increase of cases (Table 3). The cumulative fatalities had the
        km2), Chugoku (240 persons/km2), Shikoku (204 persons/km2),                               highest correlation with population density (rs = 0.81) followed
        Tohoku (130 persons/km2) and Hokkaido (63 persons/km2),                                   by total population (rs = 0.72), RH (rs = −0.59) and minimum
        respectively. Tokyo is the capital and centre of most of the inter-                       temperature (rs = −0.54) on the day, respectively. The highest cor-
        national flights and transportation in Japan. The health burden of                        relation of case fatality rate was detected with RH (rs = −0.71) and
        COVID-19 was also highest in Tokyo and Kanto.                                             sun hours (rs = −0.54) on the day. The growth rate of cases had
                                                                                                  also significant association with population density (rs = 0.51)
                                                                                                  and total population (rs = 0.43) (Table 3)
        Correlation analysis between weather and COVID-19 pandemic
                                                                                                      First, the correlation between maximum temperature and the
        in Japan
                                                                                                  number of total cases in each city was evaluated. Similarly, the
        The impact of factors of weather on the outcome of COVID-19                               correlation between minimum temperature and total cases, aver-
        was determined by Spearman’s correlation analysis. Twelve fac-                            age temperature and total cases were determined. Besides, corre-
        tors of weather were considered on three time frames, namely                              lations among three temperatures with total fatalities in each city
        on the day of the incidence, 7 days after and 14 days after the inci-                     were also determined. The average temperature on the day of the
        dence in this study. Four parameters of COVID-19 namely, cases,                           cases had the highest correlation (rs = −0.675), followed by aver-
        fatalities, case fatality rate and growth rate were defined as the out-                   age temperature 7 days ago (rs = −0.547), maximum temperature
        come of the pandemic. The Spearman’s rank correlation was cal-                            on the day (rs = −0.512) and minimum temperature on the day
        culated between each factor of weather and outcome of                                     (rs = −0.486). Maximum temperature on the day had the highest
        COVID-19. Minimum temperature (min temp) on the day of                                    correlation with total fatalities (rs = −0.611). The correlation
        the cases had the highest correlation with the cases (rs = −0.55)                         between temperature and COVID-19 cases and fatalities were
        followed by average temperature (avg temp) on the day (rs =                               negative, which indicated that at lower temperature the number
        −0.51), sun hours on the day (rs = −0.49) and RH on the day                               of cases and fatalities increased. Among the factors of weather,

Downloaded from https://www.cambridge.org/core. IP address: 46.4.80.155, on 16 Aug 2021 at 11:22:51, subject to the Cambridge Core terms of use, available at https://www.cambridge.org/core/terms
. https://doi.org/10.1017/S095026882100100X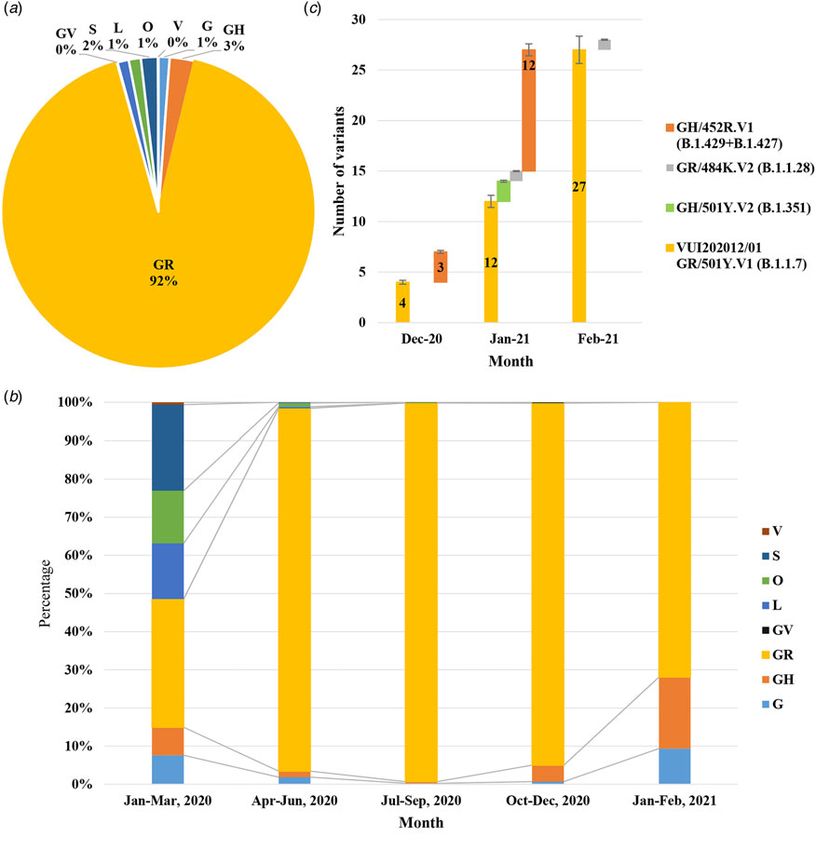
8                                                                                                                                                      Nadim Sharif et al.

       Fig. 3. Distribution of average (a) UV index and (b) sun hours per month in Japan.

       Fig. 4. Monthly trends of average rainfall in Japan during the COVID-19 pandemic.

Downloaded from https://www.cambridge.org/core. IP address: 46.4.80.155, on 16 Aug 2021 at 11:22:51, subject to the Cambridge Core terms of use, available at https://www.cambridge.org/core/terms
. https://doi.org/10.1017/S095026882100100X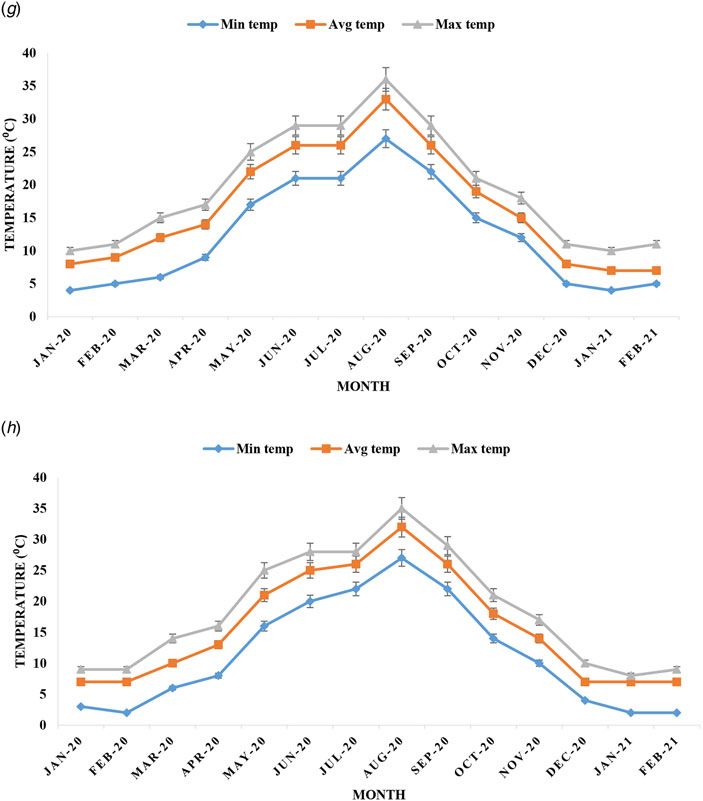
Epidemiology and Infection                                                                                                                                                    9

        Fig. 5. Distribution of average (a) RH and (b) wind speed in eight regions in Japan.

        snowfall and atmospheric pressure were not significantly related                          transmission rate and immune escape capability were also
        to COVID-19 in Japan.                                                                     detected in Japan during December 2020 to February 2021.
                                                                                                  Variant 501Y.V1 was prevalent (43 isolates) followed by
                                                                                                  452R.V1 (16 isolates) (Fig. 6a–c).
        SARS-CoV-2 clade and variant distributions during the
        COVID-19 pandemic
                                                                                                  Distribution of frequency of mutations, age and genders in
        About 16 000 full genomes of COVID-19 were analysed from
                                                                                                  patients with COVID-19
        Japan. Temporal distribution of clade and variant were deter-
        mined. Clade GR (92%) was the most frequent followed by GH                                Isolates containing various substitution points and deletion muta-
        (3%), S (2%), L (1%), O (1%) and G (1%), respectively                                     tions were detected in Japan. About 16 000 whole genome from
        (Fig. 6a–c). The frequency of G and GH increased during                                   Japan were analysed for mutation frequency. Mutations were
        January to February 2021. The highest frequency of GR was                                 detected throughout the whole genome of isolates in Japan.
        also detected during January to February 2021 (45%) followed                              Deletions at both the 5′ UTR and 3′ UTR were common. At
        by October to December 2020 (35%). Variants with high                                     spike protein, D614G was detected in about 100% isolates.

Downloaded from https://www.cambridge.org/core. IP address: 46.4.80.155, on 16 Aug 2021 at 11:22:51, subject to the Cambridge Core terms of use, available at https://www.cambridge.org/core/terms
. https://doi.org/10.1017/S095026882100100X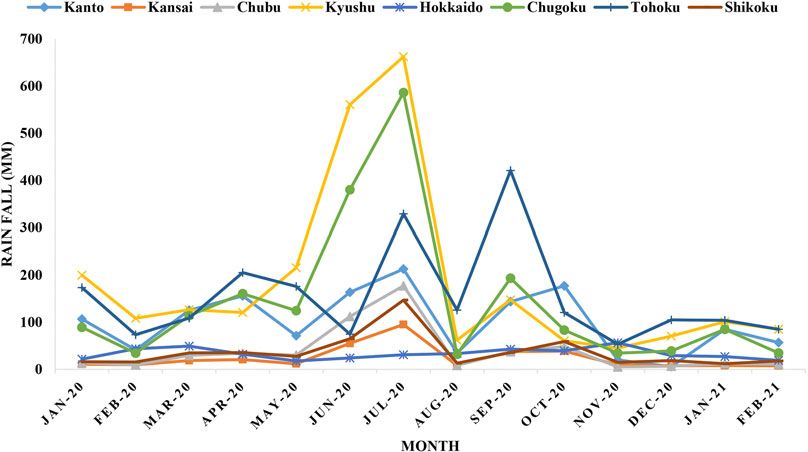
10 Nadim Sharif et al.
Table 3. Spearman’s correlation analysis of parameters of weather and outcome of COVID-19 pandemic in Japan
Environmental factors COVID-19 cases COVID-19 fatalities Case fatality rate Growth rate
Max temp on the day −0.12 −0.21* −0.01 −0.001
Max temp 7 days ago −0.01 −0.12* −0.001 −0.04
Max temp 14 days ago −0.14 −0.09 −0.2* −0.008
Avg temp on the day −0.51*** −0.27** −0.14 −0.12
Avg temp 7 days ago −0.32* −0.19 −0.19* −0.14
Avg temp 14 days ago −0.24 −0.17 −0.21 −0.28**
Min temp on the day −0.55** −0.54* −0.05 −0.07
Min temp 7 days ago −0.14 −0.38* −0.009 −0.02
Min temp 14 days ago −0.21 −0.06 −0.02* −0.005
UV index on the day −0.42* −0.22** −0.34* –
UV index 7 days ago −0.31* −0.08 −0.39* −0.006
UV index 14 days ago −0.11 −0.001 −0.41 −0.002
Sun hours on the day −0.49** −0.31 −0.54 −0.41
Sun hours 7 days ago −0.35 −0.30 −0.39 −0.31*
Sun hours 14 days ago −0.33 −0.09 −0.14 −0.12
RH on the day −0.47 −0.59* −0.71 −0.31
RH 7 days ago −0.40 −0.46 −0.42* −0.18
RH 14 days ago −0.41 −0.41** −0.37 −0.004
Rainfall on the day −0.02* −0.27 −0.04* −0.0004
Rainfall 7 days ago 0.003 −0.01 0.31 0.002
Rainfall 14 days ago −0.0002 −0.0001 −0.21 −0.34
Wind speed on the day 0.27* 0.12** 0.39* 0.14*
Wind speed 7 days ago 0.14* 0.01* 0.27* 0.10*
Wind speed 14 days ago 0.13 0.0009 0.19 0.09
Total population 0.59** 0.72* 0.48** 0.43**
Population density 0.47* 0.81* 0.34* 0.51*
**, * stand for 1% and 5% levels of significance.
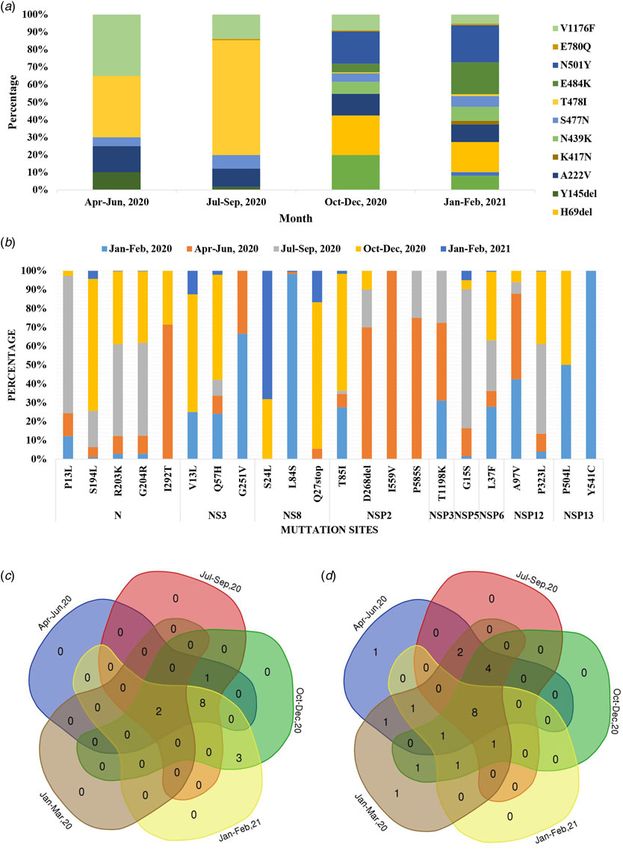
Substitution mutation, T478I (55%) at spike protein were pre- aged above 80 years (65%), followed by the age group 60–79 years
dominant during April 2020 to September 2020 (Fig. 7a–d). (32%) (Fig. 8a and b).
However, during the second wave starting from October 2020
substitution point mutations E780Q, K417N, T478I, N501Y,
Correlation analysis between mutation frequency and weather
E484K, N439K, V1176F, S477N and A222V became common at
parameters
spike protein in the isolates in Japan (Fig. 7a–d).
Deletion and substitution mutations at nucleocapsid (N) and Novel coronavirus has acquired frequent mutations throughout
other nsps were also frequent in Japanese isolates. Although sub- the genome. The correlation between weather and mutation fre-
stitution mutations, R203K, G204R at nucleocapsid and P323L at quency as well as host factors and mutation frequency were deter-
NSP12 were detected in ∼90% of the isolates in Japan, the fre- mined for the isolates of Japan by Spearman’s correlation analysis
quency reduced during January to February 2021. Among 22 (Tables 4 and 5). Point mutation at RBDs namely, Y145del had
point mutations at N and other eight non-structural proteins, strong correlation with maximum temperature (rs = 0.61), snow
eight namely, N_S194L, N_R203K, N_G204R, NS3_Q57H, fall (rs = 0.41), N501Y with maximum temperature (rs = 0.46)
NSP2_T85I, NSP5_G15S, NSP6_L37F and NSP12_P323L were and sun hours (rs = 0.49), N439K with minimum temperature
persistent throughout the COVID-19 pandemic in Japan (rs = 0.43), A222V with sun hours (rs = 0.51), E484K with sun
(Fig. 7a–d). hours (rs = 0.53), T478I with RH (rs = 0.49) and E780Q with
Both the gender and age distribution of patients with RH (rs = 0.43). The highest correlation between mutations of
COVID-19 in Japan were analysed. The ratio of male to female nucleocapsid protein and weather was detected for N_I292T
patients was 1.35:1 in Japan. However, female was predominant and UV (rs = 0.68), followed by snowfall (rs = 0.67) and rainfall
in the age group of 20–39 years and above 80 years (Fig. 8a (rs = 0.61). Significant correlation was detected between
and b). The highest frequency of fatality was detected in patients NSP5_G15S and UV (rs = 0.91), followed by NS8_S24L and
Downloaded from https://www.cambridge.org/core. IP address: 46.4.80.155, on 16 Aug 2021 at 11:22:51, subject to the Cambridge Core terms of use, available at https://www.cambridge.org/core/terms
. https://doi.org/10.1017/S095026882100100XEpidemiology and Infection 11
Fig. 6. Frequency of (a) yearly clade distribution of SARS-CoV-2; (b) monthly clade distribution of SARS-CoV-2 and (c) monthly variant distributions during COVID-19
in Japan.
maximum temperature (rs = 0.51), NSP3_T1198K and RH (rs = infectious viral diseases. The wave of COVID-19 pandemic is
0.45), respectively (Table 5). Frequency of mutations and weather also shaped by meteorological parameters namely, temperature,
were positively related to each other. The impact of different host RH, UV index, rain fall, snow fall, atmospheric pressure and
factors such as coinfection, age and gender variability on wind speed [21–28, 36–39]. Besides, direct man to man transmis-
mutation frequency was also analysed. Significant correlation sion is the major mode of spread of COVID-19. Gatherings of
between host factors and frequency of mutation was detected people during social, religious and sports events and exportation
(Tables 4 and 5). of new variants to specific country by immigrants are also regu-
lating the spread of COVID-19 [21–23]. Previously different stud-
ies have found a significant impact of weather on coronaviruses
Discussion
infection [38–40]. High temperature and UV can reduce the sur-
Evolution of new variants and increase in transmission rate of vival period and viability of SARS-CoV-2 [21–24, 26, 27, 36–39].
COVID-19 have infected millions of people within short time Temperature above 40 °C can reduce the viability of SARS-CoV,
during the second wave globally [34, 35]. Numerous factors MERS-CoV and SARS-CoV-2 significantly under both laboratory
including hosts health conditions, comorbidity, age, gender and and environmental conditions [40–42]. In this study, the correl-
weather parameters are regulating the transmission rate and out- ation and impact of various regulatory factors on the spread
come of the pandemic [36–38]. Parameters of weather always play and outcome of COVID-19 in Japan were determined. A sharp
significant roles in determining the outcome and severity of increase in cases and fatalities associated with COVID-19 was
Downloaded from https://www.cambridge.org/core. IP address: 46.4.80.155, on 16 Aug 2021 at 11:22:51, subject to the Cambridge Core terms of use, available at https://www.cambridge.org/core/terms
. https://doi.org/10.1017/S095026882100100X12 Nadim Sharif et al.
Fig. 7. Circulation and frequency distribution of substitution and deletion mutations at (a) spike protein and (b) structural and non-structural proteins in Japan
during the COVID-19 pandemic. Venn diagram depicting the point mutations at (c) spike and (d) other structural and non-structural proteins circulating throughout
the pandemic in Japan.
detected after October 2020 when the temperature and UV index were used to determine the correlations. We included more para-
started to decrease significantly. meters and longer analysis for Japan compared to the previous
Various meteorological parameters are correlated with the studies. Except for atmospheric pressure, 11 other factors of wea-
COVID-19 pandemic [21, 22]. This study detected a significant ther were significantly correlated with the increase of cases, fatal-
correlation of weather and outcome of COVID-19 in Japan, ities, growth rate and case fatality rate. COVID-19 incidence was
which is similar to previous findings in Bangladesh, China, strongly correlated with average temperature (rs = −0.51), min-
USA, Turkey and Indonesia [21–28, 36–40]. Three time frames imum temperature (rs = −0.55), UV index (rs = −0.42), sun
Downloaded from https://www.cambridge.org/core. IP address: 46.4.80.155, on 16 Aug 2021 at 11:22:51, subject to the Cambridge Core terms of use, available at https://www.cambridge.org/core/terms
. https://doi.org/10.1017/S095026882100100XEpidemiology and Infection 13
Fig. 8. (a) Gender distribution of COVID-19 patients
and (b) health outcome in COVID-19 patients in differ-
ent age groups in Japan.
hours (rs = −0.49), RH (rs = −0.47), total population (rs = −0.59) Among three time frames, the first day of incidence had the stron-
and population density (rs = −0.47). This statement is in good gest correlation with the weather and total population and popu-
agreement with previous findings in Bangladesh and China lation density.
[22]. Fatalities of COVID-19 was significantly correlated with Other regulatory factors including duration of lockdown, avail-
population density (rs = −0.81), total population (rs = −0.72), ability of health facilities, availability of vaccine, tendency of the
RH (rs = −0.59) and minimum temperature (rs = −0.54). In a pre- people to practice COVID-19-associated health rules, frequency
vious study, the association of temperature and COVID-19 fatal- of social and religious gatherings and regulation on immigrants
ities was also reported from Bangladesh [22]. Furthermore, the have also shaped the wave of COVID-19 [22, 39]. Before
case fatality rate and growth rate of cases were also affected by October 2020, COVID-19 was well controlled in Japan, but
weather and population density in Japan. The findings on the with the change in weather, increase of international immigra-
impact of weather and population on COVID-19 case fatality tions and circulation of new variants both the cases and fatalities
rate and transmission rate are eccentric in this study. Sharif and increased in Japan [20].
Dey [22] and Şahin [36] detected a significant association of wea- Various substitution point mutations throughout the gnome of
ther with COVID-19 cases in Bangladesh and Turkey, respect- SARS-CoV-2 accelerated the origin of new variants [29, 32].
ively. This study detected stronger correlation among weather Among these point mutations, cluster mutations at receptor bind-
and COVID-19 in Japan. Similar to previous studies, we also ing domains of SARS-CoV-2 are the most significant in determin-
found significant correlation between UV index and COVID-19 ing the transmission capability and antibody neutralisation effect
cases and fatalities. Positive correlation was persistent between on the virus. Vaccines of COVID-19 have become available
wind speed, population density, total population and recently. However, emergence and spread of new variants have
COVID-19 cases and fatalities in Japan which has similarity to threatened the efficacy of vaccine globally. In Japan, GR (92%)
previous findings in Bangladesh, USA and China [22, 25, 39]. was the most prevalent clade followed by GH (3%) clade. Since
Downloaded from https://www.cambridge.org/core. IP address: 46.4.80.155, on 16 Aug 2021 at 11:22:51, subject to the Cambridge Core terms of use, available at https://www.cambridge.org/core/terms
. https://doi.org/10.1017/S095026882100100X14 Nadim Sharif et al.
Table 4. Spearman’s correlation coefficients of weather factors, host factors and frequency of mutation at spike protein in Japan
Mutations Max temp Avg temp Min temp UV Sun hours RH Rain fall Snow fall Age Gender
L18F 0.001 0.02 0.01 – – 0.002 – 0.01 0.005 0.04
T20N – – – 0.002 0.14 0.04 0.2 0.31 0.12 0.34
H69del 0.21 0.26 0.18 0.14 0.17 0.18 0.19 0.02 – 0.15
Y145del 0.41* 0.16 0.14 0.11 0.14 0.04 0.003 0.61* 0.26 0.001
A222V 0.11 0.27 0.01 0.42 0.51 0.03 0.13 0.24 0.31 0.06
K417N 0.01 0.001 0.1 0.38 0.40** 0.41 0.02 0.31 0.46* 0.64*
N439K 0.14 0.07 0.43 0.24 0.001 0.34 0.35* 0.09 0.002 0.07
S477N 0.11 0.41 0.004 0.19 0.02 0.17 0.001 0.19 0.42 0.43*
T478I 0.01 0.18 0.12 0.42 0.41 0.56* – 0.41 0.12 0.28
E484K 0.16* 0.19 0.014 0.11 0.53** 0.41 0.19 0.16 0.007 0.07
N501Y 0.46* 0.34 0.04 0.41 0.49* 0.001 0.43 0.39 0.19 0.09
E780Q 0.31 0.16 0.41* 0.01 0.17 0.43* 0.15 0.25 0.34 0.47*
V1176F 0.17 0.24 0.14 0.7** 0.4 0.25 – 0.24 0.01 0.13
**, * stand for 1% and 5% levels of significance.
Value between +1 and −1 are considered statistically significant.
Table 5. Spearman’s correlation coefficients of weather factors, host factors and frequency of mutation at structural and non-structural proteins in Japan
Environmental and host factors
Max Avg Min Sun Rain Snow
Mutation sites temp temp temp UV hours RH fall fall Age Gender
N P13L 0.01 0.01 0.18 0.25 0.52* 0.01 0.17 0.08 0.023 0.004
S194L 0.01 0.08 0.12 0.26 0.01 0.08 0.16 0.01 0.16 0.06
R203K 0.001 0.004 0.17 0.19 0.02 0.004 0.01 0.18 0.34* 0.03
G204R 0.01 0.06 0.01 0.23 0.03 0.06 0.03 0.21 0.28 0.31
I292T 0.004 0.11 0.32 0.61 0.06 0.11 0.61** 0.67** 0.41* 0.1
NS3 V13L – 0.24 0.18 0.34 – 0.24 0.13 0.31 0.51* 0.16
Q57H – 0.36 – 0.01 – 0.36 0.41 0.01 0.19 0.06
G251V 0.4 0.42* 0.14 0.43 – 0.42 0.19 0.61 0.24 0.41*
NS8 S24L 0.51* 0.34 0.14 0.19 0.41* 0.34 0.13 0.14 0.61* 0.04
L84S 0.06 0.02 0.04 0.17 0.16 0.02 0.001 0.24 0.13 0.01
Q27stop 0.32 0.001 0.04 0.08 0.22 0.001 0.07 0.01 0.25 0.21
NSP2 T85I 0.17 0.31 0.12 0.19 0.37 0.31 0.42 0.45** 014 0.34*
D268del 0.06 0.01 0.05 0.38 0.02 0.01 0.13 0.01 0.11 0.33
I559V 0.09 – – 0.34 0.19 – 0.01 0.37 0.01 0.24
NSP2 P585S 0.16 – – 0.43 0.11 – 0.61 0.40* 0.25* 0.06
NSP3 T1198K 0.24 0.45 0.14 0.53 0.29 0.45* 0.16 0.19 0.81* 0.25
NSP5 G15S 0.05 0.4* 0.36 0.91* 0.09 0.4 0.33 0.24 0.14 0.26*
NSP6 L37F 0.25 0.34 0.16 0.24 0.24 0.34 0.19 0.29 0.015 0.16
NSP12 A97V 0.16 0.26 0.13 0.38 0.14 0.26 0.14 0.11 0.18 0.42*
P323L 0.23 0.15 0.14 0.46* 0.21 0.15 0.18 0.61** 0.28* 0.019
NSP13 P504L – 0.11 0.19 0.24 0.41* 0.11 0.27* 0.01 0.19 0.14
Y541C 0.04 0.006 0.03 0.38 0.001 0.006 0.09 0.01 0.17 –
**, * stand for 1% and 5% levels of significance.
Values between +1 and −1 are considered statistically significant.
Downloaded from https://www.cambridge.org/core. IP address: 46.4.80.155, on 16 Aug 2021 at 11:22:51, subject to the Cambridge Core terms of use, available at https://www.cambridge.org/core/terms
. https://doi.org/10.1017/S095026882100100XEpidemiology and Infection 15
December 2020, four variants with high significance including complete concept on the seasonal pattern of the cases and fatal-
501Y.V1, 501Y.V2, 452R.V1 and 484K.V2 have been detected in ities of COVID-19 in Japan during the last 14 months. This
Japan. These variants have been involved in high transmission study included numerous factors that can affect the outcome of
rate, escape from immune reaction and lower detection rate in the pandemic to understand the dynamic of COVID-19.
several countries [29, 32]. Significant correlation was detected between weather and cases,
Diversity and frequency of mutations at spike protein have weather and fatalities, population and cases, population and fatal-
increased after October 2020 in Japan. About all of the isolates ities, weather and mutations, host factors and mutations. Four
in Japan contained D614G at spike proteins, N_S194L and recently evolved variants including 501Y.V1, 501Y.V2, 452R.V1
N_R203K at the nucleocapsid region. Variants with substitutions and 484K.V2 have been reported in Japan. This study concludes
namely, K417N, T478I, N501Y, E484K, N439K and S477N at that not only preventive measures and interventions, but also wea-
RBDs have been detected recently in Japan. Both deletion and ther has significant roles in shaping the outcome and severity of
substitution mutations at structural and non-structural proteins the COVID-19 pandemic. This study will help international
have become abundant in Japanese isolates. This study reported health organisations and policy makers to understand the
the cumulative mutation frequency in SARS-CoV-2 for the first COVID-19 pandemic for taking appropriate steps to minimise
time during the last 14 months in Japan. the disease burden.
We analysed the impact of weather, population and host fac-
tors on the origin and circulation of substitution point and dele- Financial support. This research did not receive any specific grant from
funding agencies in the public, commercial or not-for-profit sectors.
tion mutations in this study. A previous study in Bangladesh has
reported significant correlation between average temperature and Conflict of interest. The authors declare that they have no known compet-
mutation frequency at ORF1ab and at S- D614G [22]. Several ing financial interests or personal relationships that could have appeared to
research studies on influenza virus have reported the impact of influence the work reported in this paper.
weather and UV radiation on the evolution of substitution muta-
tions [41, 42]. Similar to previous studies, we also detected notable Data availability statement. Restrictions apply to the availability to the
data that support the findings of this study.
correlation between weather and mutation frequency of Japanese
isolates, and between host factors and mutations [21–28, 36–40].
Weather factors including temperature, UV, RH, snow fall, rain References
fall and sun hours were significantly correlated with the frequency
1. Chen N et al. (2020) Epidemiological and clinical characteristics of 99
of mutations at receptor binding domains of spike proteins and cases of 2019 novel coronavirus pneumonia in Wuhan, China: a descrip-
other structural and non-structural proteins. Furthermore, age tive study. The Lancet 395, 507–513.
and gender of patients were also correlated with the frequency 2. Zhang L et al. (2020) Origin and evolution of the 2019 novel coronavirus.
of important mutations. However, unlike previous studies in Clinical Infectious Diseases 71, 882–883.
Bangladesh, we did not detect any significant correlation between 3. Peeri NC et al. (2020) The SARS, MERS and novel coronavirus
comorbidity and mutation frequency in Japan [22]. (COVID-19) epidemics, the newest and biggest global health threats:
In the demographic analysis, this study found that the male to what lessons have we learned? International Journal of Epidemiology 49,
female ratio of the infected patients was not significantly different. 717–726.
The outcome of COVID-19 was severe in patients aged above 60 4. Matoba Y et al. (2015) Detection of the human coronavirus 229E, HKU1,
NL63, and OC43 between 2010 and 2013 in Yamagata, Japan. Japanese
years. Both death rate and hospitalisation rate were higher in
Journal of Infectious Diseases 68, 138–141.
patients aged above 60 years in Japan. The findings on both the 5. Burki T (2020) Outbreak of coronavirus disease 2019. The Lancet
distribution of age and gender of COVID-19 cases in Japan Infectious Diseases 20, 292–293.
were similar to previous studies [19]. 6. Chan JF et al. (2020) Genomic characterization of the 2019 novel human-
The impact of weather on the increase of cases and fatalities in pathogenic coronavirus isolated from a patient with atypical pneumonia
Japan was evaluated in this study. This study has reported the asso- after visiting Wuhan. Emerging Microbes & Infections 9, 221–236.
ciation of weather and host factors with the circulation of isolates 7. Khailany RA, Safdar M and Ozaslan M (2020) Genomic characterization
with mutations for the first time in Japan. A complete analysis on of a novel SARS-CoV-2. Gene Reports 19, 100682.
the present variants and clades of the circulating SARS-CoV-2 in 8. Lu R et al. (2020) Genomic characterisation and epidemiology of 2019
Japan during the last 14 months was conducted in this study. novel coronavirus: implications for virus origins and receptor binding.
The Lancet 395, 565–574.
This study will help to take proper implications by providing the
9. Sharif N and Dey SK (2020) Phylogenetic and whole genome analysis
crucial information on the impact of weather, population and of first seven SARS-CoV-2 isolates in Bangladesh. Future Virology 15,
host factors on the frequency of mutations and outcome of 735–746.
COVID-19. In future, studies including more data on mutation of 10. Davidson AD et al. (2020) Characterisation of the transcriptome and
isolates and on clinical outcomes can be conducted based on this proteome of SARS-CoV-2 reveals a cell passage induced in-frame deletion
research to create a complete scenario of the COVID-19 pandemic. of the furin-like cleavage site from the spike glycoprotein. Genome
This study will work as a significant resource of information for Medicine 12, 1–5.
future studies on environmental correlation with the COVID-19 11. Eydoux C et al. (2021) A fluorescence-based high throughput-screening
pandemic. Crucial information on circulating variants and muta- assay for the SARS-CoV RNA synthesis complex. Journal of Virological
tions in this study will work as a guideline for future studies focus- Methods 288, 114013.
12. Huang C et al. (2020) Clinical features of patients infected with 2019
ing on the evolutionary dynamics of COVID-19.
novel coronavirus in Wuhan, China. The Lancet 395, 497–506.
13. Yuki K, Fujiogi M and Koutsogiannaki S (2020) COVID-19 pathophysi-
Conclusion ology: a review. Clinical Immunology 215, 108427.
14. Kannan SP et al. (2020) COVID-19 (novel coronavirus 2019) – recent
This is one of the early studies focusing on the impact of weather trends. European Review for Medical and Pharmacological Sciences 24,
on the COVID-19 pandemic in Japan. This study has created a 2006–2011.
Downloaded from https://www.cambridge.org/core. IP address: 46.4.80.155, on 16 Aug 2021 at 11:22:51, subject to the Cambridge Core terms of use, available at https://www.cambridge.org/core/terms
. https://doi.org/10.1017/S095026882100100X16 Nadim Sharif et al.
15. Tian S et al. (2020) Characteristics of COVID-19 infection in Beijing. of Bisha, Saudi Arabia. International Journal of Contemporary Research
Journal of Infection 80, 401–406. and Review 11, 20773–20776.
16. Baud D et al. (2020) Real estimates of mortality following COVID-19 28. Zhu Y and Xie J (2020) Association between ambient temperature and
infection. The Lancet Infectious Diseases 20, 773. COVID-19 infection in 122 cities from China. Science of the Total
17. Worldometer (2021) Coronavirus update. Retrieved from https://www. Environment 724, 138201.
worldometers.info/coronavirus/. 29. Starr TN et al. (2021) Prospective mapping of viral mutations that escape
18. GitHub COVID-19 database (2021) Retrieved from https://github.com/ antibodies used to treat COVID-19. Science (New York, N.Y.) 371, 850–854.
CSSEGISandData/COVID-19. 30. Walls AC et al. (2020) Structure, function, and antigenicity of the
19. Watanabe M (2020) The COVID-19 pandemic in Japan. Surgery Today SARS-CoV-2 spike glycoprotein. Cell 183, 1735.
50, 787–793. 31. Yi C et al. (2020) Key residues of the receptor binding motif in the spike
20. World Health Organization (2020) Coronavirus disease 2019 (COVID-19) protein of SARS-CoV-2 that interact with ACE2 and neutralizing anti-
Japan Situation Reports. Retrieved from https://covid19.who.int/region/wpro/ bodies. Cellular & Molecular Immunology 17, 621–630.
country/jp. 32. Weisblum Y et al. (2020) Escape from neutralizing antibodies by SARS-
21. Shek LP and Lee BW (2020) Epidemiology and seasonality of respiratory CoV-2 spike protein variants. eLife 9, e61312.
tract virus infections in the tropics. Paediatric Respiratory Reviews 4, 105–111. 33. GISAID (2021) Retrieved from https://www.epicov.org/epi3/frontend#.
22. Sharif N and Dey SK (2021) Impact of population density and weather on 34. Volz E et al. (2020) Evaluating the effects of SARS-CoV-2 spike mutation
COVID-19 pandemic and SARS-CoV-2 mutation frequency in D614G on transmissibility and pathogenicity. Cell 184, 64–75.
Bangladesh. Epidemiology & Infection 149, E16, Published online: 07 35. Wang C et al. (2020) A novel coronavirus outbreak of global health con-
January 2021. doi:10.1017/S0950268821000029. cern. The Lancet 395, 470–473.
23. Bashir MF et al. (2021) Environmental quality, climate indicators, and 36. Şahin M (2020) Impact of weather on COVID-19 pandemic in Turkey.
COVID-19 pandemic: insights from top 10 most affected states of the Science of the Total Environment 728, 138810.
USA. Environmental Science and Pollution Research. Published online: 37. Tosepu R et al. (2020) Correlation between weather and COVID-19 pan-
25 February 2021. doi: 10.1007/s11356-021-12646-x. demic in Jakarta, Indonesia. Science of the Total Environment 725, 138436.
24. Bilal MF et al. (2021) Nexus between the COVID-19 dynamics and envir- 38. Sajadi MM et al. (2020) Temperature and latitude analysis to predict
onmental pollution indicators in South America. Risk Management and potential spread and seasonality for COVID-19. Available at SSRN
Healthcare Policy 14, 67. 3550308.
25. Sharif N et al. (2021) Environmental correlation and epidemiologic 39. Bashir MF, Benjiang MA and Shahzad L (2020) A brief review of socio-
analysis of COVID-19 pandemic in ten regions in five continents. economic and environmental impact of COVID-19. Air Quality, Atmosphere
Heliyon 7, e06576, Published online: 27 March 2021. doi: 10.1016/j.heli- & Health 13, 1403–1409.
yon. 2021.e06576. 40. Rabenau HF et al. (2020) Stability and inactivation of SARS coronavirus.
26. Tan J et al. (2005) An initial investigation of the association between the Medical Microbiology and Immunology 194, 1–6.
SARS outbreak and weather: with the view of the environmental tempera- 41. Duan SM et al. (2003) Stability of SARS coronavirus in human specimens
ture and its variation. Journal of Epidemiology & Community Health 59, and environment and its sensitivity to heating and UV irradiation.
186–192. Biomedical and Environmental Sciences: BES 16, 246–255.
27. White MS, Omer M and Mohammad GN (2020) Knowledge, attitude 42. Van Doremalen N, Bushmaker T and Munster V (2013) Stability of
and practice on prevention of airborne and droplet infections during Middle East respiratory syndrome coronavirus (MERS-CoV) under differ-
the outbreak of corona virus among the college students in University ent environmental conditions. Eurosurveillance 18, 20590.
Downloaded from https://www.cambridge.org/core. IP address: 46.4.80.155, on 16 Aug 2021 at 11:22:51, subject to the Cambridge Core terms of use, available at https://www.cambridge.org/core/terms
. https://doi.org/10.1017/S095026882100100XYou can also read