Winter 2017/18 European End-of-Season Report - MeteoGroup
←
→
Page content transcription
If your browser does not render page correctly, please read the page content below
Winter 2017/18
European End-of-Season Report
 Date         Version   Authors
 4 May 2018   1.0       Dennis Schulze, Agnieszka Glowacka, Evelyn Müller, Reinout van den Born, et al
Executive Summary
Accidents caused by icy roads account for more fatalities than all other weather-related hazards
combined.1 Winter road maintenance services have the demanding task of ensuring road safety in
the most economical way with the least environmental impact.

The amount of effort winter road maintenance services need to exert naturally depends on the
weather conditions itself. But also on the accuracy of weather information services they consult to
plan their activities. MeteoGroup has been a provider of this consultancy for many years and has
developed several models and tools supporting road services.

The winter of 2017/18 affected road services in many different ways. In most European countries
the winter season started relatively mild, was turbulent mid-season and then ended unusually cold.
It was also notable the record amount of snowfall seen in the alpine regions, leading in part to severe
flooding when the snow melted in early spring.

Our customers benefited from excellent forecast quality which was delivered through our
meteorological experts in weather rooms in eight European countries. In many cases our success
rate for the prediction of the minimum road surface temperature was well above 90%.

Table of Contents
1.      WEATHER CONDITIONS ........................................................................................................................ 3
2.      FORECAST PERFORMANCE ................................................................................................................... 5
3.      HOW METEOGROUP SUPPORTS WINTER MAINTENANCE SERVICES................................................. 8
ANNEX: HIGHLIGHTS OF WINTER 2017/18 IN KEY EUROPEAN COUNTRIES ......................................... 10

1
    Data for USA via USDOT Federal Highway Administration and NOAA, National Weather Service

                                                                                                                                                        2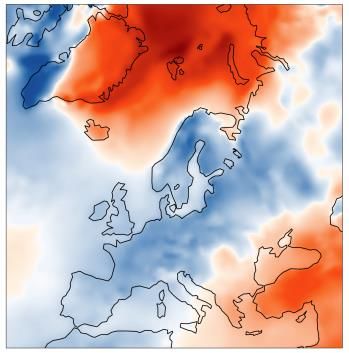
1. Weather Conditions

November 2017 to January 2018 will be recorded as having a warmer than climate
average. The end of the last winter season was characterized by unusually low
temperatures.

Surface air temperature anomalies summary2                                                       Nov 2017

November and December 2017 were warmer than the 1981-2010 average over
eastern Europe and January was warmer over most of Europe. The most spectacular
                                                                                                Nov 2017
warming was observed in December over the Arctic in which the monthly
temperature was more than 6°C above average over parts of Svalbard. On the
contrary, November was cooler than average over large parts of the west of the
continent and December over the south-west of the continent. January 2018 was
                                                                                                 Dec 2017
warmer than the 1981-2010 average over almost all of Europe. It was especially
warm over a belt from France eastwards and over the far north and north-east. Only
a few areas of the continent experienced a cooler average than normal.

February 2018 was colder than the 1981-2010 average for the month over much
of Europe. It was only warmer than average in the far north and over the south-east
of the continent. The latter part of the month was characterized by the intrusion of
very cold temperatures from the east. This was in stark contrast with daily                       Jan 2018
temperatures in parts of the Arctic more than 30°C above the daily average. March
2018 was colder than the 1981-2010 average over almost all of Europe. It was only
warmer than average over the far north and over the far south-east of the continent.

Abundant snowfall in the Alps

Several cases of cold air mass intrusion from the North, which met with much
warmer humid air masses in central Europe, resulted in some massive snow events.                  Feb 2018
This effect was enhanced by the highest mountains in Europe, the Alps, and brought
record snowfall last winter.

Strong winds

January stood out due to several significant storms. In the beginning of January the
storm Burglind caused severe damages, especially in Germany. In mid-January, a
low-pressure center in the North Atlantic developed into a severe storm named
                                                                                                  Mar 2018

2
 All maps on this page are courtesy of the Copernicus Climate Change Service (C3S) funded by the European
Union

                                                                                                             3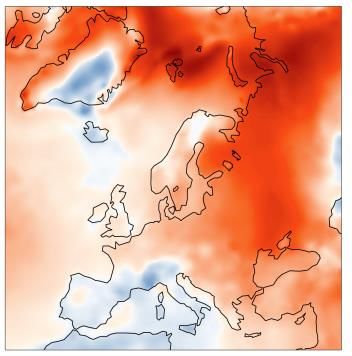
Friederike. This storm hit the British Islands on the night of January 17/18th and continued into Germany,
Benelux and Central Europe countries on the following day.

 Know-How: Sudden Stratospheric Warming, the most characteristic feature of the last
 winter in Europe

 Every winter, as polar latitudes receive little or no sunlight, the air in the stratosphere above the Pole
 cools rapidly and a strong westerly wind flow develops around this ‘cold pool’. This is called the polar
 vortex. However, the natural variability and fluctuations in surface weather across the globe can
 sometimes generate large vertically moving waves in the atmosphere. As these waves travel up
 towards the stratosphere they tend to increase in strength. At times they can slow down the polar
 vortex; similar to a brake being applied to a fast-moving wheel. If the waves are strong enough, then
 the westerly vortex can distort and even break down completely, with the wind direction reversing
 and becoming easterly. This change in wind direction is also accompanied by a rapid rise in
 temperature in the stratosphere, called a sudden stratospheric warming (SSW). SSWs tend to occur
 about once every 2 or 3 winters, normally between mid-January and mid-March. After a strong SSW,
 the weather patterns over Europe can become more conducive to allowing colder wind flows to
 develop from the north and east, with high pressure over the north Atlantic, Scandinavia and Iceland
 blocking the mild westerly winds.

 That is exactly what happened in February 2018. It caused a freezing cold end to a rainy and mild
 winter.

                                                                                                              4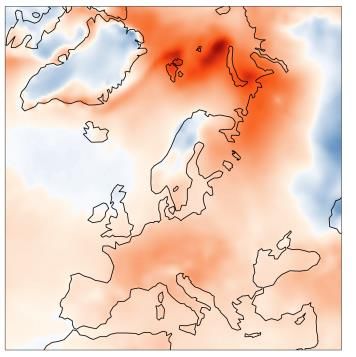
2. Forecast Performance
To measure our forecast quality, we take a strict user perspective. We apply scores which are
scientifically sound while still being intuitively understandable. We inspect weather situations where
road services are most vulnerable. We accept the limitations of road weather observations for
verification purposes. Following the suggestion of the Institution of Civil Engineers,3 we compare the
forecasted road frost against the actual observed. This is applied during critical nights with minimum
road surface temperature below 3 °C, in a contingency table as given in Table 1.
Frost forecast No frost forecast
Frost occurred F/F (Protection cost) NF/F (Damage cost)
No frost occurred F/NF (Protection cost) NF/NF (Correct rejection)
Table 1 Two-by-two contingency table as suggested by Institution of Civil Engineers
The contingency table provides input for quality scores like
• Percentage Correct = [(F/F + NF/NF) / (total number of critical nights) * 100]
• Miss Rate = (NF/F) / (F/F + NF/F) * 100
• False Alarm Ratio = (F/NF) / (F/F + F/NF) * 100
Figure 1 gives a high-level summary of MeteoGroup’s road frost forecast accuracy during the challenging
road winter season 2017/2018. Averaged over all countries, more than 94% of our road frost forecasts
were correct. Figure 3 shows the distribution of these results over the total number of investigated
stations.
In detail, evening forecasts as issued between 1 October 2017 and 1 April 2018, have been compared
with observations made by more than 1.500 road weather stations. One third of these stations is located
in the UK, another 400 in Germany, and about 200 each in the Netherlands, Switzerland, Liechtenstein,
and Spain. Additionally, a smaller set of 60 French stations was used for our quality assessment.
Regional performance is of course impacted by local specifics, as well as by the dominant weather
patterns of the past season. In Spain, most road weather stations are located on the Iberian plateaus at
elevations between 800 m and 1500 m above sea level. Up to 145 nights have experienced critical road
frost conditions. Our forecasters supported road services during several major snowfall events, which
brought up to 70 cm of fresh snow and hauled long into late April. In Switzerland, most road stations are
located in narrow Alpine valleys which are between 400 and 700 m above sea level. Local micro-
climates have a strong influence on the forecast performance and resulted in up to 160 critical nights
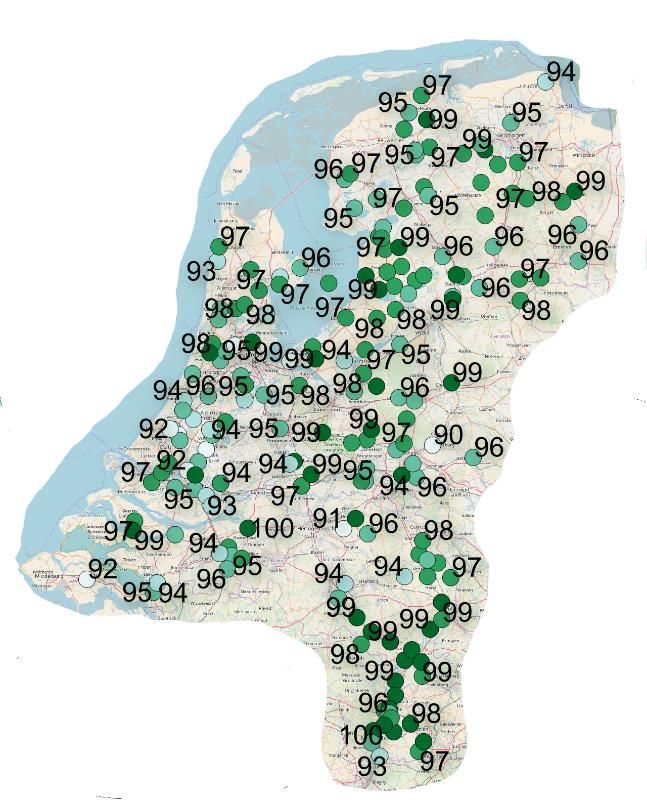
during the past season. In the Netherlands, MeteoGroup provided excellent forecast accuracy, this past
3
Highway Winter maintenance: Ice Design and Practice Guide (2000). Institution of Civil Engineers (ICE), Thomas
Telford Ltd, ISBN-10 0727729578.
5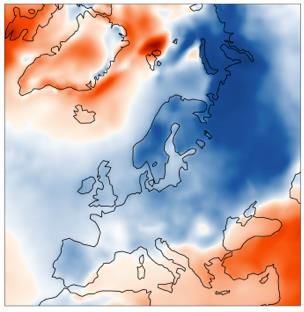
winter. This is only possible with expert knowledge of local wind systems alongside the shores and the
specifics of bridges, as well as a close monitoring of clearing clouds. Figure 2 shows detailed results for
the Netherlands, where on average 97% of the 80-100 critical nights were forecasted correctly. In
Germany, potential forecast accuracy is determined by mountainous terrain. Half of the German road
weather stations are located at elevations over 200 m above sea level, a quarter over 400 m above sea
level. Additionally, a high number (nearly 40%) of road weather stations are installed on bridges, which
react more sensitively to unforeseen changes in the atmospheric conditions. In the UK, both mountains
and sea, and some of the most challenging weather patterns of the past decade, had an influence on the
forecast accuracy during this winter season. Depending on the location, 65 to 140 nights have had
critical road frost conditions. Only an excellent forecasting model and expert forecasters could achieve
an average accuracy of 95% correct forecasts; with less than 5% missed road frost nights and only 6%
of false alarms. On March 1st, 2018, the storm Emma brought widespread heavy snow and drift into the
south-west England, followed by and alternating with freezing rain. it gave our weather rooms the chance
to prove high forecasting skills and accuracy. It has already entered the annals of British road services.

                                                                       Figure 2. Percentage correct road frost forecasts by MeteoGroup
Figure 1. MeteoGroup Road weather forecast accuracy during season during the 2017/18 season in the Netherlands. Between 80 and
                                                                       100 nights during the season were critical for road frost (including
2017/18. On average, 94% of MeteoGroup’s road frost forecasts for
                                                                       bridges), and on average 97% of them were forecasted correctly.
the next night were correct, with a false alarm ratio of less than 5%.
                                                                       The average false alarm ratio was less than 2%.

                                                                                                                                        6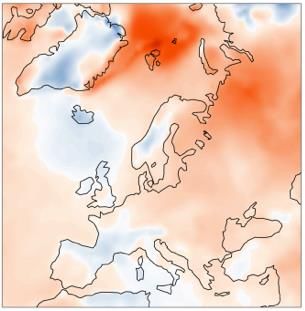
Correct forecasts distribution

               Figure 3. Distribution of correct forecast percentage amongst the inspected ~1500 stations.

For resource scheduling by winter road services, the major decision support is provided by the noon
forecast issue. MeteoGroup updates forecasts every hour, incorporating fresh precipitation radar
soundings as well as new reports from thousands of weather stations and many more observations to
capture the latest atmospheric development. Until the evening, an average gain of 1% in temperature
forecast accuracy is achieved. For snowfall and freezing rain, the accuracy gain is even higher,
particularly during capricious atmospheric conditions.

                                                                                                             7
3. How MeteoGroup supports Winter Maintenance
Services
About MeteoGroup
MeteoGroup is the global weather authority which combines accurate science with advanced technology
and local expertise with global reach. MeteoGroup is trusted by hundreds of government agencies,
thousands of companies and millions of consumers. MeteoGroup is ISO 9001 and BS OSHAS 18001
quality certified.
MeteoGroup RoadMaster
RoadMaster is the world’s leading winter road weather solution. And it’s easy to see why. It provides the
most reliable forecasts, delivered on the best platform – making it the most cost-effective solution.
RoadMaster combines everything you need to minimize costs and limit your environmental impact
without jeopardizing safety on the road.
An Expert Weather Room Team
MeteoGroup’s Road team of over 150 meteorologists is recognized worldwide for its expertise and
predictive accuracy. This team includes dedicated RoadMaster weather experts with extensive road-
specific experience – including knowledge about the emergence of different types of road slipperiness.
This experience, combined with their understanding of weather patterns and anomalies, allows
MeteoGroup to support you with unrivalled expertise and 24/7/365 weather room support.
Mature, Road-Specific Weather Models
MeteoGroup RoadMaster is powered by proprietary, road-specific weather models which have been
refined over the past three decades. Our mature physical and statistical modelling techniques combine
the best available weather models with data collected from road weather information stations (RWIS),
historical predictions, and records of actual weather conditions to generate the most precise location-
specific forecasts available. Our unique weather model has consistently proven to be more accurate and
reliable than any alternative.
Constantly Monitored for Quality
As conditions change, you need weather information that’s accurate and up to date. We constantly
monitor the quality of our forecasts by having meteorologists correct them 24/7 as needed and
benchmarking against alternatives. Constant monitoring of factors such as road-surface temperature and
conditions, combined with our capacity to incorporate live weather observations into our model, ensure
that our forecast is of the highest quality in changing conditions. Analysis of radar and satellite images
further refines our forecasts and nowcasts. Benchmarking has consistently shown that our forecasts
outperform both raw weather models and the competition.
8Clear, to-the-point user interface
MeteoGroup RoadMaster’s clear and to-the-point user interface simplifies decision making by giving you
the most relevant information first. You can easily drill down to important details. Get effortless access
to short-term and long-term road specific forecasts. Easy-to-read color-coded tables identify the most
relevant information. The hazard table alerts you to any upcoming road weather hazards such as hoar
frost, snow, ice, and freezing rain. RoadMaster’s platform gives you a clear overview of road-surface
temperatures and data from RWIS sites. You can also view real-time observations, forecasts for the
coming 3 hours and animated precipitation type radar to distinguish between rain, hail, snow and
freezing rain. RoadMaster provides you with animated satellite images to determine cloud cover.
RoadMaster’s premium Decision Support System (DSS) can even advise you on the optimal time window
for salting and the latest safe time to carry out the gritting action.
Integration with your systems
Would you also like to visualize our forecasts your way? MeteoGroup’s weather API lets you incorporate
information from RoadMaster into your existing systems and be displayed through the interface that you
are most familiar and comfortable with. Integration can also be a two-way street. MeteoGroup applies
the data from your RWIS in location specific forecasts and displays the measurements and forecasts in
RoadMasters’s web-based platform. Whatever you choose, MeteoGroup’s professional services can help
you carry out a smooth and successful integration.
9Annex: Highlights of winter 2017/18 in key European
countries
Spain
Unlike in most parts of Europe, the recent winter season was longer and more active with some heavy
snow events in Spain. Especially compared to the relatively calm winters of the last 5-6 years.
January and February were unusually snowy months; March subdued to normal while the winter
weather remained in the highlands and in the mountains.
Seventy centimeters snow on roads
The most severe snowfall events took place on January 6th-7th in the northern half of Spain, with large
amounts of snow and reaching up to 70 cm in some areas. Roads around Sistema Central and Sistema
Ibérico, the northern plateau and even in the Ebro valley were heavily affected. Lots of roads were
closed because snow plows could not work and vehicles becoming stranded in traffic jams. The
snowfall event was of particular importance because the impact was massively amplified by the
media. Finally, it generated a high amount of comments and complaints including at high levels of
government.
Severe combination of weather at the end of the season
February 27th-28th, after a cold intrusion from Europe (“Beast from the East”), a low-pressure system
which developed just west of the Iberian Peninsula pulled warm and moist air from the tropical
Atlantic which met with colder air masses previously advected from the east. As a result, snow fell
even in the lowlands and on the coast, as the warm air gained terrain from south to north (later
reaching the British Isles). More than 10 cm fell on the northern coast of Spain. Associated with the
warm front, scattered cases of freezing rain were also observed at some locations on the northern
plateau.
In summary, January and February were months with severe winter weather while the rest of the
winter season was average.
United Kingdom
As with Spain, Britain went against the norm, with a colder than average winter. The temperature
was ~0.5°C below the average over England and Wales and ~1°C below the average over Scotland
when compared to a climatology of the last 10 years. January was the only month where there was a
monthly averaged mild anomaly over a sizeable part of the UK (southern half of England and Wales),
10while February was a colder than average month over all parts, especially in the south. The coldest
weather of the winter came at the very end of February (and into early March), when a major sudden
stratospheric warming in the polar stratosphere in mid-February triggered the development of
intense high pressure over Scandinavia and the Arctic. This brought Siberian air rapidly south-
westwards over the UK, with widespread snow and severe wind chill and frost.
Lows changed their tracks
A low-pressure track frequently displaced to the south of climatology resulted in a drier than normal
winter over most of Scotland and northern England. We saw far fewer mild and wet spells sweeping
across these areas than in a typical winter. Locations such as Cumbria and Lancashire, which have
suffered severe and damaging flood events during several winters in the past decade, did not have
to endure these conditions this winter. Meanwhile, over southern and western areas of the UK,
rainfall amounts were near or slightly above normal, with most of the wet days occurring in
December and January. February was a drier than normal month over all of the UK, while March was
very wet with more than twice the monthly rainfall falling in some southern areas.
The southerly displaced low-pressure track also resulted in a calmer than normal winter over
Scotland and the far north of England. Nearly all of the deep low-pressure areas that crossed the UK
between October and January produced their strongest winds over central and southern parts of
England and Wales. From late January through to March, an increase in high pressure blocking
weather patterns over northern Europe saw a distinct lack of strong and damaging wind storms over
the UK.
The road salting crews were very busy last season, as there were plenty of nights with road surface
temperatures below zero and quite a lot of precipitation as well.
Snow, snow, snow
On Sunday December 10th, 2017 an area of low pressure moved eastwards across the far south of
England. Just to its south, strong westerly winds, up to 70 mph (113 km/h), caused a few problems.
However, the main issue was the heavy snow which fell on the northern side of the system, across
parts of Wales and the Midlands. 10-20 cm of heavy, wet snow fell in just a few hours, which caused
a lot of travel problems, despite the forecasts giving generally very good guidance. This was partly
down to the intensity of the snow, as well as low traffic volume as it was a Sunday morning (so the
salt doesn’t mix in so well with the snow). On January 15th-18th 2018, a strong west to north-westerly
flow brought frequent snow showers to Scotland and parts of northern England. 20-40 cm of snow
fell in places, with drifting in the strong winds. Lightning was an additional hazard.
11Siberian cold and …. snow
Late February into early March 2018: The Beast from the East. After a major Sudden Stratospheric
Warming event in mid-February, a bitterly cold airflow from Siberia swept in from the east across
northern Europe, including the UK. It was the coldest spell since December 2010, with some places
having their coldest days since February 1991. Almost everywhere in the UK had snow, which was
dry and powdery, and drifted a lot in the strong easterly winds. Storm ‘Emma’ (named by the
Portuguese Met. Office) moved towards southern England and brought more widespread heavy snow
(as opposed to snow showers in the preceding days), especially to south-west England. Devon, a
normally mild county, experienced drifts 3-4 metres deep. Additionally, slightly less cold air moved
in for a time just above the ground, creating conditions favourable for freezing rain in parts of
southern England. This added to the widespread travel problems.
Belgium
The meteorological winter in Belgium lasts from December until February and the average weather
conditions very much approached the climatological mean. In other words, when studying the
weather parameters, the winter appeared “normal” for Belgium. Nevertheless, there were some
considerable differences between the months with periods of weather that certainly deviated from
the norm.
December and January were very dark months with temperatures higher than average. During those
two months we had almost 70 hours less sunshine than normal. You would have to go back to 1915
to find similarly dark and warm months. February, on the other hand, was dominated by northern
high pressure and thus produced a significant cold spell in Belgium. The average temperature
dropped 3 °C below the climatological mean.
Freezing Rain
On Friday March 2nd a long cold spell was ended by a low-pressure system that approached Belgium
from the South. The atmosphere was still very cold, however, and the arriving warm front in
combination with a layer of very cold air near the surface, created conditions favorable for freezing
rain. For a couple of hours freezing, supercooled rain was falling all over Belgium. This generated icy
conditions on roads in the whole country. The forecasts were accurate though and the main airport
in Brussels was able to continue normal operations for most of the day. Once the cold front set in,
snow started falling and accumulating in vast areas of Belgium. Despite all efforts, the airport had to
cancel most of the flights for that evening.
12The Netherlands
Similar to the previous four years, the winter of 2017-2018 as a whole went quite smoothly.
However, the differences between the individual months were large. The top ten warmest months of
January in De Bilt were followed by the coldest February since 1996.
Quick start of the winter
Already on the night of November 6th/7th the temperature declined to below freezing on a large scale,
for the first time in the season. Later in November it came to light frost a few times during the night.
Mixed feelings about December
The first days of December brought considerably colder weather. On December 1st, the temperature
in Gilze-Rijen fell to -5.6 °C in the evening. The day after, the eastern regions experienced the first
ice day in many places (maximum temperature below 0 °C), due to persistent fog. Then, after a milder
intermezzo, colder air began to flow again on the 7th December leading to significant snowfall on
December 10th and 11th, in most of The Netherlands. The biggest amount, more than 30 cm of snow,
was reported locally on the Veluwe. Eventually, the soft air won the battle again and the remainder
of December was mostly non-wintry and varied weather. On New Year's Eve the temperature reached
14.5 °C in Arcen!
11 Beaufort
In January temperatures remained above zero most of the time. The lowest national temperature in
January was -3.1 °C, in Nieuw-Beerta in Groningen on January 8th. The most significant weather
events that month were two very heavy storms on the 3rd and 18th of January. The second one was
the heaviest since January 1990. At sea, hourly average wind force 11 Beaufort was reported, and
also deep inland, local force 9 Beaufort was achieved. In addition, wind gusts up to 124 km/h were
observed in Enschede and 143 km/h in Hoek van Holland. Apart from the storms, very spring-like
weather came on January 24th is worth mentioning, with maximum temperatures up to 14.7 °C in
Woensdrecht.
Freezing in February
The weather pattern changed in February. Frequent easterly winds allowed colder and drier air to
enter the country. That gave the sun a lot more room and frequent frost in the nights. During the last
days of February and the beginning of March it was icy cold. Due to strong easterly winds extremely
13cold air from Siberia was transported, the temperature remained negative for five days in a row, at
some locations. It was extremely cold, especially on the last day of February. During the day the
maximum temperature in Enschede was only -6.0 °C. The lowest winter temperature was measured
in Woensdrecht, on February 28th (-10.5). At the same time, there was a wind force 5 to 8 beaufort
lowering the perceived temperature down below -15 °C. On top of that, at the end of February snow
showers spread over the German Bight into the Wadden Sea region, resulting in more than 10 cm of
local snow.
From cold to warm and back again
March started quite winterly with ice days and a cold east wind. Ice-skating was possible in many
places, even in Amsterdam. On March 3rd soft air from the south attacked the cold air mass, resulting
in more than 5 cm of snow on the frontal zone in some places in the south. The mild air eventually
conquered the entire country. From one day to another the cold was gone. On March 10th it was even
16.7 °C in Ell. However, the winter cold came back. As a result of an icy easterly wind, it remained
freezing in many places during the day on March 17th. March was again a clearly cold month and
was even colder than December and January.
February saved the sunny image of the winter
Despite a very dark December and January, the winter appeared to be sunnier than average, largely
due to a record-breaking February. On average, the sun shone 48 hours more than usual during the
three winter months. In February, the number of hours with sun (162 hours in average for the
country) was about twice as much as in December (32 hours) and January (50 hours). Also, in March
sunny weather was more frequent than the long-term average.
December was particularly wet with 112 mm precipitation on average over the country. January was
also slightly and overly wet with 89 mm, while February was considerably drier, by 23 mm on
average.
Switzerland
Last year’s winter was somewhat warmer than usual overall in Switzerland, only in the mountains it
was slightly colder. It was grey and brought a lot of snow. December was colder than average, with
early snowfall in low-lying areas and frequent snow showers, which were difficult to forecast well
enough in advance for our winter-service clients. January was very warm with a record high mean
temperature of 6°C in Geneva. Frequent storms caused some severe damage, especially storm
Burglind on January 3rd.
14Snow records
Several times last winter, strong westerly winds brought very humid Atlantic airmasses to the Alps
("atmospheric rivers"), resulting in excessive precipitation in the Western Alps in January and a lot
of snow in the higher Alps: Simplonpass (2000 m amsl) got 90 cm of fresh snow within 24h and on
January 23rd a new record of snow depth of 239 cm was established!
Never-ending snow? Where’s the sun?
February was very dull (less than 50% of sun duration hours, especially in the north of the Alps) and
cold. March as well brought cold weather with frequent snowfall and a lot of work for our weather
room in Appenzell. Geneva reported a snow height of 17 cm on the 3rd (new record), and low-lying
Basel in northern Switzerland noted 10-15 cm snow on March 18th.
Even the last day of March 2018 brought 60cm of fresh snow to Göschenen (~1000m amsl) on the
northern side of Gotthard tunnel and located on an important south-north freeway. The snowfall
was associated with a low-pressure center over Italy and so called “diabatic cooling-effect”.
It was very difficult to make thermal mappings in Switzerland and France this year due to unsettled
weather conditions in February and March.
Germany
December was gloomy and wet while January was flooding and very mild. The end of season was icy
with lots of sun and snow in the Baltic Sea region. Last winter offered a great snow season in the
Alps, but also unfortunately brought with it a lot of dangerous avalanches. In general, the winter was
mild, and warmer by 1.4°C than the climate on average.
Christmas without snow
December started promising with snowfall. Not only in the Alps but also in lower parts of Germany
and far up North. Mild weather around Christmas caused thawing and led to floods in the West and
Southwest of Germany.
Dynamic weather
In February it was sunny, but there were heavy snow showers towards the Baltic Sea and in the North
of Schleswig-Holstein. Snowbanks also occurred due to gusty easterly winds.
Windy anniversary
15On January 18th, exactly 11 years after the Kyrill storm, the Friederike low hit Germany. Maximum
wind gusts reached 203 km/h on Brocken (the highest point in Middle/Northern Germany). Another
storm Burglind brought not only gale force winds but also mild temperatures. On January 3rd, 2018
the temperature reached the highest value in this winter season in Rheinfelden, 16.2. Lowest
temperature, -40.3°C, was observed on February 28th, 2018 in Funtensee, a high valley in the
Southeast.
More facts:
It is worth mentioning widespread freezing rain covering the area from the North Sea via Hamburg
to Berlin, on the morning of February 5th, 2018 caused a lot of traffic problems. Furthermore, the
period from February 26th to 2nd of March brought a lot of snow with a maximum of 38 cm in
Bordelum, on February 28th.
Poland
Above the average
Last December and January were significantly mild. During Christmas the deviation from climate
values reached up to over 10°C in some locations, with maximum temperatures up to 12°C. On the
other hand, February and March appeared to be much colder than usual, especially in the end of
February and beginning of March, with minimum temperatures around -15°C in the prevailing area
and below -20°C in some places in eastern Poland.
Peculiar snow record
Although December was warm with hardly any snow, a snow depth record was reached! On the
December 24th on Kasprowy Wierch, one of the highest Tatra Mountain summits in Poland, the snow
layer reached 210 cm, and that is the highest ever reported value.
White locally in February
Snow cover usually did not last for many days in a row because of frequent temperature changes.
However, on February 2nd, in south-east Poland, 20 cm of fresh snow fell in 10 hours, followed by
25 cm more in the next few days. That was associated with an atmospheric front dividing warm and
moist tropical air from much colder polar masses. As it happened in the highlands area with naturally
lower temperatures, the snow remained during the whole month.
16The last snow event was observed on April 1st and 2nd, but on the very next day the maximum
temperatures reached 17-20°C in many locations.
17You can also read