Comparison of Predicted and Actual Traffic Data at Pumas, UTHM by using UAV and SIDRA
←
→
Page content transcription
If your browser does not render page correctly, please read the page content below
International Journal of Advance Science and Technology
                                                                       Vol. 29 No. 10S, (2020), pp. 1181-1191

Comparison of Predicted and Actual Traffic Data at Pumas, UTHM by
                      using UAV and SIDRA

                     Lim Wei May*1, Raha Abd Rahman2, Mohd Farid Hassan3
       1,2
             Faculty of Civil and Environmental Engineering, Universiti Tun Hussein Onn
                            Malaysia, 86400 Parit Raja, Johor, Malaysia
  3
      Pejabat Setiausaha Kerajaan Johor, Bahagian Perumahan, 79503 Iskandar Puteri,
                                      Johor, Malaysia
                                *1
                                   limweimay@gmail.com

                                            Abstract
   Urbanisation had causes congestion especially in urban area, traffic management and
monitoring is important in easing the traffic impacts generated from rapid development together
with land use planning to control development and redevelopment. Traffic impact assessment
(TIA) provide the practitioner the framework for decision making but there is lacking of
monitoring in the assessment after the development where congestion happens. Thus, this study
proposed the use of unmanned aerial vehicle (UAV) and SIDRA intersection in data collection
and analysis for traffic monitoring. The method of UAV video recording promotes accuracy and
less complexity in traffic volume count. While, SIDRA intersection allows the analysis of level of
service to determine the performance of the studied location. With this, the LOS of the
intersection predicted for the year 2020 is compared with the actual traffic data taken. The T-
junction connecting minor road, J207 fronting PuMAS UTHM and the main road, FT005 was
operating at LOS D in 2014 and in 2020 at LOS F during peak hours as predicted. Hence, sensor
traffic signal is proposed to mitigate the congestion in the minor leg so that overall it will
operate in LOS C.

  Keywords: Unmanned Aerial Vehicle; SIDRA intersection; Traffic Monitoring

1. Introduction
   Increasing population brings many cities into rapid urbanisation, invariably the occurrences of
congestion and accidents have become common. Many studies had emphasised on traffic
management and land use planning to alleviate the traffic impacts generated from development
(Hokao & Mohamed, 1999). Transportation measures are essential to incorporate in land-use
measures in the early stage of traffic mitigation process to control the impacts from the
development in contributing to congestion problems ((Lidasan et al., 2010). Uncontrolled
developments, improper planning and inefficient traffic management resulted in the increasing
traffic congestion in urban environment (Teodoro et al., 2005). A sustainability in transportation
planning can be realised with effective and practical traffic management schemes that alleviate
congestion. Authority or city administrations, developers and traffic consultant have been
working cooperatively in the implementation of these mitigations measures to reduce congestion,
accidents and environmental degradation for better life quality and road safety.
   Development or redevelopment will contribute impacts to the surrounding road network, at
micro-level it may seem negligible, but the collective of small scale development may affect the
regional road network as each development generates new trips and traffic load. Unless such new
loading is properly studied and addressed; the road network will degenerate in capacity and
efficiency, resulting in congestions and other negative impact on the environment. A common
method that is used to address such problem is the Traffic Impact Assessment (TIA) (Jabatan
Kerja Raya Malaysia, 2018; Road Engineering Asscociation of Malaysia & Jabatan kerja Raya

 ISSN: 2005-4238 IJAST                                                                                 1181
 Copyright ⓒ 2020 SERSC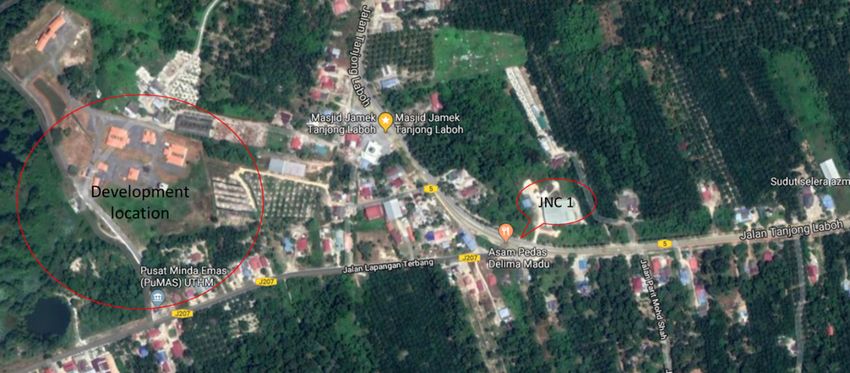
International Journal of Advance Science and Technology
                                                                        Vol. 29 No. 10S, (2020), pp. 1181-1191

Malaysia, 2011). In Malaysia, under the Town and Country Planning Act 1979 (Act 172), TIA is
required when the proposed development meets the triggered values (The Commissioner of Law
Revision Malaysia, 2006). This assessment is an important tool used to determine the impact of
traffic generated from a proposed site development project on the surrounding road and
transportation systems and to provide the mitigation measures for the traffic and transportation
system manner (Lim, Abd Rahman, Hassan, & Md Rohani, 2019; Lim, Abd Rahman, Hassan,
Mashros, et al., 2019). The report provides the authorities, planners and developers a framework
in making critical land use and site planning decisions regarding traffic and transportation issues
to ensure that development of towns and cities is controlled in an orderly.

2. Literature Review
   since the early 90‟s, TIA had been implemented in Malaysia but traffic problems still
prominent with the continuous increase in accident rate. One of the issues in the practice
experienced by both developed and developing countries is the current TIA framework is still
lacking of monitoring process (Lim, Abd Rahman, Hassan, Md Diah, et al., 2019; Van Rensburg
& Van As, 2004). Monitoring is an important process to assure the development was built as
planned in the approved TIA study and to ensure that the mitigation measures for the traffic
impacts had been adopted during project implementation. Besides, monitoring makes sure the
development do not reach the critical status because the process helps to understand the traffic
condition so that necessary improvements can be carried out for optimal traffic operation
(Cooley et al., 2016; Kazaura Wilfred & Burra Marco, 2017).
   With the understanding of the importance of monitoring and the lack of emphasis in the
practice of TIA, this study proposed the use of Signalised & Unsignalised Intersection Design
and Research Aid (SIDRA) intersection and Unmanned Aerial Vehicles (UAVs) footage in the
monitoring process by providing a framework in the conduct of traffic study for the monitoring
process of a development where TIA had been carried out. SIDRA intersection is a software
developed by Akcelik & Associates. It is a software that analyse signalised and unsignalised
intersections that employs lane-by-lane and vehicle drive cycle models as well as the tool for
evaluation of alternative intersection designs in terms of capacity, level of service, a wide range
of performance measures including delay, queue length, stops, fuel consumption, pollutant
emissions and operating cost. It can also perform signal timing optimization for traffic signals
with simple to most sophisticated signal phasing (Akcelik & Associates PTY LTD, 2019; Said,
2016).
   Whereas for unmanned aerial vehicles (UAVs) is had been a popular option in this era of
advance technology, commonly knowned as drones had become popular for a large variety of
civil applications. UAVs are semi-autonomous or fully autonomous aircrafts that can carry
cameras, sensors, communication equipment or other payloads. UAVs may be employed for a
wide range of transportation operations, management and planning applications: incident
response, monitor freeway conditions, coordination among a network of traffic signals, traveller
information, emergency vehicle guidance, track vehicle movements in an intersection,
measurement of typical roadway usage, monitor parking lot utilization, estimate Origin-
Destination (OD) flows (Anuj Puri, 2005; Coifman et al., 2006).
   Traffic data collection using traditional technology such as traffic sensing, inductive loop
detectors and stationary video cameras are positioned at fixed locations in the transportation
network, it can be expensive and cumbersome process (Khan, Ectors, Bellemans, Ruichek, et al.,
2018). These equipment have limited point data which cannot be used to estimate complex traffic
flow phenomenon such as the process of accumulation and dissipation of queues. Data related to
traffic flow is currently obtained from detectors embedded in pavements or pneumatic tubes
stretched across roads. Such methods do not prove to be time-efficient or cost- effective. While
these detectors do provide useful information and data about traffic flows at particular points,
they generally do not provide useful data for traffic flows over space. It is not possible to move
detectors; further, they cannot provide useful information such as vehicle trajectories, routing

 ISSN: 2005-4238 IJAST                                                                                  1182
 Copyright ⓒ 2020 SERSC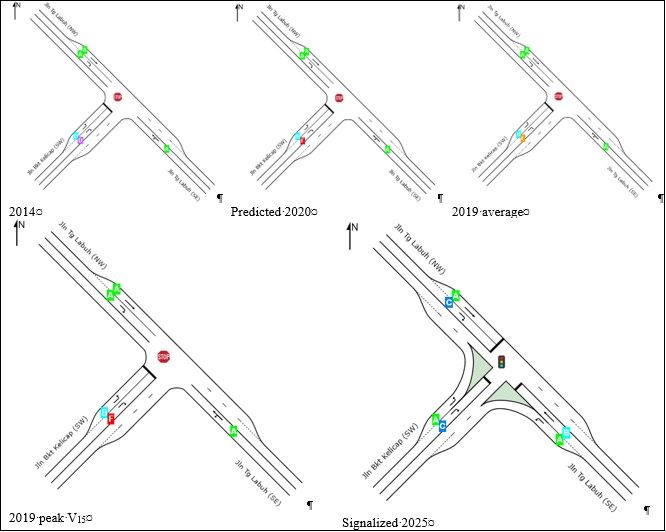
International Journal of Advance Science and Technology
                                                                         Vol. 29 No. 10S, (2020), pp. 1181-1191

information, and paths through the network. Particular, fixed video camera-based studies face a
huge problem of occlusion in which the objects of interest are hidden either partially or
completely behind other objects e.g. trees, trucks etc. Although, this problem can be solved
technically by increasing the number of cameras/sensors or manual observations, the increased
expenses and workforce deem it practically unfeasible.
   At present, ground-based solution are widely used to monitor traffic condition in a small and
fixed coverage area which is stationary and short view sight. With the use of UAVs, traffic data
collection has become dynamic with aerial photography, remote sensing and satellites. These
technologies provide wide field-of-view and unbiased data (Abdullah et al., 2015). This non-
intrusive and low-cost technology has improved rapidly and is now capable of providing high-
resolution data (both in space and time) that can be used to extract vehicle trajectories and
estimate traffic parameters (Khan, Ectors, Bellemans, Janssens, et al., 2018). The UAVs can be
particularly useful for data collection at sub-urban or such areas in the network where the
installation of fixed sensor infrastructure is not viable. The key characteristics of this technology
are its flexibility and the bird-eye view of the area of interest. Not invasive and thus, it doesn't
influence the driver behaviour. Collection of precise and accurate information about the state of
the traffic and road conditions. On the downside, this technology can be limited by climatic
factors, Instrumental factors, and restricted area (Salvo et al., 2014). The advantages of UAV had
shown the potential of this technology in overcoming the difficulties of data collection using
traditional methods.
   Congestion occurs when the demand surpasses the transportation system’s capacity as more
households could afford private vehicles (Hawa et al., 2012). Capacity is the maximum hourly
rate a facility can cater at which persons or vehicles reasonably can be expected to transverse a
point or a uniform section of a lane or roadway during a given time period under prevailing
roadway, traffic and control conditions (Transportation Research Board, 2000). To illustrate the
capacity whether is overcrowded or in a smooth traffic condition, Level of Service (LOS) is
used. LOS is one of the basic parameter in TIA, a quality measure describing the operational
conditions within a traffic stream, generally in terms of such service measures as speed and travel
time, freedom to manoeuvre, traffic interruptions, and comfort and convenience. There are six
LOS ranging from A to F, with LOS A representing the best operating conditions and LOS F the
worst. To obtain LOS, first the flow rate of the development is to be determined, the maximum
hourly rate at which persons or vehicles reasonably can expected to transverse a point or uniform
segment of a lane or roadway during a given period under prevailing road war, traffic and control
conditions while maintaining a designated LOS. Typically, the hourly service flow rate is defined
as four times the peak 15-min volume. The equivalent hourly rate at which vehicles pass over a
given point or section of lane or roadway during a given time interval of less than 1 hour, usually
15 minutes period. Common practice is to use a peak 15 minutes rate of flow expressed in
vehicles per hour (Khan, Ectors, Bellemans, Ruichek, et al., 2018; Salvo et al., 2014). Peak hour
factor represents the variation in traffic flow within an hour eq (1). For a peak hour factor of 1,
the traffic volume in every 15 minute interval is the same and therefore the traffic flow is
consistent throughout the hour eq (2). Volume and flow are variables that quantify demand, that
is, the number of vehicle (occupants or drivers) who desire to use a given facility during a
specific time period. Consideration of peak flow rates is important in capacity analysis. If the
capacity is estimated less during the peak 15-min period of flow, this is a serious problem as
volume is less than during the full hour because dissipating a breakdown of capacity can extend
congestion for up to several hours.

  PHF = hourly volume/peak flow rate                                         eq (1)

  If 15-min periods are used, PHF may be computed by
  PHF = V/ (4x V15)
  V15 = V/PHF                                                                eq (2)

 ISSN: 2005-4238 IJAST                                                                                   1183
 Copyright ⓒ 2020 SERSC
International Journal of Advance Science and Technology
Vol. 29 No. 10S, (2020), pp. 1181-1191
V15 is the flow rate for peak 15-min period (veh/h)
V is the peak-hour volume (veh/h)
PHF is the peak hour factor
3.Methodology
3.1. Study location
The study location is at Pusat Minda Emas (PuMAS) Kampus Tanjung Laboh Universiti Tun
Hussein Onn Malaysia on Lot 38, Mukim Minyak Beku, Daerah Batu Pahat, Johor Darul Ta’zim.
This 14.5 acres development is situated at a sub-urban area where TIA study was conducted in
2014, this study will investigate the current traffic conditions as part of the monitoring process
since 5 years had passed from its last study. Figure 1 is a google map depicting the position of
development location fronting Jalan Bukit Kelicap (J207) that meet at the T-intersection
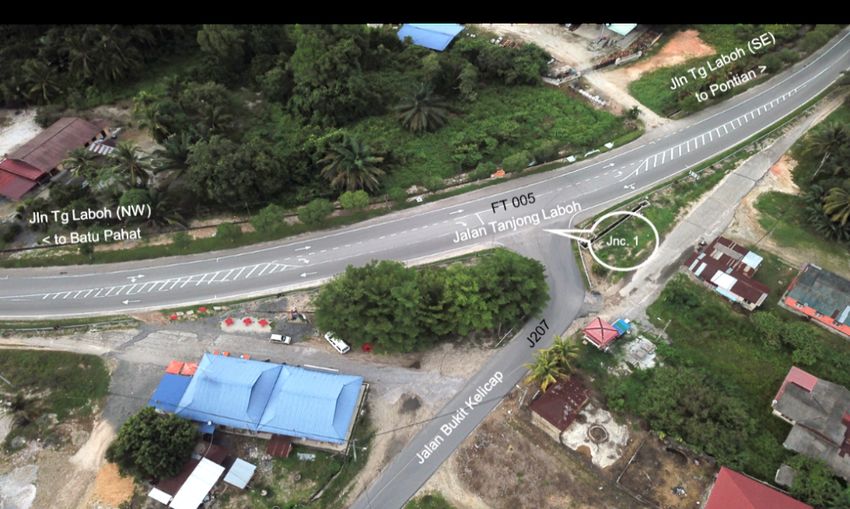
connecting the development and the main road Jalan Tanjong Labuh (FT005). Figure 2 is a UAV
photo of the intersection illustrating the survey station of Junction 1 connecting Jalan Tanjung
Labuh (FT005) and Jalan Bukit Kelicap (J207).
Figure 1. Google map of the development location (Google Maps, 2019)
Figure 2. UAV photo of junction 1
3.2. Data Collection
ISSN: 2005-4238 IJAST 1184
Copyright ⓒ 2020 SERSCInternational Journal of Advance Science and Technology
Vol. 29 No. 10S, (2020), pp. 1181-1191
The UAV used in this study is DJI mavic air platinum with the following specifications as
shown in table 1. Since a 15 minutes footage of traffic volume is sufficient as input in SIDRA
intersection to determine the LOS of the studied intersections, this UAV is chosen because it able
to produce a clear footage about 20 minutes per full battery flight minus the time for take-off and
landing of the UAV.
Table 1: Specification of UAV
Specification Detail
Flight time 30mins (one full battery)
Transmission distance 7km
Altitude 5000m above sea level
Camera 12.7mp
3.2. Design
The TIA report recorded a classified manual counts for a period of 16 hours from 6 am to 10
pm carried out on the Tuesday, 18 February 2014. The intersection movement count were done
for three consecutive expected peak hours, morning peak from 6 am to 9 am, afternoon peak 12
pm to 2 pm and evening peak 4 pm to 8 pm. From the survey results, the evening peak was
chosen for the analysis due to the highest registered traffic flow and more critical traffic peak
hour period. Jalan Tanjung Labuh was classified as a single carriageway rural highway in the
region leading to Senggarang, Rengit, Pontian, Batu Pahat, the close proximity of junction 1 to
the immediate impact from the proposed development will increase the traffic volume at the
junction. To assess the current traffic condition, intersection count was conducted at the stated
junction 1. Table 2 shows the 16 hours traffic count at FT005. The peak hour traffic is noticeably
high in the evening peak for the major road, FT005 is around 5 pm to 6pm, while on the minor
road J2017 as shown in table 3 is around 1pm to 2pm and from 6pm to 7pm. The heavy vehicles
was recorded at 1.75% for FT005. The report also stated that the historical growth of traffic in
the vicinity of the studied location indicated an average growth of about 3% for the next ten
years period.
Table 2: one day traffic volume for major road FT005
Time Towards Batu Pahat Towards Senggarang Total
600 594 240 834
700 660 267 927
800 487 316 803
900 267 319 586
1000 249 358 607
1100 263 317 580
1200 287 364 648
1300 311 281 592
1400 348 286 634
1500 333 307 640
1600 350 397 747
1700 368 601 969
1800 371 518 889
1900 241 363 604
2000 181 399 580
2100 217 319 536
TOTAL 5524 5652 11176
ISSN: 2005-4238 IJAST 1185
Copyright ⓒ 2020 SERSCInternational Journal of Advance Science and Technology
Vol. 29 No. 10S, (2020), pp. 1181-1191
Table 3: one day traffic volume for minor road J207
Time Towards Jln Tg Labuh Towards development site Total
600 37 114 151
700 53 120 173
800 42 53 95
900 35 43 78
1000 31 52 83
1100 49 56 105
1200 100 86 186
1300 63 75 138
1400 43 70 113
1500 21 47 68
1600 56 74 130
1700 83 70 153
1800 107 76 183
1900 96 68 165
2000 87 62 148
2100 78 55 133
Total 981 1121 2102
In Road Traffic Volume Malaysia (Highway Planning Unit, 2015), the road from Pontian to
Batu Pahat (Senggarang) in September 2015, the peak volume is recorded from 5 pm to 6pm
with heavy vehicles of 1.7% at a level of service A in the major road, verified the traffic volume
data collected in 2014. Based on this, the 15 minutes footages were taken from 5pm to 6pm on
Tuesday in order to determine the comparative traffic data of the intersection. Other information
of the road are shown in Table 4 below. With the 15 minutes footage of the traffic condition at
Junction 1, observational method and traffic count was carried out. Overall, the steps taken for
the monitoring process are (1) determine the peak hour volume; (2) data collection with UAV
video recording; (3) determine the current traffic volume from the 15 minutes footage of the
intersection during peak hour; (4) with the traffic volume, identify the LOS of the intersection
using SIDRA; and (5) determine the impacts of the traffic condition, hence propose mitigation
measures or improvements.
Table 4: Design of junction 1
Design Standard JKR R2 Type 1
Design speed 60 km/h
Operational speed 60 km/h
Lane width (min) 3 m (min)
Level of service method Delay and v/c (HCM 2010)
4. Results and Findings
4.1. Video-Traffic Volume Count
Table 5 tabulated the traffic count from the 15 minutes footage taken from junction 1. Data
was collected on alternative Tuesday as each visit only allowed 2 takes. For study purposes, data
was collected 3 times to obtain the average, there were no significant difference between the
collected data from each visit. Two methods of peak hour volume is counted for this study, firstly
is counting by the average volume from each 15 minutes. Secondly is to multiply the peak
volume from each 15 minutes session by four to obtain the highest peak volume, to understand
how it would affect the LOS of the junction. Based on this table the average traffic count and
peak volume was taken as input in SIDRA to determine the LOS. Table 6 is average volume sum
up as the hourly traffic volume, while table 7 is the highest recorded traffic volume in each 15
ISSN: 2005-4238 IJAST 1186
Copyright ⓒ 2020 SERSCInternational Journal of Advance Science and Technology
Vol. 29 No. 10S, (2020), pp. 1181-1191
minutes multiply with 4. From table 8, the traffic volume obtained in 2019 were higher than the
predicted traffic volume in 2020 recorded in the TIA report, although there is no significant
increase, this added traffic volume had changed the LOS of junction 1 as shown in Figure 3.
Table 5: 15 Minutes Traffic Volume Count
Jln Tg Labuh (SE) Jln Tg Labuh (NW) Jln Bkt Kelicap
Date Time
Through Left Through Right Left Right
18/6/2019 5.00-5.15 93 14 125 3 4 37
9/7/2019 89 12 132 2 3 30
16/7/2019 82 11 135 1 3 28
Average 88 12 131 2 3 37
13/8/2019 5.15-5.30 107 15 141 1 3 21
20/8/209 110 13 158 2 2 23
10/9/2019 98 16 149 1 4 25
Average 105 15 149 1 3 23
18/6/2019 5.30-5.45 94 10 154 1 4 27
9/7/2019 96 15 148 3 5 23
16/7/2019 89 13 164 3 3 26
Average 93 13 155 2 4 25
13/8/2019 5.45-6.00 89 19 165 1 4 28
20/8/209 97 18 156 2 4 32
10/9/2019 94 16 159 3 2 25
Average 94 18 160 2 3 28
Table 6: Average volume
Jln Tg Labuh (SE) Jln Tg Labuh (NW) Jln Bkt Kelicap
Time Through Left Through Right Left Right
5.00-5.15 88 12 131 2 3 37
5.15-5.30 105 15 149 1 3 23
5.30-5.45 93 13 155 2 4 25
5.45-6.00 94 18 160 2 3 28
Total 380 58 595 7 13 113
Table 7: Total one hour volume count based on peak V15 x 4.
Jln Tg Labuh (SE) Jln Tg Labuh (NW) Jln Bkt Kelicap
Through Left Through Right Left Right
Peak V15 107 19 165 3 4 37
V60 = V15 x 4 428 76 660 12 16 148
Table 8: Peak hour traffic volume based on each year
Jln Tg Labuh (SE) Jln Tg Labuh (NW) Jln Bkt Kelicap
Through Left Through Right Left Right
2014 379 72 619 7 13 81
2019 average 380 58 595 7 13 113
2019 peak V15 428 76 660 12 16 148
Predicted 2020 439 78 718 7 14 85
2025 (signalised junction) 509 97 832 10 18 109
ISSN: 2005-4238 IJAST 1187
Copyright ⓒ 2020 SERSCInternational Journal of Advance Science and Technology
Vol. 29 No. 10S, (2020), pp. 1181-1191
Figure 3. LOS at junction 1 on each analysis year
4.2. Level of Service and degree of saturation
From the SIDRA analysis of LOS, in 2014 the junction is in LOS D and predicted
deterioration in 2020 to LOS F. The average traffic volume in 2019 resulted in the junction to be
in LOS E, by highest peak V15 the LOS deteriorate to LOS F. From all analysis year the major
road is at LOS A. The junction during peak hour will result in congestion in the right turning of
the minor road J207, since it is a stop T-intersection, the traffic in the minor road is to give way
to the major road as vehicles from the major raod have the right of way. To overcome this
congestion in the minor road, signalised traffic junction is proposed where in 2025 capable for
higher traffic volume, the previous right turn in the minor road will perform in LOS C. However,
this also effect the other leg of junction and lowered the LOS, overall the junction will still
performed in LOS C which is more than the required baseline condition of LOS D (Road
Engineering Asscociation of Malaysia & Jabatan kerja Raya Malaysia, 2011).
In table 9 summarised the performance of the junction, there is a degrading trend in LOS as
the traffic volume increases over the years. The degree of saturation also increases over the years,
more than 1 shows high degree of saturation or oversaturated indicating bad or lengthy
congestion, constrain to the freedom of movement, lower than one means low degree of
saturation indicating acceptable level of momentary congestion, lower than 0.75 degree of
saturation indicates good and smooth traffic (Mohammed Omar & Mohammed, 2013; Susilo &
Imanuel, 2018). With the current traffic volume, there is momentary congestion mainly in the
minor leg or a bad congestion based on the highest peak V15.
Table 9: Performance Junction 1 with each analysis year
Total Deg. Satn Average Level of Average
veh/h v/c delay sec service speed km/h
2014 1208 0.431 2.7 D 57.3
Predicted 2020 1409 0.755 4.9 F 55.4
2019 average 1227 0.628 4.3 E 55.9
2019 peak V15 1411 1.101 14.5 F 48.1
2019 peak V15 (signalised) 1411 0.620 11.4 B 50.4
2025 (signalised) 1658 0.710 10.8 B 50.9
ISSN: 2005-4238 IJAST 1188
Copyright ⓒ 2020 SERSCInternational Journal of Advance Science and Technology
Vol. 29 No. 10S, (2020), pp. 1181-1191
5. Discussion
UAV is suitable for monitoring as the footage able to show the traffic condition of the moment
and the driving behaviour of the studied location. Besides, the video can be advanced or reversed
on a frame-by-frame basis, allowing the observers greater efficiency and flexibility in locating
particular events precisely in time. Using UAV able to obtain the real driving behaviour without
the influence of stationary camera that will disrupt the drivers’ attention, this non-invasive
method is used to determine the level of congestion, aggressiveness and traffic violation by
drivers. (Abdullah et al., 2015; Salvo et al., 2014). In this study, the use of SIDRA intersection
and UAV footage is able to provide an overall understanding of studied location with less
complexity and without hassle in hope to promote the practice of traffic monitoring mainly in the
practice of TIA in Malaysia. The traffic volume data collection using UAV able to reduce error
as manual counter especially in complex intersection where it can be challenging to accurately
count each vehicles that passes by. Setting up static camera had limited ability to clearly cover
the whole transportation system and is costly to set up in large quantity. Besides, video data not
only allows observer to counter check the collected data, it also allow the study of driving
behaviour of the traffic and transportation system. Now, with real time video processing of UAV
and video transmission to ground station, the use of UAV has a great prospect in traffic
management and monitoring process (Barmpounakis et al., 2016).
Based on the video observation of 15 minutes UAV footages, the number of times of clear
traffic in the major leg in more than sufficient for the amount of vehicles entering and existing
the minor leg. During peak hours when there are activities at the studied location resulted in a
sudden increase in the traffic volume. However, on the day to day basis, there is very little traffic
at the studied development location, most of the manoeuvres are the local residents from the
surrounding households. At times, it can be observed there is little to no traffic on the minor road
during off peak hours. Thus, the recommended mitigation measure of installation of traffic signal
is not ideal at the moment, as the probability of red runners would happen. Due to human factors
(time of the day, traffic violation), engineering factors (traffic signal setting, traffic volume,
traffic features) and environment factors (weather, enforcements), improper installation of traffic
signal and setting will lead to frustrations on road (Abd Rahman et al., 2019; M.S. Nemmang et
al., 2017; Mohd Shafie Nemmang & Rahman, 2016). The lack of enforcements in the rural area,
violation rates are higher (Yan et al., 2016), with the poor traffic signal timing will lead to
aggressive and frustration among the drivers (Ismail et al., 2016) mainly the locals who are
familiar with the road (Payyanadan et al., 2018) and are used to driving a high approaching
speed. In a hurry and out of frustration especially in peak hours when the traffic volume builds
up on the road, drivers tend to speed up to beat the red light and speeding through yellow light or
amber time before it turns red (Khabiri, 2018). A good signal operation may reduce red runner,
reduce crashes, decrease fatalities and maintain average travel speed. However, the influence of
Malaysia’s socio-demographic factor and lifestyle, installation of actuated traffic signal is more
suitable in preventing red runners from happening (Hawa et al., 2012).
6. Conclusion
The monitoring process of the traffic impact for the development location at PuMAS UTHM
at Junction 1 connecting J207 on the minor road to the major road on FT005 was conducted
using UAV and the traffic volume was collected for SIDRA intersection analysis for LOS to
determine the performance of the intersection. The junction is currently performing at worst in
LOS F, with a degree of saturation of more than 1 indicating bad congestion especially in the
minor leg of right turn. The suggested mitigation measure is the installation of traffic signal. At
this moment, this installation fixed-time traffic signal is not recommended because high traffic
volume only occurs when there is large manoeuvre that do not occur frequently. Hence, the
actuated traffic signal is more suitable to prevent red runners that would lead to accidents.
The monitoring process using UAV for traffic volume data collection had been a promising
method, the operation of UAV does not required large number of manpower, less complex from
ISSN: 2005-4238 IJAST 1189
Copyright ⓒ 2020 SERSCInternational Journal of Advance Science and Technology
Vol. 29 No. 10S, (2020), pp. 1181-1191
on ground equipment, better view of the road network. Video recording of UAV promotes
accuracy, wider coverage of the observed network, additional information such as driving
behaviour and with the advancement in the footage can be analysed with computed techniques.
Using the steps listed in this study, the use of UAV and SIDRA in monitoring process is feasible
to encourage the conduct of monitoring process to be included in TIA so that proper mitigation
measures can be carried out to manage, control and prevent the traffic impacts from effecting the
existing road network.
Acknowledgement
This work is financially supported by the Research Management Centre, RMC of Universiti
Tun Hussein Onn Malaysia, UTHM under Geran Penyelidikan Pascasiswazah [vote number:
H301] and TIER 1 [vote number: H220]. This research also obtained supports from the Research
Center for Soft Soil (RECESS UTHM).
References
[1] Abd Rahman, R., Lausman, N., Lim, W. M., Mashros, N., Mohd Masirin, M. I., Mustapa, M. S., & Hassan, M. F.
(2019). The Compliance of Road Users with the Speed Limit at School Zones on Federal Road FT50 (KM0-
KM23). International Journal of Engineering and Advanced Technology, 50(5), 922–929.
https://doi.org/10.35940/ijeat.E1131.0585C19
[2] Abdullah, A., Bakar, E. A., & Pauzi, M. Z. M. (2015). Monitoring of traffic using unmanned aerial vehicle in
Malaysia landscape perspective. Jurnal Teknologi, 76(1), 367–372. https://doi.org/10.11113/jt.v76.4043
[3] Akcelik & Associates PTY LTD. (2019). Overview of SIDRA Intersection.
http://www.sidrasolutions.com/Software/INTERSECTION/Overview
[4] Anuj Puri. (2005). A survey of unmanned aerial vehicles (UAV) for traffic surveillance. In Department of
computer science and engineering, University of South Florida.
[5] Barmpounakis, E. N., Vlahogianni, E. I., & Golias, J. C. (2016). Unmanned Aerial Aircraft Systems for
transportation engineering: Current practice and future challenges. International Journal of Transportation
Science and Technology, 5(3), 111–122. https://doi.org/10.1016/j.ijtst.2017.02.001
[6] Coifman, B., McCord, M., Mishalani, R. G., Iswalt, M., & Ji, Y. (2006). Roadway traffic monitoring from an
unmanned aerial vehicle. IEE Proceedings: Intelligent Transport Systems, 153(1), 11–20.
https://doi.org/10.1049/ip-its:20055014
[7] Cooley, K., De Gruyter, C., & Delbosc, A. (2016). A best practice evaluation of traffic impact assessment
guidelines in Australia and New Zealand. Australasian Transport Research Forum, November, 1–21.
[8] Google Maps. (2019). PuMas UTHM.
https://www.google.com/maps/@1.7517587,102.9933202,1567m/data=!3m1!1e3
[9] Hawa, M. J., Akmalia, S., & Ho, J. S. (2012). A case study of the prevalence and characteristics of red light
runners in Malaysia. Injury Prevention, 18(Suppl 1), A201.2-A201. https://doi.org/10.1136/injuryprev-2012-
040590t.9
[10] Highway Planning Unit. (2015). Road Traffic Volume Malaysia (RTVM).
[11] Hokao, K., & Mohamed, S. S. (1999). Traffic Impact Mitigation for New Developments: A Way to Reduce
Traffic Congestion in Major Cities. Transport and Communications Bulletin for Asia and the Pacific, 68, 1–32.
[12] Ismail, W. A., Endut, I. R., Ishak, S. Z., & Hamidun, R. (2016). Engineering Factors of Motorcyclist Red Light
Runner in Malaysia. Proceedings of the International Civil and Infrastructure Engineering Conference 2015.
https://doi.org/10.1007/978-981-10-0155-0
[13] Jabatan Kerja Raya Malaysia. (2018). Guidelines for Traffic Impact Assessment ATJ 38/2018.
[14] Kazaura Wilfred, G., & Burra Marco, M. (2017). Land Use Change and Traffic Impact Analysis in Planned
Urban Areas in Tanzania: The Case of Dar es Salaam City. Current Urban Studies, 5(1), 1–19.
https://doi.org/10.4236/cus.2017.51001
[15] Khabiri, M. (2018). Assessing Behavioral Patterns of Motorcyclists Based on Traffic Control Device at City
Intersections by Classification Tree Algorithm. International Journal of Transportation Engineering, 5(4), 415–
501.
ISSN: 2005-4238 IJAST 1190
Copyright ⓒ 2020 SERSCInternational Journal of Advance Science and Technology
Vol. 29 No. 10S, (2020), pp. 1181-1191
[16] Khan, M. A., Ectors, W., Bellemans, T., Janssens, D., & Wets, G. (2018). Unmanned aerial vehicle-based traffic
analysis: A case study for shockwave identification and flow parameters estimation at signalized intersections.
Remote Sensing, 10(3). https://doi.org/10.3390/rs10030458
[17] Khan, M. A., Ectors, W., Bellemans, T., Ruichek, Y., Yasar, A. U. H., Janssens, D., & Wets, G. (2018).
Unmanned Aerial Vehicle-based Traffic Analysis: A Case Study to Analyze Traffic Streams at Urban
Roundabouts. Procedia Computer Science, 130, 636–643. https://doi.org/10.1016/j.procs.2018.04.114
[18] Lidasan, H. S., Espada, I. C., & De Leon, M. R. C. (2010). A Needs Assessment of Transport Planning and
Traffic Management of Local Cities: The Case of the Philippines. Journal of the Eastern Asia Society for
Transportation Studies, 8, 16–27.
[19] Lim, W. M., Abd Rahman, R., Hassan, M. F., Mashros, N., Md Diah, J., & Mohd Masirin, M. I. (2019).
Knowledge Assessment of the Practice of Traffic Impact Assessment among the Authority in Johor, Malaysia.
6th International Conference on Business, Science and Technology (ICBST 2019).
[20] Lim, W. M., Abd Rahman, R., Hassan, M. F., Md Diah, J., Mashros, N., Abdullah, M. E., & Mohd Masirin, M. I.
(2019). An Overview of the Practice of Traffic Impact Assessment in Malaysia. International Journal of
Innovative Technology and Exploring Engineering, 8(5), 914–921. https://doi.org/10.35940/ijeat.E1130.0585C19
[21] Lim, W. M., Abd Rahman, R., Hassan, M. F., & Md Rohani, M. (2019). The study on the level of knowledge of
the approving authority in the practice of traffic impact assessment ( TIA ) report submission in Malaysia : case
study in Johor The study on the level of knowledge of the approving authority in the practice of traff. Conference
Series: Materials Science and Engineering, 512(1), 012024. https://doi.org/10.1088/1757-899X/512/1/012024
[22] Mohammed Omar, A. A., & Mohammed, J. (2013). Traffic Flow Analysis For Intersection Using Computer
Simulation Aasidra Software: A Case Study In Bangi Malaysia. Tikrit Journal of Engineering Sciences, 20(4),
10–25.
[23] Nemmang, M.S., Rahman, R., Rohani, M. M., Mashros, N., & Md. Diah, J. (2017). Analysis of speeding
behaviour during approaching the U-turn facility road segment based on driving simulation test. Matec Web of
Conferences, 103, 08008. https://doi.org/10.1051/matecconf/201710308008
[24] Nemmang, Mohd Shafie, & Rahman, R. (2016). An Overview of vehicles lane changing model development in
approaching at u-turn facility road segment. Jurnal Teknologi, 78, 59–66.
[25] Payyanadan, R. P., Sanchez, F. A., & Lee, J. D. (2018). Influence of Familiarity on the Driving Behavior , Route
Risk , and Route Choice of Older Drivers. IEEE Transactions on Human-Machine Systems, PP, 1–10.
https://doi.org/10.1109/THMS.2018.2874180
[26] Road Engineering Asscociation of Malaysia, & Jabatan kerja Raya Malaysia. (2011). Guidelines for Traffic
Impact Assessment (REAM-GL 10/2011).
[27] Said, M. S. (2016). Determination of Peak Hours And Level Of Service At An Unsignalised Intersection Using
aaSIDRA 2.0. IOSR Journal of Mechanical and Civil Engineering (IOSR-JMCE), 13(5), 53–59.
https://doi.org/10.9790/1684-1305075359
[28] Salvo, G., Caruso, L., & Scordo, A. (2014). Gap acceptance analysis in an urban intersection through a video
acquired by an UAV. Recent Advances in Civil Engineering and Mechanics, 199–205.
[29] Susilo, B. H., & Imanuel, I. (2018). Traffic congestion analysis using travel time ratio and degree of saturation on
road sections in Palembang, Bandung, Yogyakarta, and Surakarta. MATEC Web of Conferences, 181.
https://doi.org/10.1051/matecconf/201818106010
[30] Teodoro, R. V. R., Jose Regin, F., & Rene Val, R. (2005). Traffic impact assessment for sustainable traffic
management and transportation planning in urban areas. Proceedings of the Eastern Asia Society for
Transportation Studies, 5, 2342–2351.
[31] The Commissioner of Law Revision Malaysia. (2006). Act 172- Town and Country Planning Act 1976. In Law
of Malaysia. The Commissioner of Law Revision Malaysia.
[32] Transportation Research Board. (2000). Highway capacity manual.
[33] Van Rensburg, J. F., & Van As, S. C. (2004). Issues with Traffic Impact Assessments. Proceedings of the 23rd
Southern African Transport Conference, 12, 654–661.
[34] Yan, F., Li, B., Zhang, W., & Hu, G. (2016). Red-light running rates at five intersections by road user in
Changsha, China: An observational study. Accident Analysis and Prevention, 95, 381–386.
https://doi.org/10.1016/j.aap.2015.06.006
ISSN: 2005-4238 IJAST 1191
Copyright ⓒ 2020 SERSCYou can also read