Bedside calculation of mechanical power during volume- and pressure-controlled mechanical ventilation
←
→
Page content transcription
If your browser does not render page correctly, please read the page content below
Chiumello et al. Critical Care   (2020) 24:417
https://doi.org/10.1186/s13054-020-03116-w

 RESEARCH                                                                                                                                             Open Access

Bedside calculation of mechanical power
during volume- and pressure-controlled
mechanical ventilation
Davide Chiumello1,2,3* , Miriam Gotti1, Mariateresa Guanziroli1,2, Paolo Formenti1, Michele Umbrello1,
Iacopo Pasticci1,2, Giovanni Mistraletti1,4 and Mattia Busana5

  Abstract
  Background: Mechanical power (MP) is the energy delivered to the respiratory system over time during
  mechanical ventilation. Our aim was to compare the currently available methods to calculate MP during volume-
  and pressure-controlled ventilation, comparing different equations with the geometric reference method, to
  understand whether the easier to use surrogate formulas were suitable for the everyday clinical practice. This would
  warrant a more widespread use of mechanical power to promote lung protection.
  Methods: Forty respiratory failure patients, sedated and paralyzed for clinical reasons, were ventilated in volume-
  controlled ventilation, at two inspiratory flows (30 and 60 L/min), and pressure-controlled ventilation with a similar
  tidal volume. Mechanical power was computed both with the geometric method, as the area between the
  inspiratory limb of the airway pressure and the volume, and with two algebraic methods, a comprehensive and a
  surrogate formula.
  Results: The bias between the MP computed by the geometric method and by the comprehensive algebraic
  method during volume-controlled ventilation was respectively 0.053 (0.77, − 0.81) J/min and − 0.4 (0.70, − 1.50) J/
  min at low and high flows (r2 = 0.96 and 0.97, p < 0.01). The MP measured and computed by the two methods
  were highly correlated (r2 = 0.95 and 0.94, p < 0.01) with a bias of − 0.0074 (0.91, − 0.93) and − 1.0 (0.45, − 2.52) J/
  min at high-low flows. During pressure-controlled ventilation, the bias between the MP measured and the one
  calculated with the comprehensive and simplified methods was correlated (r2 = 0.81, 0.94, p < 0.01) with mean
  differences of − 0.001 (2.05, − 2.05) and − 0.81 (2.11, − 0.48) J/min.
  Conclusions: Both for volume-controlled and pressure-controlled ventilation, the surrogate formulas approximate
  the reference method well enough to warrant their use in the everyday clinical practice. Given that these formulas
  require nothing more than the variables already displayed by the intensive care ventilator, a more widespread use
  of mechanical power should be encouraged to promote lung protection against ventilator-induced lung injury.
  Keywords: Mechanical power, Mechanical ventilation, Ventilator-induced lung injury, Acute respiratory distress
  syndrome, Lung protective ventilation, Acute respiratory failure, Driving pressure, Lung protection, Respiratory
  failure, Respiratory rate

* Correspondence: davide.chiumello@unimi.it
1
 SC Anestesia e Rianimazione, Ospedale San Paolo – Polo Universitario, ASST
Santi Paolo e Carlo, Via Di Rudinì, 8, 20142 Milan, Italy
2
 Dipartimento di Scienze della Salute, Università degli Studi di Milano, Milan,
Italy
Full list of author information is available at the end of the article

                                          © The Author(s). 2020 Open Access This article is licensed under a Creative Commons Attribution 4.0 International License,
                                          which permits use, sharing, adaptation, distribution and reproduction in any medium or format, as long as you give
                                          appropriate credit to the original author(s) and the source, provide a link to the Creative Commons licence, and indicate if
                                          changes were made. The images or other third party material in this article are included in the article's Creative Commons
                                          licence, unless indicated otherwise in a credit line to the material. If material is not included in the article's Creative Commons
                                          licence and your intended use is not permitted by statutory regulation or exceeds the permitted use, you will need to obtain
                                          permission directly from the copyright holder. To view a copy of this licence, visit http://creativecommons.org/licenses/by/4.0/.
                                          The Creative Commons Public Domain Dedication waiver (http://creativecommons.org/publicdomain/zero/1.0/) applies to the
                                          data made available in this article, unless otherwise stated in a credit line to the data.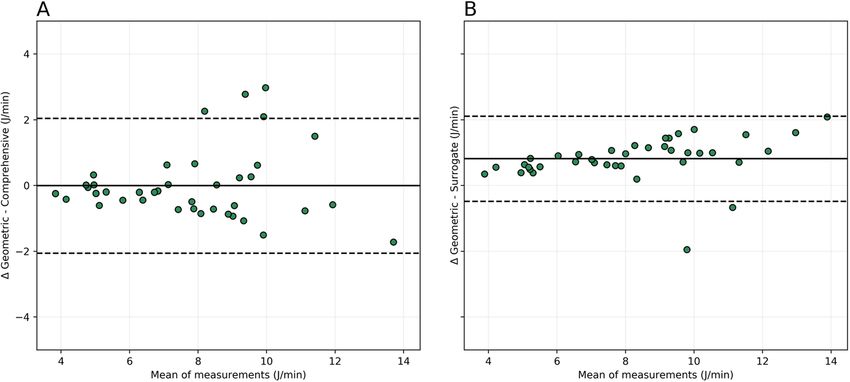
Chiumello et al. Critical Care   (2020) 24:417                                                                  Page 2 of 8

Introduction                                                  controlled ventilation with constant inspiratory flow in
According to a recent international observational study,      sedated patients with no spontaneous respiratory drive.
acute respiratory distress syndrome (ARDS) is reported        During pressure-controlled ventilation, in which the air-
in up to 10% of total intensive care admissions and 20%       way pressure is held constant, and the flow is deceler-
of all patients who require mechanical ventilation [1].       ated during the mechanical breath, two alternative
Mechanical ventilation remains a cornerstone of ARDS          equations have been suggested [19, 20].
management [2, 3] as it improves the severe hypoxemia           The aim of this study was to compare the geometric
and reduces the work of breathing. However, the mech-         method to measure MP, considered the reference stand-
anical forces (pressure, volume, and flow) generated by       ard, with the algebraic formulas, both for volume and
the interactions between the ventilator and the respira-      pressure-controlled ventilation in a group of sedated and
tory system can further damage the lung, a process            paralyzed patients, to understand whether the easier to
known as ventilator-induced lung injury (VILI) [4]. To        use surrogate formulas were suitable for the everyday
limit VILI, several recommendations based primarily on        clinical practice. This would warrant a more widespread
the tidal volume [5], driving pressure [6], and positive      use of mechanical power to promote lung protection.
end-expiratory pressure (PEEP) have been put forward
[7]. More recently, the inspiratory flow [8] and respira-     Materials and methods
tory rate [9] have also been recognized as possible fac-      Study population
tors promoting VILI.                                          Patients admitted to the intensive care unit from January
  To combine all these elements in a single physical          to June 2018 after elective surgery (excluding thoracic
variable, Gattinoni et al. proposed the concept of mech-      and cranial surgery) or with medical disease were con-
anical power (MP) to estimate the contribution of the         sidered eligible. The study was approved by the institu-
various ventilator-related causes of lung injury [10]. MP     tional review board of our hospital (Comitato Etico
is the energy delivered to the respiratory system over        Interaziendale Milano Area A 1, n. 628), and informed
time, which is the product of the absolute proximal air-      consent was obtained according to Italian regulations.
way pressure and related changes in volume and respira-       Exclusion criteria were hemodynamic instability (systolic
tory rate [10]. Animal data showed that increasing MP         arterial pressure < 100 mmHg) and COPD (Gold stages
was associated with an increase in lung edema and lung        3 and 4).
damage [11–13]. Furthermore, two studies in patients
with and without ARDS found that MP computed dur-             Study design
ing the first days of mechanical ventilation was inde-        Critically ill patients with acute respiratory failure, kept
pendently associated with mortality, which rose               in supine position and sedated and paralyzed for clinical
significantly above a certain level of MP [14, 15]. Never-    reasons, were ventilated in volume-controlled mode with
theless, although MP can be used at the bedside, it is ra-    a tidal volume of 6–8 mL/kg of predicted body weight
ther cumbersome to be calculated, a factor that heavily       with two inspiratory flows (high, 60 L/min, and low, 30
hinders its use in clinical practice [8, 16, 17].             L/min), with a square waveform. Subsequently, pressure-
  Two methods can be employed to calculate MP, a dir-         controlled ventilation was applied to reach the same
ect measurement, as the dynamic inspiratory area of the       tidal volume as volume-controlled ventilation. PEEP and
airway pressure and volume curve during the respiratory       respiratory rates were not changed throughout the
cycle (i.e., the geometric method), or using equations.       study.
One of the first equations proposed to compute the MP
requires the knowledge of several elements such as the        Measurements
tidal volume, respiratory rate, elastance, resistance, and    The inspiratory flow rate was measured with a heated
inspiratory time [10], variables for which an inspiratory     pneumotachograph (Fleisch no. 2, Fleisch, Lausanne,
hold is necessary in order to adequately distinguish be-      Switzerland). Airway pressure was measured proximally
tween the resistive and the elastic components of airway      to the endotracheal tube with a dedicated pressure
pressure. In order to facilitate the calculation of MP, the   transducer (MPX 2010 DP, Motorola, Solna, Sweden).
original equation was proposed in a simplified form re-       Flow and airway pressure were collected at a sampling
quiring only the measurement of airway plateau pres-          rate of 100 Hz and stored for analysis (Colligo, Elekton,
sure, PEEP, and tidal volume. With the same aim, Giosa        Milan, Italy).
et al. [18] described an even simpler equation which did        The following variables were measured in each condi-
not require an inspiratory hold, trading a small degree of    tion: tidal volume, inspiratory time, peak airway pres-
accuracy to allow the continuous display by the ventila-      sure, plateau airway pressure, and PEEP during an end-
tor with no action from the clinician. However, both          inspiratory and expiratory pause. Means were computed
these equations can be used only during volume-               over five consecutive breaths.
Chiumello et al. Critical Care     (2020) 24:417                                                                                  Page 3 of 8

Computation of mechanical power                                                has been considered sufficiently accurate to represent a
Geometric method                                                               general population of intubated and mechanically venti-
During volume- and pressure-controlled ventilation, the                        lated patients. Expressing that value in cmH2O min l−1
MP was measured as the energy per breath (the area be-                         allows to lump together the term resistances
tween the inspiratory limb of the airway pressure curve                        (cmH2O min l−1) × inspiratory flow (l/min).
and the volume (y-axis) (Figure S1), expressed in Joules
and multiplied by the respiratory rate (J/min) [10, 21].                                                          Inspiratory flow
                                                                                       VE∙ Peak pressure þ PEEP þ
                                                                                                                          6
                                                                                  MP ¼
Calculation of MP during volume-controlled ventilation                                                      20
MP can be calculated with two algebraic formulas: a                            where VE is the minute ventilation expressed in l/min.
comprehensive and a surrogate. Overall, the equations                          Peak pressure and PEEP are expressed in cmH2O. In-
described below have the aim to approximate the geo-                           spiratory flow/6 turns out to be also a pressure term, fol-
metric area of the dynamic pressure-volume curve start-                        lowing the explanation above. Clearly, the more the true
ing from the variables usually measured at the bedside.                        airway resistances of the patient are far from the hypo-
One general assumption that needs to be considered is                          thetical value of 10 cmH2O s l−1, the greater the error
that, in all these equations, the respiratory system is con-                   made. Nevertheless, in the original paper, even for values
sidered as one single compartment (i.e., with only one                         greater than 15 cmH2O s l−1, the bias remained reason-
time constant, the product of resistances and compli-                          ably low.
ance). In most of the cases, this seems a reasonable ap-
proximation of the reality.                                                    Calculation of MP during pressure-controlled ventilation
                                                                               The MP was calculated with a comprehensive and a sur-
Comprehensive formula                                                          rogate formula.
By “comprehensive,” we mean an equation that takes
into account both the resistive and elastic components                         Comprehensive formula
of the mechanical breath, giving a more accurate meas-
                                                                                                     h                     − T insp i
urement of MP. It requires an inspiratory hold. This                              MP ¼ 0:098∙RR∙V t ∙ PEEP þ ΔP insp ∙ 1 − e RC
equation derives from a mathematical simplification of
the original mechanical power formula [10], with the ad-
                                                                               where ΔPinsp is the pressure (cmH2O) above PEEP dur-
vantage that the calculation starts from the measured
                                                                               ing pressure-controlled ventilation, Tinsp is the inspira-
peak, plateau, and end-expiratory pressure, allowing a
                                                                               tory time (s), and C and R are the respiratory system
much faster bedside computation.
                                                                               compliance (ml/cmH2O) and resistances (cmH2O s l−1),

                                                1                              respectively. Compliance and respiratory system resist-
 MP ¼ 0:098∙RR∙V t ∙ Peak inspiratory pressure − ðPlateau pressure − PEEPÞ
                                                2                              ance (airways and tissue resistances) were calculated
                                                                               during end-expiratory and end-inspiratory pauses from
where 0.098 is a conversion factor from cmH2O l min−1in
                                                                               the data when the patient was ventilated in volume-
J/min, RR is the respiratory rate, and Vt is the tidal vol-
                                                                               controlled mode with an inspiratory flow of 30 L/min.
ume in liters. The term (Plateau pressure − PEEP) is the
                                                                               The main assumption in this equation is that airway re-
driving pressure. As stated in the original paper describ-
                                                                               sistances are considered constant throughout the breath,
ing the formula [10], being mathematically identical to
                                                                               which is not necessarily true, as resistances are also a
the original equation, it suffers from the same limita-
                                                                               function of flow, which varies during pressure-controlled
tions: the compliance of the respiratory system is consid-
                                                                               ventilation.
ered linear over the range of pressure and volumes
considered.
                                                                               Surrogate formula

Surrogate formula                                                                 MP ¼ 0:098∙RR∙V t ∙ PEEP þ ΔP insp
We use the term “surrogate” to mean an equation that is
easier to calculate than the comprehensive one, as no in-                      where 0.098 is a conversion factor from cmH2O l min−1
spiratory hold is required. The rationale behind this sim-                     in J/min, RR is the respiratory rate, and Vt is the tidal
plified equation is to trade a certain degree of accuracy                      volume in liters. PEEP and ΔPinsp is the pressure
for ease of calculation at the bedside. The equation, re-                      (cmH2O) above PEEP during pressure-controlled venti-
cently proposed by Giosa et al. [18], aims to simplify the                     lation. This extremely simplified equation works under
calculations offering an easy to remember equation                             the assumption that the delivered pressure wave is per-
mainly dealing with the problem of the airway resis-                           fectly squared. In the original paper, this assumption
tances. In the original paper, a value of 10 cmH2O s l−1                       proved to hold reasonably well [19].
Chiumello et al. Critical Care (2020) 24:417 Page 4 of 8
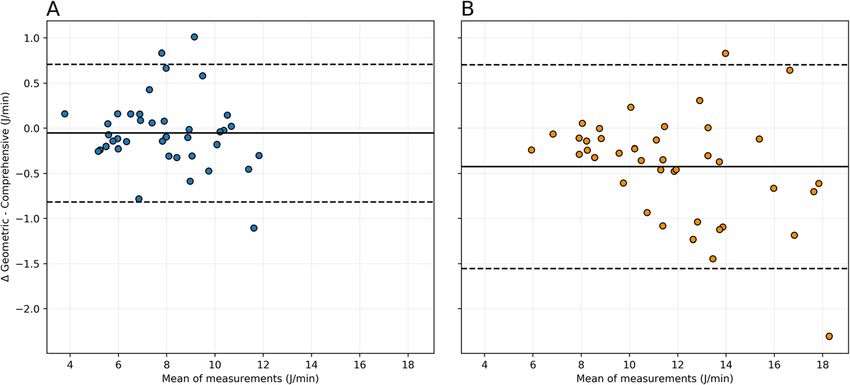
Statistical analysis Figure S3. The two methods were closely correlated
The MP measured by the geometric method and calcu- (r2 = 0.96, p < 0.001, and r2 = 0.97, p < 0.001). The Bland-
lated with both the comprehensive and surrogate alge- Altman analyses are reported in Fig. 1. For an inspira-
braic formulas were compared with the Bland-Altman tory flow of 30 L/min, the mean difference was − 0.053 J/
technique and linear regression. The absolute error was min with upper and lower limits of agreement (± 1.96
calculated as (1.96*SD)/mean of the reference. A re- SD) of 0.77 and − 0.81 J/min; for an inspiratory flow of
peated measures ANOVA was used to establish the dif- 60 L/min, the mean difference was − 0.4 J/min with
ference between the MP delivered in the volume- and upper and lower limits of agreement of 0.7 and − 1.5 J/
pressure-controlled ventilation modes. p values at the min. The MP calculated with the surrogate equation was
post hoc analysis were adjusted with the Bonferroni cor- also closely correlated (r2 = 0.95 and 0.94) with bias of −
rection, and two-tailed p values < 0.005 were considered 0.0074 (0.91, − 0.93) and − 1.0 (0.45, − 2.52) J/min at low
statistically significant. Statistical analysis was done with and high inspiratory flows (Fig. 2 and S4).
Jupyter (Python 3.7) and the Pandas, Numpy, Statsmo-
dels, and Pingouin packages. Pressure-controlled mechanical ventilation
The regression between the MP computed by the geo-
Results metric method and comprehensive algebraic formula is
Forty patients were enrolled. Table 1 reports their main shown in Figure S5, left panel. The two methods were
clinical characteristics. The mean applied tidal volumes closely correlated (r2 = 0.81, p < 0.001). The Bland-
during volume-controlled ventilation at 30 and 60 L/min Altman analyses are reported in Fig. 3a. The mean dif-
flow and pressure-controlled ventilation were 419 ± 68 ference was − 0.001 J/min, with upper and lower limits
mL (flow 30 L/min), 398 ± 73 mL (flow 60 L/min), and of agreement 2.05 and − 2.05 J/min.
422 ± 66 mL. Minute ventilation was 6.0 ± 1.3 L/min The MP with the surrogate equation were closely cor-
(flow 30 L/min), 5.7 ± 1.3 L/min (flow 60 L/min), and related (r2 = 0.94, p < 0.001) with a bias of − 0.81 J/min
6.0 ± 1.4 L/min. The differences in these measurements (2.11, − 0.48 upper and lower limits of agreement)
were not significant (p = 0.12 for tidal volume and 0.28 (Fig. 3b and S5, Panel B).
for minute ventilation). As expected, during volume- The mean values in each experimental set-up are sum-
controlled ventilation, the calculated airway and tissue marized in Table S1.
resistances were higher at 60 L/min (p < 0.001) as shown
in Figure S2. Discussion
The MP can be computed, as a gold standard, by ana-
Volume-controlled mechanical ventilation lysis of the dynamic inspiratory airway pressure-volume
The regressions between the MP assessed by the geo- curve, which measures the physical phenomenon (i.e.,
metric method and the comprehensive algebraic formula the geometric method). Alternatively, equations can be
for 30 and 60 L/min of inspiratory flow are shown in applied which assume that the respiratory system elas-
tance and resistance are constant during inspiration [10].
Table 1 Clinical characteristics of the study population Unfortunately, although the intensive care ventilator
Variables Population (n = 40) could in fact easily compute or measure the MP directly,
Age (year) 71 ± 12
this measurement is not automatically available, obliging
physicians to calculate it manually. Normally, in the
Height (cm) 167 ± 7
course of ARDS, mechanical ventilation is applied either
2
BMI (kg/m ) 25 ± 4.3 in volume-controlled or in pressure-controlled mode
Intensive care unit stay (days) 3.8 ± 5.9 [22]. The different characteristics of the flow curve in
Medical/elective surgery (n) 11–29 the two modes imply that it is not possible to apply the
PaO2/FiO2 (mmHg) 244 ± 135 same equations for these two ventilatory setups.
PaCO2 (mmHg) 42.5 ± 4.8
Volume-controlled ventilation
Respiratory rate (bpm) 14.3 ± 1.8
For volume-controlled ventilation, Gattinoni et al. ori-
Tidal volume (mL) 413 ± 70 ginally proposed an equation that was complicated to
Tidal volume/kg PBW (mL/kg) 7.6 ± 2.3 compute at the bedside because it included all the re-
Minute ventilation (L/min) 5.9 ± 1.3 spiratory physiological variables [10]. The same authors
Clinical PEEP (cmH2O) 5.2 ± 0.9 proposed also a simpler equation that, starting from the
Driving pressure (cmH2O) 7.1 ± 1.6
measured values of peak, plateau and end-expiratory
pressure was mathematically identical to the original
Respiratory system elastance (cmH2O/mL) 17.7 ± 4.3
one, allowing to calculate MP with the data displayed byChiumello et al. Critical Care (2020) 24:417 Page 5 of 8 Fig. 1 Bland-Altman analysis of the comprehensive equation for volume-controlled ventilation at 30 L/min (a) and 60 L/min (b) of inspiratory flow against the reference geometrical method the ventilator, provided that an end-inspiratory hold was turbulent motion component. However, Giosa et al. performed. We called this “comprehensive formula.” Re- found that even doubling the resistance up to cently, Giosa and colleagues [18] proposed a surrogate 20 cmH2O s/L, the underestimation bias remained quite formula that allowed to calculate MP without the in- low—in the order of 1.3 J/min. In the current study, to spiratory hold. In their original paper, however, the assess this surrogate method at two different resistances equation was not tested against the reference geomet- (high and low) directly against the geometric method, rical method. The present study indicates that for we applied high and low inspiratory flows (30 and 60 L/ volume-controlled ventilation, the MP measured by the min). At both levels, the error between the geometric comprehensive and the surrogate equations were highly and the surrogate methods remained clinically correlated with the reference-standard geometric negligible. method, with limits of agreement mostly within 2 J/min. This advocates that the simpler surrogate formula is of Mechanical power at two levels of inspiratory flow high clinical utility, allowing to quickly calculate MP As shown in Table S1, both the measured (geometrical even in settings where performing an inspiratory hold is method) and the calculated (comprehensive and surro- either not possible (operating theater, patient transport) gate formulas) MP at 60 L/min was higher than at 30 L/ or not feasible (elevated number of patients and/or staff min. This is not unexpected: as already stated by Gatti- shortage). Of note, the fixed value for resistances as- noni et al. in the original paper [10], MP increases with sumed by the surrogate equation quite likely underesti- increasing airway resistances and flow. Indeed, at higher mates the “real” MP at high inspiratory flow rates, as the flows, not only the airway resistances, but also the tissue calculated resistances tend to increase because of the resistances increase, as the higher rate of tidal strain Fig. 2 Bland-Altman analysis of the surrogate equation for volume-controlled ventilation at 30 L/min (a) and 60 L/min (b) of inspiratory flow against the reference geometrical method
Chiumello et al. Critical Care   (2020) 24:417                                                                                          Page 6 of 8

 Fig. 3 Bland-Altman analysis of the comprehensive (a) and the surrogate equations (b) for pressure-controlled ventilation against the reference
 geometrical method

requires more energy. While it can be reasonably as-                        Clinical implications
sumed that the energy dissipated in the airways and the                     Nowadays, plateau pressure and driving pressure are the
endotracheal tube does not cause VILI, the one dissi-                       de facto clinically used variables to monitor whether a
pated to perform the tissue strain has been already                         certain mechanical ventilation setup is protective or not
shown to cause damage and should not be ignored [23].                       [6]. The main benefit of driving pressure is the extreme
                                                                            ease of the calculation that, together with its association
Pressure-controlled ventilation                                             with mortality, allowed a rapid adoption around the
Until Becher et al. [19] and Van der Meijden et al. [20]                    world. Nevertheless, we believe that mechanical power,
reported two equations to measure the MP in pressure-                       also including the effects of respiratory rate, flow, and
controlled ventilation, it had been erroneously assessed                    PEEP, gives a much more comprehensive view on the
with equations developed and validated only for volume-                     ventilator-related causes of VILI [24] but its widespread
controlled ventilation. For example, Serpa Neto et al.                      application has been hindered by the complexity of its
[15] computed the MP in a big population of mechanic-                       calculation. We believe that our data do support the use
ally ventilated patients using a single formula independ-                   of the surrogate formulas at the bedside to add a tile in
ently of the actual type of ventilation. Van der Meijden                    the puzzle of lung protection. Clinicians are used to use
et al. finally suggested a comprehensive formula that                       low tidal volumes (6 mL/kg, driving pressure < 14
considers all the variables. The main drawback of this                      cmH2O), and to maintain a viable CO2 clearance, they
approach is the flow-dependency of the resistances: as                      ramp up the respiratory frequency. It is therefore of
flow is not constant in pressure-controlled ventilation,                    paramount importance to sensitize the intensivists to
whatever value used is intrinsically approximated.                          consider that high respiratory rate does injure the lung
Nevertheless, the need of an inspiratory hold, calculation                  as it is part of the whole energy package delivered by the
of the resistances, and the presence of an exponential                      ventilator [11, 25].
make this equation usable only if directly implemented
in the ventilator. Becher et al. besides their original
equation proposed an extremely easy to use surrogate                        Limitations
formula for the same purpose. Interestingly, in our                         This study has several limitations. First, the compre-
population, the surrogate performed equally if not better                   hensive and surrogate equations can be currently ap-
than the comprehensive formula from Van der Meijden,                        plied only in sedated and paralyzed patients with no
having a higher R2 and, despite a trivially larger bias, a                  active breathing. Second, it is reasonable to think that
smaller confidence interval. This discrepancy between                       the biological effects of MP will be clearer once: (1)
the comprehensive and the surrogate formulas is prob-                       MP is partitioned to the lung only by using the trans-
ably due to the assumptions that need to be made to cal-                    pulmonary pressure [26] instead of the total airway
culate the resistances during an inflation with decreasing                  pressure and (2) it is normalized to the lung volume
flow. The clinical consequence is that the surrogate for-                   or to the amount of well-aerated lung tissue, as MP
mula, despite its simplicity, has a high degree of accur-                   is an extensive property and might have different ef-
acy and can be safely used at the bedside without the                       fects depending on the amount of lung mass bearing
need of complex calculations.                                               a given energy load [14].
Chiumello et al. Critical Care (2020) 24:417 Page 7 of 8
Conclusion 3. Chiumello D, Brochard L, Marini JJ, Slutsky AS, Mancebo J, Ranieri VM,
Both for volume-controlled and pressure-controlled ven- Thompson BT, Papazian L, Schultz MJ, Amato M, et al. Respiratory support
in patients with acute respiratory distress syndrome: an expert opinion. Crit
tilation, the surrogate formulas show enough accuracy to Care. 2017;21(1):240.
warrant their use in clinical practice. The use of the 4. Slutsky AS, Ranieri VM. Ventilator-induced lung injury. N Engl J Med. 2013;
comprehensive formulas is encouraged, especially when 369(22):2126–36.
5. Network TARDS. Ventilation with lower tidal volumes as compared with
time and staff availability allow to allocate more time to traditional tidal volumes for acute lung injury and the acute respiratory
the management of patients. The geometrical method, distress syndrome. N Engl J Med. 2000;342(18):1301–8.
considered the gold standard, should be reserved to a re- 6. Amato MB, Meade MO, Slutsky AS, Brochard L, Costa EL, Schoenfeld DA,
Stewart TE, Briel M, Talmor D, Mercat A, et al. Driving pressure and survival
search and academic environment, unless directly inte- in the acute respiratory distress syndrome. N Engl J Med. 2015;372(8):747–55.
grated in the next-generation ventilator software. 7. Sahetya SK, Goligher EC, Brower RG. Fifty years of research in ARDS. Setting
positive end-expiratory pressure in acute respiratory distress syndrome. Am
J Respir Crit Care Med. 2017;195(11):1429–38.
Supplementary information 8. Tonetti T, Vasques F, Rapetti F, Maiolo G, Collino F, Romitti F, Camporota L,
Supplementary information accompanies this paper at https://doi.org/10. Cressoni M, Cadringher P, Quintel M, et al. Driving pressure and mechanical
1186/s13054-020-03116-w. power: new targets for VILI prevention. Ann Transl Med. 2017;5(14):286.
9. Hotchkiss JR Jr, Blanch L, Murias G, Adams AB, Olson DA,
Additional file 1. Wangensteen OD, Leo PH, Marini JJ. Effects of decreased respiratory
frequency on ventilator-induced lung injury. Am J Respir Crit Care
Med. 2000;161(2 Pt 1):463–8.
Acknowledgements 10. Gattinoni L, Tonetti T, Cressoni M, Cadringher P, Herrmann P, Moerer O,
Not applicable. Protti A, Gotti M, Chiurazzi C, Carlesso E, et al. Ventilator-related causes
of lung injury: the mechanical power. Intensive Care Med. 2016;42(10):
Authors’ contributions 1567–75.
DC planned the study. M. Gotti, M. Guanziroli, PF, MU, IP, and GM collected 11. Cressoni M, Gotti M, Chiurazzi C, Massari D, Algieri I, Amini M, Cammaroto
the data. MB performed the data analysis. DC and MB wrote the first draft of A, Brioni M, Montaruli C, Nikolla K, et al. Mechanical power and
the manuscript that was subsequently critically edited by M. Gotti, M. development of ventilator-induced lung injury. Anesthesiology. 2016;124(5):
Guanziroli, PF, MU IC, and GM. The authors read and approved the final 1100–8.
manuscript. 12. Collino F, Rapetti F, Vasques F, Maiolo G, Tonetti T, Romitti F, Niewenhuys J,
Behnemann T, Camporota L, Hahn G, et al. Positive end-expiratory pressure
Funding and mechanical power. Anesthesiology. 2019;130(1):119–30.
2017 SIAARTI/MSD Italia s.r.l funding for the medical research. 13. Santos RS, Maia LA, Oliveira MV, Santos CL, Moraes L, Pinto EF, Samary
CDS, Machado JA, Carvalho AC, Fernandes MVS, et al. Biologic impact
of mechanical power at high and low tidal volumes in experimental
Availability of data and materials
mild acute respiratory distress syndrome. Anesthesiology. 2018;128(6):
The dataset used is available upon a justified request.
1193–206.
14. Zhang Z, Zheng B, Liu N, Ge H, Hong Y. Mechanical power
Ethics approval and consent to participate normalized to predicted body weight as a predictor of mortality in
The ethical consent has been signed by each participant to the study. patients with acute respiratory distress syndrome. Intensive Care Med.
2019;45(6):856–64.
Consent for publication 15. Serpa Neto A, Deliberato RO, Johnson AEW, Bos LD, Amorim P, Pereira SM,
Not applicable. Cazati DC, Cordioli RL, Correa TD, Pollard TJ, et al. Mechanical power of
ventilation is associated with mortality in critically ill patients: an analysis of
Competing interests patients in two observational cohorts. Intensive Care Med. 2018;44(11):
None to disclose. 1914–22.
16. Marini JJ. Evolving concepts for safer ventilation. Crit Care. 2019;23(Suppl 1):114.
Author details 17. Huhle R, Serpa Neto A, Schultz MJ, Gama de Abreu M. Is mechanical power
1
SC Anestesia e Rianimazione, Ospedale San Paolo – Polo Universitario, ASST the final word on ventilator-induced lung injury?-no. Ann Transl Med. 2018;
Santi Paolo e Carlo, Via Di Rudinì, 8, 20142 Milan, Italy. 2Dipartimento di 6(19):394.
Scienze della Salute, Università degli Studi di Milano, Milan, Italy. 3Centro 18. Giosa L, Busana M, Pasticci I, Bonifazi M, Macri MM, Romitti F, Vassalli F,
Ricerca Coordinata di Insufficienza Respiratoria, Milan, Italy. 4Dipartimento di Chiumello D, Quintel M, Marini JJ, et al. Mechanical power at a glance: a
Fisiopatologia Medica Chirurgica e dei Trapianti, Università degli Studi di simple surrogate for volume-controlled ventilation. Intensive Care Med Exp.
Milano, Milan, Italy. 5Department of Anesthesiology, Emergency and Intensive 2019;7(1):61.
Care Medicine, University of Göttingen, Göttingen, Germany. 19. Becher T, van der Staay M, Schadler D, Frerichs I, Weiler N. Calculation of
mechanical power for pressure-controlled ventilation. Intensive Care Med.
Received: 1 May 2020 Accepted: 29 June 2020 2019;45(9):1321–3.
20. van der Meijden S, Molenaar M, Somhorst P, Schoe A. Calculating
mechanical power for pressure-controlled ventilation. Intensive Care Med.
References 2019;45(10):1495–7.
1. Bellani G, Laffey JG, Pham T, Fan E, Brochard L, Esteban A, Gattinoni L, van 21. Marini JJ, Rodriguez RM, Lamb V. Bedside estimation of the inspiratory work
Haren F, Larsson A, McAuley DF, et al. Epidemiology, patterns of care, and of breathing during mechanical ventilation. Chest. 1986;89(1):56–63.
mortality for patients with acute respiratory distress syndrome in intensive 22. Lumb AB, Nunn JF. Nunn’s applied respiratory physiology. 6th ed.
care units in 50 countries. JAMA. 2016;315(8):788–800. Edinburgh: Elsevier Butterworth Heinemann; 2005.
2. Fan E, Del Sorbo L, Goligher EC, Hodgson CL, Munshi L, Walkey AJ, Adhikari 23. Protti A, Maraffi T, Milesi M, Votta E, Santini A, Pugni P, Andreis DT, Nicosia F,
NKJ, Amato MBP, Branson R, Brower RG, et al. An official American Thoracic Zannin E, Gatti S, et al. Role of strain rate in the pathogenesis of ventilator-
Society/European Society of Intensive Care Medicine/Society of Critical Care induced lung edema. Crit Care Med. 2016;44(9):e838–45.
Medicine clinical practice guideline: mechanical ventilation in adult patients 24. Marini JJ, Rocco PRM, Gattinoni L. Static and dynamic contributors to VILI in
with acute respiratory distress syndrome. Am J Respir Crit Care Med. 2017; clinical practice: pressure, energy, and power. Am J Respir Crit Care Med.
195(9):1253–63. 2019;201:767–74.Chiumello et al. Critical Care (2020) 24:417 Page 8 of 8
25. Vassalli F, Pasticci I, Romitti F, Duscio E, Assmann DJ, Grunhagen H, Vasques
F, Bonifazi M, Busana M, Macri MM, et al. Does iso-mechanical power lead
to iso-lung damage?: an experimental study in a porcine model.
Anesthesiology. 2020;132:1126–37.
26. Gattinoni L, Giosa L, Bonifazi M, Pasticci I, Busana M, Macri M, Romitti F,
Vassalli F, Quintel M. Targeting transpulmonary pressure to prevent
ventilator-induced lung injury. Expert Rev Respir Med. 2019;13:737–46.
Publisher’s Note
Springer Nature remains neutral with regard to jurisdictional claims in
published maps and institutional affiliations.You can also read