Predicting the soil water retention curve from the particle size distribution based on a pore space geometry containing slit-shaped spaces - HESS
←
→
Page content transcription
If your browser does not render page correctly, please read the page content below
Hydrol. Earth Syst. Sci., 22, 4621–4632, 2018
https://doi.org/10.5194/hess-22-4621-2018
© Author(s) 2018. This work is distributed under
the Creative Commons Attribution 4.0 License.

Predicting the soil water retention curve from the particle size
distribution based on a pore space geometry containing
slit-shaped spaces
Chen-Chao Chang1,2 and Dong-Hui Cheng1,2
1 Schoolof Environmental Sciences and Engineering, Chang’an University, Xi’an, 710054, China
2 KeyLaboratory of Subsurface Hydrology and Ecological Effects in Arid Region, Chang’an University,
Ministry of Education, Xi’an, China

Correspondence: Dong-Hui Cheng (chdhbsh@chd.edu.cn)

Received: 13 November 2017 – Discussion started: 5 December 2017
Revised: 27 July 2018 – Accepted: 8 August 2018 – Published: 4 September 2018

Abstract. Traditional models employed to predict the soil        ber of associated conceptual and physical models have been
water retention curve (SWRC) from the particle size distri-      proposed.
bution (PSD) always underestimate the water content in the          The first attempt to directly translate a PSD into an SWRC
dry range of the SWRC. Using the measured physical pa-           was made by Arya and Paris (1981) (hereafter referred to as
rameters of 48 soil samples from the UNSODA unsaturated          the AP model). In this model, the PSD is divided into mul-
soil hydraulic property database, these errors were proven to    tiple size fractions and the bulk and particle densities of the
originate from an inaccurate estimation of the pore size dis-    natural-structure samples are uniformly applied to each par-
tribution. A method was therefore proposed to improve the        ticle size fraction, from which it follows that the pore frac-
estimation of the water content at high suction heads using      tion and the corresponding solid fraction are equal. Thus,
a pore model comprising a circle-shaped central pore con-        the degree of saturation can be set equal to the cumulative
nected to slit-shaped spaces. In this model, the pore volume     PSD function. The soil suction head can be obtained us-
fraction of the minimum pore diameter range and the cor-         ing the capillary equation based on a “bundle of cylindri-
responding water content were accordingly increased. The         cal tubes” model, and the pore size in the equation is de-
predicted SWRCs using the improved method reasonably ap-         termined by scaling the pore length and pore volume (Arya
proximated the measured SWRCs, which were more accurate          et al., 2008). Based on the principle of the AP model, many
than those obtained using the traditional method and the scal-   researchers have focused on improving the suction head cal-
ing approach in the dry range of the SWRC.                       culations, which are commonly based on the capillary equa-
                                                                 tion; but methods that are used to translate the particle di-
                                                                 ameter into the pore diameter are different (Haverkamp and
                                                                 Parlange, 1986; Zhuang et al., 2001; Mohammadi and Van-
1   Introduction                                                 clooster, 2011; Jensen et al., 2015). Some models estimate
                                                                 the pore diameter based on the particle packing patterns (e.g.,
The soil water retention curve (SWRC), which represents          the MV model) (Meskini-Vishkaee et al., 2014), while oth-
the relationship between the water pressure and water con-       ers utilize the proportionality factor between the pore size
tent, is fundamental to researching water flow and chemical      and the associated particle diameter (e.g., the HP model and
transport in unsaturated media (Pollacco et al., 2017). Direct   the two-stage approach) (Haverkamp and Parlange, 1986;
measurements of the SWRC consume both time and money             Jensen et al., 2015). However, the scheme employed to es-
(Arya and Paris, 1981; Mohammadi and Vanclooster, 2011),         timate the water content has not been modified and follows
while estimating the SWRC from the particle size distribu-       the approach of the AP model. The SWRC prediction models
tion (PSD) is both rapid and economical. Therefore, a num-       which use the same scheme to predict the water content and

Published by Copernicus Publications on behalf of the European Geosciences Union.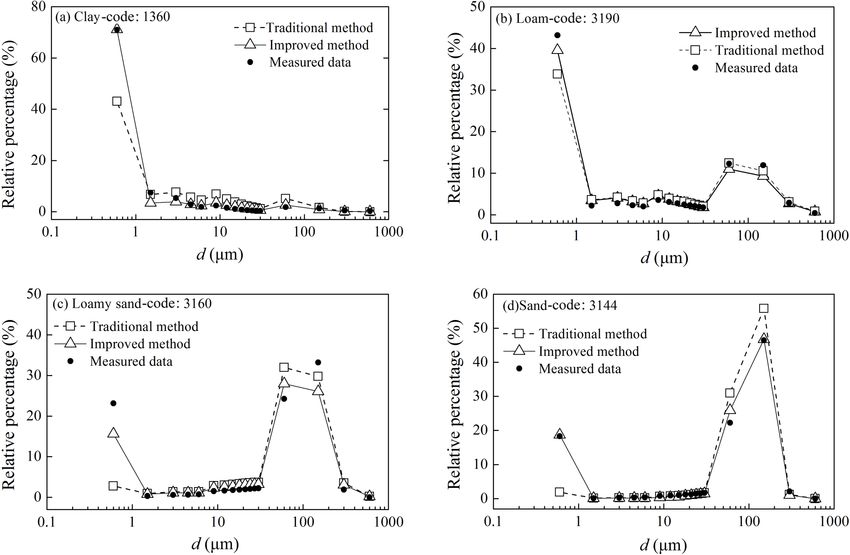
4622                                                 C.-C. Chang and D.-H. Cheng: Predicting the soil water retention curve

only improve the suction head calculation are referred to as        accurately estimating the water content using a pore space
the traditional models in the following text.                       geometry containing slit-shaped spaces to improve the pre-
   However, these traditional models underestimate the wa-          diction of the SWRC.
ter content in the dry range of the SWRC (Hwang and Pow-
ers, 2003; Meskini-Vishkaee et al., 2014). Therefore, some
researchers have attempted to improve the water content cal-        2    Basic descriptions
culation by attributing model errors to both a simplified pore
geometry and an incomplete desorption of residual water in          The relationship between the PSD and the PoSD is a funda-
the soil pores within a high suction head range (Tuller et          mental element when predicting the SWRC from the PSD.
al., 1999; Mohammadi and Meskini-Vishkaee, 2012). Re-               Hwang and Powers (2003) found that the nonlinear rela-
cent findings have revealed the existence of corner wa-             tionship between the PSD and the PoSD is more appro-
ter, lens water and water films in soils at high matric suc-        priate than the linear relationship applied in the AP model
tion heads (Tuller et al., 1999; Mohammadi and Meskini-             and therefore described both the PSD and the PoSD as log-
Vishkaee, 2012; Or and Tuller, 1999; Shahraeeni and Or,             normal distributions. However, since the PSD and PoSD of
2010; Tuller and Or, 2005). Therefore, Mohammadi and                soils do not strongly follow a lognormal distribution, this
Meskini-Vishkaee (2012) predicted an SWRC based on the              model performed very poorly for moderately fine-textured
PSD while considering the adsorbed water films and lens wa-         soils (Hwang and Choi, 2006). Obtaining an accurate PoSD
ter between the soil particles, and slightly improved upon          from the PSD of a soil is highly difficult, and the errors that
the traditional MV model. Tuller et al. (1999) proposed a           arise from this approach could cause inevitable errors in the
pore space geometry containing slit-shaped spaces and de-           predicted SWRC. However, the underestimation of the water
rived a corresponding SWRC that considered both the water           content in the dry range of an SWRC has not been compre-
films and water inside the angular-shaped pores; however,           hensively evaluated from this perspective.
the predicted SWRC failed to describe experimental data at             In this study, the measured PoSDs of 48 soil samples
an intermediate water content due to the limitations of the         were compared with the PoSDs calculated using a traditional
gamma distribution function used to characterize the pore           model (they were actually the corresponding PSDs) to iden-
size distribution (PoSD) (Lebeau and Konrad, 2010). More-           tify the origins of the errors and their effects on the accuracy
over, this model was mathematically complex. Mohammadi              of the predicted SWRC. The provided 48 soil samples exhib-
and Meskini-Vishkaee (2013) incorporated the residual wa-           ited a wide range of physical properties (Table 1) and were
ter content into the MV model and consequently decreased            selected from the UNSODA unsaturated soil hydraulic prop-
the magnitude of the underestimation in the dry range of            erty database, which contains 790 soil samples with general
the SWRC. However, an accurate estimation of the resid-             unsaturated soil hydraulic properties and basic soil proper-
ual water content remains a challenge. Meskini-Vishkaee et          ties (e.g., water retention, hydraulic conductivity, soil water
al. (2014) improved the traditional MV model by defining a          diffusivity, PSD, bulk density, and organic matter content)
soil particle packing scaling factor. This method could im-         (Nemes et al., 2001). The maximum, minimum and mean
prove the estimation of the SWRC, and is particularly signif-       values of the soil bulk density and the percentages of clay
icant for fine- and medium-textured soils.                          and sand of the used soil samples for the calibration stage
   Many traditional models are based on a “bundle of cylin-         are presented in Table 2.
drical tubes” representation of the pore space geometry (Arya
and Paris, 1981; Zhuang et al., 2001), which results in intrin-         1. Calculating the PoSD using a traditional model
sic errors when predicting the water flow in variably satu-                Traditional models commonly assume that the pore vol-
rated soils. Consequently, some researchers have considered                ume fraction of each size fraction can be set equal to
pore networks as bundles of triangular tubes, which could                  the corresponding solid fraction (Arya and Paris, 1981).
incorporate the contribution of water in pore corners to the               Thus, the cumulative pore volume fraction can take the
water content (Helland and Skjæveland, 2007). A new pore                   following form:
geometry model comprised of a polygon-shaped central pore
connected to slit-shaped spaces was proposed by Tuller et                  j =i
                                                                           X             j =i
                                                                                         X
al. (1999) to provide a more realistic representation of natural                  νj =          ωj ; i = 1, 2, . . . n,             (1)
pore spaces (Tuller et al., 1999; Or and Tuller, 1999; Tuller              j =1          j =1
and Or, 2001). This pore model could represent a foundation
                                                                           where ωj is the solid fraction of the j th particle fraction,
for accurately describing the water status in natural soils, par-
                                                                           νj is the pore volume fraction associated with the j th
ticularly in arid environments.
                                                                           fraction, and n is the total number of size fractions in
   Therefore, the objectives of this study were to evaluate the
                                                                           the PSD.
leading factors that lead to an underestimation of the water
content in the dry range of the predicted SWRC using tra-                  The routine procedures employed among the several tra-
ditional methods and to furthermore propose a method for                   ditional models to translate a particle diameter into a

Hydrol. Earth Syst. Sci., 22, 4621–4632, 2018                                        www.hydrol-earth-syst-sci.net/22/4621/2018/
C.-C. Chang and D.-H. Cheng: Predicting the soil water retention curve                                                            4623

Table 1. Codes and texture classes of the 48 soils selected from UNSODA.

                             UNSODA codes                                                           Texture class
                             4681, 4680, 2362, 2360, 1400, 1383, 4121, 1361, 2340                   Clay
                             3191, 1091, 2530, 2531                                                 Loam
                             2102, 3150, 3161, 3171, 1160, 3170, 3130, 1031, 4011, 4020             Loamy sand
                             1464, 1466, 2100, 3340, 4650, 3142, 1050, 1023, 3141, 3163,            Sand
                             3164, 3165, 3172, 4051, 4520, 4521
                             3202                                                                   Sandy clay loam
                             3200, 3203, 4162                                                       Sandy loam
                             4042, 4180, 4070, 4673, 1341                                           Silt loam

Table 2. Basic soil properties of 48 samples for the model calibration.

                                  Soil texture         Number of                  Clay      Sand              ρb
                                                      soil samples                 (%)       (%)        (g cm−3 )
                                                                      Min         41.5        6.1            1.08
                                  Clay                           9    Max         58.2       36.0            1.64
                                                                      Average     50.2       14.1            1.29
                                                                      Min         14.0       42.0            1.36
                                  Loam                           4    Max         23.0       67.0            1.63
                                                                      Average     17.3       50.5            1.46
                                                                      Min          3.0       76.2            1.32
                                  Loamy sand                    10    Max         10.4       89.4            1.60
                                                                      Average      6.1       83.2            1.46
                                                                      Min          0.7       89.6            1.41
                                  Sand                          16    Max          4.6       98.9            1.70
                                                                      Average      2.5       93.4            1.55
                                  Sandy clay loam                1                 2.7       62.5            1.70
                                                                      Min         10.5       64.9            1.27
                                  Sandy loam                     3    Max         19.4       76.3            1.70
                                                                      Average     15.0       68.8            1.50
                                                                      Min         10.5       21.0            1.49
                                  Silt loam                      5    Max         15.7       34.8            1.56
                                                                      Average     12.6       26.5            1.52

     pore diameter are different. The equivalent pore diam-                     diameter (µm). Inputting the PSD data, the calculated
     eter can be derived from physical properties, including                    pore diameters are sequentially paired with correspond-
     the bulk density and the particle density, or from the                     ing pore volume fractions to obtain a calculated PoSD.
     proportionate relationship between the pore size and
     associated particle diameter. Although the former can                2. Estimating the PoSD from the measured SWRC
     logically characterize a pore, a complicated pattern can
     slightly reduce the model performance, while the lat-                      It is generally difficult to measure the PoSD of a soil;
     ter approach is easy to use, and its rationality has been                  however, the PoSD can be indirectly obtained using the
     demonstrated by some researchers (Hamamoto et al.,                         measured water content and suction head (Jayakody et
     2011; Sakaki et al., 2014). Here, the latter technique is                  al., 2014). The cumulative pore volume fraction of the
     applied, and it can be expressed as                                        ith fraction is equal to the ratio of the measured water
                                                                                content to the saturated water content (Eq. 3):
     di = 0.3Di ,                                               (2)
                                                                                          j =i
                                                                                          X
     where Di is the mean particle diameter of the ith frac-                    θi = θs          νj ; i = 1, 2, . . .n,              (3)
     tion (µm) and di is the corresponding equivalent pore                                j =1

www.hydrol-earth-syst-sci.net/22/4621/2018/                                               Hydrol. Earth Syst. Sci., 22, 4621–4632, 2018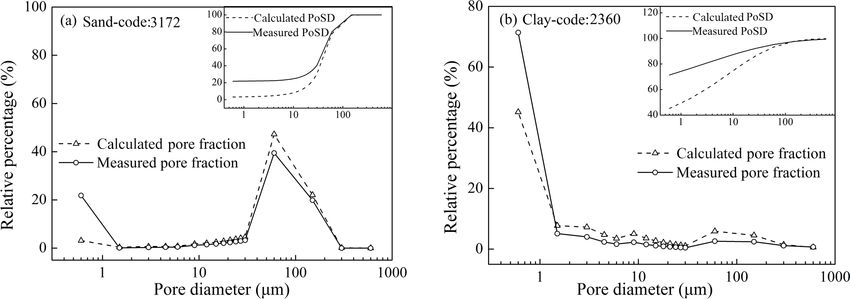
4624                                               C.-C. Chang and D.-H. Cheng: Predicting the soil water retention curve

Figure 1. Measured vs. calculated pore volume fraction curves using the traditional method for (a) sand (code: 3172) and (b) clay
(code: 2360). The measured and calculated PoSDs are in the insets at the top of the figures.

     where θs is the saturated water content (cm3 cm−3 ) and
     θi is the measured water content (cm3 cm−3 ).
     Meanwhile, the corresponding pore diameters are de-
     rived on the basis of Laplace’s equation and Eq. (4):
            2σ cos ε
     ψi =            ,                                     (4)
             ri gρw
     where ψi is the suction head (mH2 O), σ is the surface
     tension (kg s−2 ), ε is the contact angle between the soil    Figure 2. Pore model containing two slit-shaped spaces (d denotes
     particle and water, ri is the pore radius (m), and ρw         the diameter of the central pore, and αd and βd denote the widths
     is the density of water (kg m−3 ). Assuming for water         and lengths of the slit-shaped spaces, respectively).
     at 20 ◦ C σ = 7.275 × 10⁻² kg s−2 , ρw = 998.9 kg m−3 ,
     g = 9.81 m s−2 , and ε = 0◦ (Mohammadi and Van-
     clooster, 2011), then transforming ri to di and substitut-       The measured pore volume fraction curves for the typical
     ing numerically the values of the constant yield a sim-       samples, namely, sand (code: 3172) and clay (code: 2360),
     plified expression as Eq. (5):                                and their calculated curves using the traditional model are
                                                                   presented in Fig. 1. The small maps embedded in Fig. 1 ex-
            3000
     ψi =        ,                                         (5)     hibit the measured and calculated PoSD curves, which show
             di                                                    that the calculated PoSD curves approximately coincide with
     where ψi is the suction head (cmH2 O) and di is the           the measured curves in the larger pore diameter range, while
     pore diameter (µm). Then, the pore diameters calculated       in the smaller range, which corresponds to the higher suc-
     by Eq. (5) were sequentially paired with the cumulative       tion head range on the SWRC, the calculated values are ob-
     pore volume fractions calculated by Eq. (3) to obtain a       viously smaller than the measured values. The underestima-
     PoSD, which could be considered a measured PoSD.              tion of the pore volume fraction in the smaller pore diame-
                                                                   ter range can consequently lead to an underestimation of the
     The calculated and measured PoSD data were fitted us-
                                                                   water content at high suction heads. In particular, the calcu-
     ing a modified logistic growth model (Eq. 6) (Liu et al.,
                                                                   lated pore volume fraction associated with the smallest pore
     2003):
                                                                   diameter (d ≤ 0.6 µm) was far less than the measured value.
                    1                                              These results illustrated that the underestimation of the pore
     wi =                   ,                             (6)     volume fraction with respect to the smallest pore diameter
            1 + a exp −bdic
                                                                   (d ≤ 0.6 µm) was a key factor with regard to the underesti-
     where wi is the cumulative pore volume fraction with          mation of the water content in the dry range of the SWRC.
     diameters smaller than di (%) and a, b, and c are the fit-    In addition, the underestimation of the pore volume fraction
     ting parameters (dimensionless). This model produced a        is associated with an oversimplified pore space geometry,
     good fit for the PoSD data employed in this study with a      which traditional models have generally characterized as a
     coefficient of determination (r 2 ) that ranged from 0.972    bundle of cylindrical capillaries. The measured and calcu-
     to 0.999.                                                     lated pore curves of the other 46 soil samples behaved in the

Hydrol. Earth Syst. Sci., 22, 4621–4632, 2018                                    www.hydrol-earth-syst-sci.net/22/4621/2018/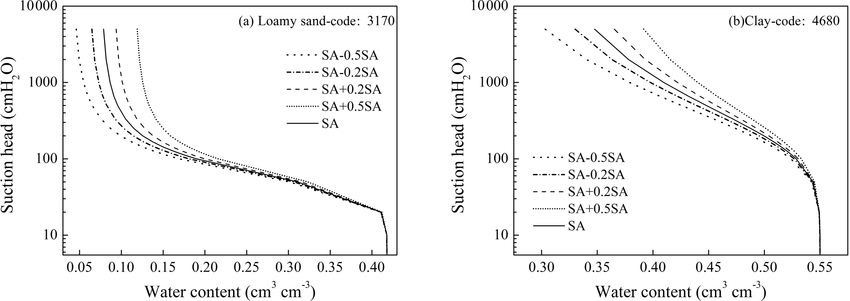
C.-C. Chang and D.-H. Cheng: Predicting the soil water retention curve                                                          4625

same fashion, and those curves are provided in the Supple-            3.2   Values of α and β
ment (Fig. S1).
                                                                      To obtain the values of α and β, an expression containing
                                                                      both of these parameters with respect to the specific surface
3     Improved method                                                 area (SSA ) was applied here. The SSA of the pore as shown
                                                                      in Fig. 2 can be described using a geometrical relationship as
3.1    Estimating the pore volume fraction                            follows:
                                                                                      n
In this study, the soil pore structure was conceptualized                       φ X        4βdi + π di
within a pore model in which the elementary unit cell is com-         SSA =             ωi               ; i = 1, 2, . . .n,     (10)
                                                                              1000ρb i=1 2αβdi2 + π4 di2
posed of a relatively larger circle-shaped central pore con-
nected to two slit-shaped spaces (see Fig. 2). Relative to the        where SSA is the specific surface area (m2 g−1 ), di is the pore
polygonal central pore connected to the slit-shaped spaces as         diameter (m), ρb is the bulk density (kg m−3 ) and 8 is the
described by Or and Tuller (1999), both the slit width and            measured porosity. Therefore, an important requirement for
the slit length are proportional to the diameter of the associ-       the calculation of the α and β values is an estimation of the
ated central pore d and are therefore expressed as αd and βd,         SSA at sample scale. Here, a power equation was applied as
respectively.                                                         follows (Sepaskhah et al., 2010):
   When estimating the pore volume fraction using the pore
model described above, the volume fractions of the central            SSA = 3.89dg−0.905 ,                                       (11)
pore and slit-shaped spaces are distinguished. Considering
                                                                      where SSA is the estimated specific surface area (m2 g−1 ),
that the sizes of the slit-shaped spaces are smaller than that of
                                                                      and dg is the geometric mean particle size diameter (mm)
the minimum central pore, the slit-shaped spaces are accord-
                                                                      obtained using Eq. (12) (Shirazi and Boersma, 1984):
ingly classified into it. Therefore, the pore volume fractions
of the soil samples were simplified into those of the central         dg = exp (fc ln Mc + fsi ln Msi + fsa ln Msa ) ,           (12)
pores, but the volume fraction of the minimum central pores
included that of all slit-shaped spaces. Using the geometric          where fc , fsi and fsa are the clay, silt and sand fractions
relationship described in Fig. 2 and the traditional assump-          (%) of the soil sample, respectively; Mc , Msi and Msa are
tion that the volume fraction of each unit cell (i.e., the central    the mean diameters of clay, silt and sand that are empirically
pore connecting to two slit-shaped spaces) is equal to the cor-       taken as 0.001, 0.026 and 1.025 mm, respectively.
responding particle mass fraction, the pore volume fractions             Consequently, the quantitative relationship between the
with respect to different sizes can be readily obtained.              parameters α and β can be obtained using Eq. (10), associ-
   The procedure utilized to calculate the pore volume frac-          ated with the additional constraint of Eq. (11), and the values
tions is shown in Fig. 3. Assuming that the soil pores are            of α and β can be theoretically solved if the measured volume
composed of numerous unit cells with various sizes, the frac-         fraction of the slit-shaped pore or the measured SWRC is
tion of the ith unit cell is equal to the relative particle mass      known. However, an analytical solution is difficult to derive
fraction ωi . The addition of the volume fraction of the small-       due to the high nonlinearity of both equations. Here, a trial
est unit cell (ω1 ) and the sum of the slit volume fractions          and error approach was adopted that was much easier than
of various sizes (ζ2 + ζ3 + . . . + ζi ) result in the volume frac-   the analytical method. Conveniently, the UNSODA database
tion of the smallest pore (ν1 ). Successively accumulating it         provided a great deal of soil information, including the mea-
with the volume fractions of other central pore (i.e., ν2 , ν3 ,      sured SWRCs and diverse soil physical properties.
ν4 . . . ) provides the PoSD of a sample. The volume frac-               The routine procedure for handling a soil sample involved
tion of the slit-shaped spaces, ζi , the volume fraction of the       the following steps. First, given the initial value of α, the
smallest pore ν1 and the volume fractions of the other pores          value of β was calculated using Eqs. (10)–(12), after which
νi were calculated using Eqs. (7), (8) and (9), respectively:         the PoSD was predicted using Eqs. (7)–(9). Subsequently,
                                                                      the SWRC was estimated using the method described in
            2αβdi2                                                    Sect. 3.3. Finally, the values of α were changed repeatedly
ζi = ω i                 ,                                     (7)    until the newer predicted SWRC was in good agreement with
       2αβdi2 + π4 di2
          n                                                           the measured SWRC and the water content corresponding to
          X
ν1 = ω1 +     ζi ,                                             (8)    a suction head of 5000 cmH2 O was within 90 % of the mea-
             2                                                        sured data (see Fig. S2). The results for the 48 soil samples
νi = ωi − ζi ,                                                 (9)    indicated that the β values exhibited a broad variation range
                                                                      for all samples, while the α values showed regular changes
where ζi is the volume fraction of the slit-shaped spaces, νi         with the soil texture. The relationship between the sand con-
is the volume fraction of the ith pore fraction, and α and β          tents and the α values for 48 samples is shown in Fig. 4,
are the scaling parameters of the slit width and the slit length,     which clearly demonstrates that the values of α are similar to
respectively.                                                         samples with specific sand contents.

www.hydrol-earth-syst-sci.net/22/4621/2018/                                        Hydrol. Earth Syst. Sci., 22, 4621–4632, 2018
4626 C.-C. Chang and D.-H. Cheng: Predicting the soil water retention curve
Figure 3. Schematic of the procedure used to calculate the pore volume fraction.
3.3 Estimating the SWRC
The values of α and β for the various soil samples facilitated
the acquisition of the volume fractions of the slit pores us-
ing Eq. (7) and the PoSD using Eqs. (8) and (9). The water
contents associated with different pore filling stages could be
estimated by substituting the PoSD into Eq. (3), and the pore
size and the corresponding suction head could be calculated
using Eqs. (2) and (5). The SWRC could be ultimately ob-
tained using the calculated suction heads and water contents.
4 Model validation
4.1 Data sources
Twenty-nine soil samples with a wide range of physical prop-
Figure 4. The α values for 48 soil samples with different sand con- erties were also selected from the UNSODA database to val-
tent. The α values for clay, silt, and fine sand particles of specific
idate the model; the codes of the samples are summarized in
samples are listed in Fig. 4, except those of the coarse sand parti-
Table 4 and their detailed information is presented in Table 5.
cle, which are the same value of 0.0004 for all of the samples. For
the samples with sand content ranging from 10 % to 40 %, two sets For the soil samples that were not provided with a saturated
of α value are observed. The α values for the silt content less than water content θs , the first data point of the measured SWRC
and more than 50 % are highlighted in red and blue, respectively, corresponding to the lowest suction head was regarded as θs .
thereby reflecting the dominant functions of the silt or clay particle To generate a detailed PSD, a modified logistic growth
on the hydraulic properties of typical samples. model (Eq. 6) was used to fit the measured PSD data. Here,
the detailed PSD was generated at diameter classes of 2, 5,
10, 15, 20, 30, 40, 50, 60, 70, 80, 90, 100, 200, 500, 1000
Therefore, the approach was simplified by setting α as a and 2000 µm. The values of α were chosen from Table 3 ac-
constant for similar soil textures. The corresponding detailed cording to the sand contents of the soil samples. The values
descriptions are summarized in Table 3. The values of α were of β were obtained by substituting the SSA values predicted
inside the range of 3.34×10−05 to 2.12×10−02 , which were using Eq. (11) into Eq. (10). Then, the PoSD was predicted
estimated by Or and Tuller (1999) using a pore model com- using Eqs. (7)–(9). Finally, the SWRC was estimated using
prising a polygon-shaped central pore connected to the slit- the methods, as described in Sect. 3.3.
shaped spaces. According to the sand contents of the sam- The SWRC was also predicted using the traditional
ples, Table 3 is a reference for determining the α values that method presented in Sect. 2. In the traditional method, the
serve as input parameters in predicting the SWRC from the predicted PoSD was equivalent to the PSD (Eq. 1) and was
PSD hereafter. substituted into Eq. (3) to obtain the water content. The cor-
responding suction heads were predicted using Eqs. (2) and
(5).
Hydrol. Earth Syst. Sci., 22, 4621–4632, 2018 www.hydrol-earth-syst-sci.net/22/4621/2018/C.-C. Chang and D.-H. Cheng: Predicting the soil water retention curve 4627
Table 3. The estimated values of α for various soil textures.
Sand content Silt content α
(%) (%) Clay Silt Fine sand Coarse sand
D ≤ 2 µm 2 µm < D ≤ 50 µm 50 µm < D ≤ 500 µm 500 µm < D ≤ 2000 µm
0–10 0.0005 0.0005 0.001 0.0004
10–40 0–50 0.001 0.001 0.001 0.0004
50–100 0.0005 0.0005 0.001 0.0004
40–90 0.005 0.0015 0.001 0.0004
90–95 0.005 0.0015 0.0005 0.0004
95–100 0.005 0.0015 0.0001 0.0004
Table 4. Codes of the 29 soil samples selected from UNSODA for 4.2 Results
the model validation.
UNSODA codes Texture class The predicted and measured SWRCs in Fig. 5 show that the
improved method exhibited good fits with the measured data
1360, 4120, 2361, 3282, 1320 Clay
in the entire range of the SWRC; moreover, the improved
3190, 1370 Loam
3160, 3152, 1030, 1090, 4010 Loamy sand method was clearly better than the traditional method and
3155, 3144, 1463, 3132, 4000 Sand the scaling approach, especially in the dry range (the other
4620, 4621, 1102, 2341 Sandy clay loam 25 samples are listed in Fig. S3). In this study, the scaling
3290, 3310 Sandy loam approach, which improved the performance of the original
4531, 4510 Silt loam MV–VG model via scaling of the parameter n in the van
3031, 3032, 1372, 1362 Clay loam Genuchten equation, performed better than the traditional
method for clay (code: 1360), loamy (code: 3190) and loamy
sand (code: 3160). However, it performed worse for coarse-
textured soil (e.g., sand (code: 3144)), which may result from
A scaling approach proposed by Meskini-Vishkaee et
the relatively small scaling degree of the parameter n and
al. (2014) was used to compare with the proposed method
the poor fit of the fitting equation to the measured PSD data
to demonstrate its prediction performance. The detailed cal-
in their study. In general, the improved method here applied
culation procedures were described by Meskini-Vishkaee et
well to a wide range of soils, while the scaling approach per-
al. (2014).
formed better for fine- and medium-textured soils.
The van Genuchten equation (Eq. 13) was used to
Table 6 shows the ERMS of the improved method, the scal-
fit the predicted SWRC calculated via the three models
ing approach and the traditional method for samples used
(van Genuchten, 1980):
in model validation. The ERMS values range from 0.017 to
m 0.054 for the improved method (with an average of 0.028),
θ − θr 1
= , (13) from 0.026 to 0.060 for the scaling approach (with an av-
θs − θr 1 + (aψ)n erage of 0.037) and from 0.040 to 0.106 for the traditional
method (with an average of 0.061). In terms of the ERMS ,
where θ is the water content (cm3 cm−3 ), θr is the residual the improved method provided the best predictions and the
water content (cm3 cm−3 ), and a, n, m, and θr are fitting traditional method performed the worst. The results also
parameters. The predicted SWRCs of 29 samples exhibited showed that there is a significant difference between the per-
good fits with an average r 2 value of greater than 0.999. formance of the improved method and the traditional method
For each set of predictions, the agreement between the pre- (p = 0.001). Only for the sand samples does the performance
dicted and measured water contents was expressed in terms of the improved method and scaling approach exhibit a sig-
of the root mean square error (ERMS ), which is given by nificant statistical difference (p = 0.01).
v The accuracy of the predicted SWRC using the improved
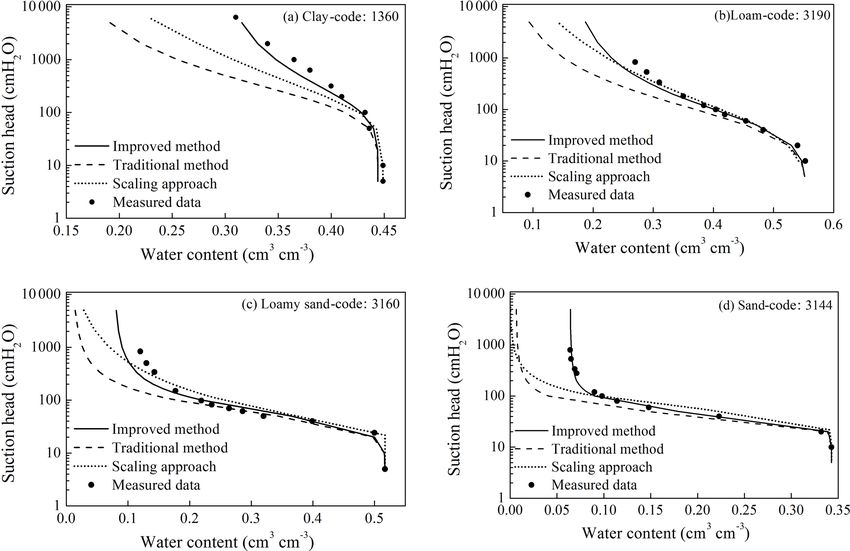
u
u1 X N method depends on the accuracy of the corresponding pre-
ERMS = t (θpi − θmi )2 , (14) dicted pore volume fractions. The calculated and measured
N i=1 pore volume fraction curves in Fig. 6 indicate that the pre-
dicted curves using the improved method are more similar
where N is the number of measured data points, θpi is the to the measured data than those predicted using the tradi-
predicted water content and θmi is the measured water con- tional method, thereby showing that the proposed method
tent. performed better. The errors in the predicted pore fractions
www.hydrol-earth-syst-sci.net/22/4621/2018/ Hydrol. Earth Syst. Sci., 22, 4621–4632, 20184628 C.-C. Chang and D.-H. Cheng: Predicting the soil water retention curve
Figure 5. Measured and predicted SWRCs for clay (code: 1360), loam (code: 3190), loamy sand (code: 3160) and sand (code: 3144).
Table 5. Basic soil properties of 29 samples for the model validation.
Soil texture Number of Clay Sand ρb
soil samples (%) (%) (g cm−3 )
Min 43.0 5.40 1.10
Clay 5 Max 57.0 32.0 1.50
Average 51.0 14.4 1.31
Min 16.5 43.6 1.41
Loam 2
Max 29.2 47.9 1.45
Min 1.70 75.5 1.37
Loamy sand 5 Max 7.30 85.2 1.59
Average 4.90 81.0 1.46
Min 1.10 90.1 1.46
Sand 5 Max 4.40 97.5 1.58
Average 2.30 93.4 1.53
Min 11.4 56.8 1.44
Sandy loam 2
Max 12.6 65.7 1.46
Min 22.3 40.0 1.21
Sandy clay loam 4 Max 30.7 69.7 1.71
Average 25.3 49.6 1.42
Min 33.4 20.4 1.07
Clay loam 4 Max 37.5 34.7 1.58
Average 35.1 24.8 1.27
Min 10.0 28.0 1.49
Silt loam 2
Max 26.0 33.0 1.53
Hydrol. Earth Syst. Sci., 22, 4621–4632, 2018 www.hydrol-earth-syst-sci.net/22/4621/2018/C.-C. Chang and D.-H. Cheng: Predicting the soil water retention curve 4629
Figure 6. The measured and predicted pore volume fraction curves using the improved method and traditional method for clay (code: 1360),
loam (code: 3190), loamy sand (code: 3160) and sand (code: 3144).
Table 6. The root mean square errors (ERMS ) of the predicted 4.3 Discussion
SWRC using the improved method, the scaling approach and the
traditional method. 4.3.1 The suction head calculation in the slit-shaped
spaces
Soil texture Number ERMS
of soil Improved Scaling Traditional When capillary water coexists with adsorptive water in
samples method approach method the narrow pores, the capillary and surface forces, includ-
Clay 5 0.022 0.032 0.056
ing ionic–electrostatic, molecular, structural, and adsorption
Clay loam 4 0.034 0.041 0.079 forces, contribute to the potential energy of water in the slit-
Sandy clay loam 4 0.032 0.046 0.072 shaped pores (Tuller et al., 1999; Iwamatsu and Horii, 1996).
Loam 2 0.054 0.060 0.106 When considering only the capillary forces, the drainage po-
Loamy sand 5 0.020 0.026 0.048 tential in slit-shaped pores is given as Eq. (15) (Derjaguin
Sand 5 0.017 0.028 0.042
Sandy loam 2 0.046 0.049 0.068
and Churaev, 1992):
Silt loam 2 0.024 0.031 0.040 −2σ
µ= , (15)
ραd
using the traditional method mainly occur at the minimum where µ is the critical potential (J kg−1 ).
pore size (d ≤ 0.6 µm), which proves that the errors of the However, the applicability of this formula is limited by
predicted SWRC using the traditional method originate from the width of the slit. Tuller and Or (2001) defined a criti-
the neglect of small pores, such as slit-shaped spaces in a nat- cal slit spacing (αd ∗ ) by Eq. (16) that classifies the slit sizes
ural sample. The proposed method used the pore model con- responding to capillary drainage and adsorption-dominated
taining slit-shaped spaces to represent the pore space geome- drainage. In the case of slit-shaped spaces greater than αd ∗ ,
try and consequently improved the prediction of the SWRC. the capillary-based slit drainage is applied.
However, the uncertainties are unavoidable when choosing r
the parameters α for unknown media, which is the main fac- ∗ 9Asvl
αd = − , (16)
tor affecting the accuracy of the predicted SWRCs. 4π σ
where Asvl is the Hamaker constant for solid–vapor interac-
tions through the intervening liquid, usually set as −6.0 ×
www.hydrol-earth-syst-sci.net/22/4621/2018/ Hydrol. Earth Syst. Sci., 22, 4621–4632, 20184630 C.-C. Chang and D.-H. Cheng: Predicting the soil water retention curve
Figure 7. The effects of a change in the estimated SSA on the SWRC for loamy sand (code: 3170) and clay (code: 4680). The SSA denotes
the accurate value of the specific surface area.
4.3.2 The effects of the estimated SSA
The SSA values estimated using Eq. (11) could affect the
accuracy of the predicted SWRCs. Figure 7 shows that an
overestimation of the SSA prompts the dry range of the
SWRC to move in the direction of larger water content,
and vice versa. When the estimated SSA value was altered
by 10 % and −10 % of its accurate value for loamy sand
(code: 3170), the water contents with respect to the high-
est suction head were higher and lower, respectively, by
approximately 0.007 cm3 cm−3 than those of the original
SWRC. For clay (code: 4680), the water contents were higher
and lower by approximately 0.009 cm3 cm−3 at the same
Figure 8. The calculated slit width αd, slit length βd and SSAi for 10 % and −10 % alterations, respectively. Consequently, for
loamy sand (code: 3170). coarse-textured soil, the water content and prediction error
of the SWRC changed relatively little for the same degree
of change in the SSA . Figure 7 also showed that a relatively
10−20 J (Tuller and Or, 2001). The value of αd ∗ is 0.591 nm, small error appeared between the calculated and measured
which means that Eq. (15) could be applied to calculate the SWRCs when the error of the estimated SSA was within
drainage potential in the slit-shaped spaces in this study. 20 %.
In our study, the critical drainage suction head for the min- Previous work has shown that the SSA of soil is closely
imum central pore calculated using Eq. (5) is 5000 cmH2 O, dependent upon the soil texture and could be estimated from
while that of the widest slit-shaped spaces calculated using the soil properties and PSD (Sepaskhah and Tafteh, 2013;
Eq. (15) is 6202 cmH2 O (the potential is converted to the suc- Resurreccion et al., 2015). The method used to estimate the
tion head). This result illustrates that all slit-shaped spaces SSA in Sect. 3.2 was presented by Sepaskhah et al. (2010),
are still filled with water when the suction head is up to the who estimated the SSA based on the geometric mean particle
critical drainage suction head for the minimum central pores. size diameter as shown in Eq. (12) with an r 2 value of 0.88.
On the other hand, the largest slit width calculated from the Moreover, the appropriateness of this equation was validated
parameters in Table 3 is 0.24 µm, which is smaller than the using 64 soil samples by Fooladmand (2011). Sepaskhah
minimum pore diameter of 0.6 µm. According to the above et al. (2010) pointed out that the estimation deviations in-
analysis, it is reasonable that the volume fractions of the min- creased distinctly for measured SSA greater than 200 m2 g−1 .
imum pores include the volume fractions of the minimum In the proposed method, the estimated SSA is mainly used
central pore and all slit-shaped spaces. to gain the parameter α and β and to estimate the volume
fractions of the slit-shaped spaces; thus, the estimation accu-
racy of SSA influences the dry range of the SWRC (Fig. 7)
and equivalently influences the degree of improvement in the
predicted SWRC. Therefore, more effort should be made to-
ward developing a more accurate transformation from the
Hydrol. Earth Syst. Sci., 22, 4621–4632, 2018 www.hydrol-earth-syst-sci.net/22/4621/2018/C.-C. Chang and D.-H. Cheng: Predicting the soil water retention curve 4631
soil physical properties to SSA to further improve the pre- database (https://www.ars.usda.gov/research/datasets/, last access:
diction of the SWRC. 19 August 2018).
4.3.3 The slit-shaped spaces and the SSA at the sample
The Supplement related to this article is available
scale
online at https://doi.org/10.5194/hess-22-4621-2018-
Since the central pore diameter d is proportional to the cor- supplement.
responding particle diameter D, the slit width αd, the slit
length βd and the specific surface area SSAi of each unit cell
are associated with the particle size. The calculated values of Author contributions. CCC developed the method and wrote the
paper. DHC performed the analysis and contributed ideas and com-
αd, βd and SSAi of clay, silt, fine sand and coarse sand parti-
ments on the method and writing.
cles for the loamy sand (code: 3170) are listed in Fig. 8. The
results confirm that the pores formed by bigger soil particles
are large with a correspondingly large slit width αd; this is Competing interests. The authors declare that they have no conflict
similar to the results of Or and Tuller (1999), and the values of interest.
are on the same order of magnitude. It is common knowledge
that larger soil particles tend to have large surface areas, and
therefore, the slit length formed by the contact of soil par- Acknowledgements. This research was partially supported by
ticle edges should be relatively long, leading to the positive the Special Fund for Basic Scientific Research of Central Col-
relationship between the slit length βd and the particle diam- leges (310829162015) and by the National Natural Science
eter as shown in Fig. 8. This result is different from that in Foundation of China (41472220). The authors thank Kang Qian
Or and Tuller (1999), where the slit length βd was inversely for providing the UNSODA unsaturated soil hydraulic property
proportional to the particle diameter. In addition, the SSAi of database.
the ith particle fractions decreased with an increase in the
particle diameter, which is consistent with the findings of Or Edited by: Roberto Greco
Reviewed by: Fatemeh Meskini-Vishkaee and
and Tuller (1999) and is in accordance with the general un-
one anonymous referee
derstanding of the SSA .
5 Conclusions References
The traditional models employed to translate the PSD into Arya, L. M. and Paris, J. F.: A physicoempirical model to predict
the SWRC underestimate the water content in the dry range the soil moisture characteristic from particle-size distribu-
of the SWRC. The errors originate from a setting that the tion and bulk density, Soil Sci. Soc. Am. J., 45, 1023–1030,
cumulative PoSD is equal to the corresponding PSD, which https://doi.org/10.2136/sssaj1981.03615995004500060004x,
resulted in an underestimate of the pore volume fraction of 1981.
Arya, L. M., Bowman, D. C., Thapa, B. B., and Cassel, D. K.:
the minimum pore diameter range and consequently the wa-
Scaling soil water characteristics of golf course and athletic field
ter content in the dry range of the SWRC. If slit-shaped sands from particle-size distribution, Soil Sci. Soc. Am. J., 72,
pore spaces are taken into consideration when estimating the 25–32, https://doi.org/10.2136/sssaj2006.0232, 2008.
PoSD with a pore model comprising a circle-shaped central Derjaguin, B. V. and Churaev, N. V.: Polymolecular adsorption and
pore connected to slit-shaped spaces, the pore volume frac- capillary condensation in narrow slit pores, Prog. Surf. Sci., 40,
tion of the minimum pore diameter range will be accordingly 173–191, https://doi.org/10.1016/0079-6816(92)90045-J, 1992.
increased; therefore, the SWRC can be more accurately pre- Fooladmand, H. R.: Estimating soil specific surface area using the
dicted. The estimation of the α and β values is a key step summation of the number of spherical particles and geometric
to predicting the SWRC in the proposed method. The α val- mean particle-size diameter, Afr. J. Agr. Res., 6, 1758–1762,
ues were obtained using 48 measured soil samples, and those 2011.
values served as input parameters for predicting the SWRC; Hamamoto, S., Moldrup, P., Kawamoto, K., Jonge, L. W.
D., Schjønning, P., and Komatsu, T.: Two-region ex-
then, the β values were readily calculated using a constraint
tended archie’s law model for soil air permeability and
on the estimated SSA . The validation results illustrate that the gas diffusivity, Soil Sci. Soc. Am. J., 75, 795–806,
SWRCs predicted using the proposed method provided the https://doi.org/10.2136/sssaj2010.0207, 2011.
best predictions of the SWRCs, closely followed by the scal- Haverkamp, R. and Parlange, J.-Y.: Predicting the water-
ing approach, and the traditional method performed worst. retention curve from particle-size distribution: 1. sandy
soils without organic matter1, Soil Sci., 142, 325–339,
https://doi.org/10.1097/00010694-198612000-00001, 1986.
Data availability. The unsaturated soil hydraulic properties and ba- Helland, J. O. and Skjæveland, S. M.: Relationship between cap-
sic soil properties of samples are available from the UNSODA illary pressure, saturation, and interfacial area from a model of
www.hydrol-earth-syst-sci.net/22/4621/2018/ Hydrol. Earth Syst. Sci., 22, 4621–4632, 20184632 C.-C. Chang and D.-H. Cheng: Predicting the soil water retention curve mixed-wet triangular tubes, Water Resour. Res., 43, 398–408, Pollacco, J. A. P., Webb, T., McNeill, S., Hu, W., Carrick, S., https://doi.org/10.1029/2006WR005698, 2007. Hewitt, A., and Lilburne, L.: Saturated hydraulic conductivity Hwang, S. I. and Choi, S. I.: Use of a lognormal dis- model computed from bimodal water retention curves for a range tribution model for estimating soil water retention curves of New Zealand soils, Hydrol. Earth Syst. Sci., 21, 2725–2737, from particle-size distribution data, J. Hydrol., 323, 325–334, https://doi.org/10.5194/hess-21-2725-2017, 2017. https://doi.org/10.1016/j.jhydrol.2005.09.005, 2006. Resurreccion, A. C., Moldrup, P., Tuller, M., Ferré, T. P. A., Hwang, S. I. and Powers, S. E.: Using particle-size distribution Kawamoto, K., Komatsu, T., and Jonge, L. W. D.: Rela- models to estimate soil hydraulic properties. Soil Sci. Soc. Am. tionship between specific surface area and the dry end of J., 67, 1103–1112, https://doi.org/10.2136/sssaj2003.1103, 2003. the water retention curve for soils with varying clay and Iwamatsu, M. and Horii, K.: Capillary condensation and adhesion organic carbon contents, Water Resour. Res., 47, 240–250, of two wetter surfaces, J. Colloid Interf. Sci., 182, 400–406, https://doi.org/10.1029/2010WR010229, 2015. https://doi.org/10.1006/jcis.1996.0480,1996.. Sakaki, T., Komatsu, M., and Takahashi, M.: Rules-of- Jayakody, K. P. K., Shimaoka, T., Komiya, T., and Ehler, Thumb for predicting air-entry value of disturbed sands P.: Laboratory determination of water retention character- from particle size, Soil Sci. Soc. Am. J., 78, 454–464, istics and pore size distribution in simulated MSW land- https://doi.org/10.2136/sssaj2013.06.0237n, 2014. fill under settlement, Int. J. Environ. Res., 8, 79–84, Sepaskhah, A. R. and Tafteh, A.: Pedotransfer function for estima- https://doi.org/10.22059/IJER.2014.696, 2014. tion of soil-specific surface area using soil fractal dimension of Jensen, D. K., Tuller, M., Jonge, L. W. D., Arthur, E., and Mol- improved particle-size distribution, Arch. Agron. Soil Sci., 59, drup, P.: A new Two-Stage Approach to predicting the soil water 1–11, https://doi.org/10.1080/03650340.2011.602632, 2013. characteristic from saturation to oven-dryness, J. Hydrol., 521, Sepaskhah, A. R., Tabarzad, A., and Fooladmand, H. R.: Phys- 498–507, https://doi.org/10.1016/j.jhydrol.2014.12.018, 2015. ical and empirical models for estimation of specific sur- Lebeau, M. and Konrad, J. M.: A new capillary and thin film face area of soils, Arch. Agron. Soil Sci., 56, 325–335, flow model for predicting the hydraulic conductivity of un- https://doi.org/10.1080/03650340903099676, 2010. saturated porous media, Water Resour. Res., 46, W12554, Shahraeeni, E. and Or, D.: Pore-scale analysis of evapora- https://doi.org/10.1029/2010WR009092, 2010. tion and condensation dynamics in porous media, Langmuir Liu, J. L., Xu, S. H., and Liu, H.: Investigation of different mod- the Acs Journal of Surfaces & Colloids, 26, 13924–13936, els to describe soil particle-size distribution data, Advances in https://doi.org/10.1021/la101596y, 2010. Water Science, 35, 68–76, https://doi.org/10.3321/j.issn:1001- Shirazi, M. A. and Boersma, L.: A unifying quantitative anal- 6791.2003.05.010, 2003. ysis of soil texture, Soil Sci. Soc. Am. J., 48, 142–147, Meskini-Vishkaee, F., Mohammadi, M. H., and Vanclooster, M.: https://doi.org/10.2136/sssaj1984.03615995004800010026x, Predicting the soil moisture retention curve, from soil particle 1984. size distribution and bulk density data using a packing den- Tuller, M. and Or, D.: Hydraulic conductivity of variably sity scaling factor, Hydrol. Earth Syst. Sci., 18, 4053–4063, saturated porous media: Film and corner flow in an- https://doi.org/10.5194/hess-18-4053-2014, 2014. gular pore space, Water Resour. Res., 37, 1257–1276, Mohammadi, M. H. and Meskini-Vishkaee, F.: Predicting the https://doi.org/10.1029/2000WR900328, 2001. film and lens water volume between soil particles using Tuller, M. and Or, D.: Water films and scaling of soil characteristic particle size distribution data, J. Hydrol., 475, 403–414, curves at low water contents, Water Resour. Res., 41, 319–335, https://doi.org/10.1016/j.jhydrol.2012.10.024, 2012. https://doi.org/10.1029/2005WR004142, 2005. Mohammadi, M. H. and Meskini-Vishkaee, F.: Predicting soil mois- Tuller, M., Or, D., and Dudley, L. M.: Adsorption and capillary con- ture characteristic curves from continuous particle-size distribu- densation in porous media: Liquid retention and interfacial con- tion data, Pedosphere, 23, 70–80, https://doi.org/10.1016/S1002- figurations in angular pores, Water Resour. Res., 35, 1949–1964, 0160(12)60081-2, 2013. https://doi.org/10.1029/1999WR900098, 1999. Mohammadi, M. H. and Vanclooster, M.: Predicting the soil mois- van Genuchten, M. T.: A closed-form equation for ture characteristic curve from particle size distribution with predicting the hydraulic conductivity of unsatu- a simple conceptual model, Vadose Zone J., 10, 594–602, rated soils, Soil Sci. Soc. Am. J., 44, 892–898, https://doi.org/10.2136/vzj2010.0080, 2011. https://doi.org/10.2136/sssaj1980.03615995004400050002x, Nemes, A., Schaap, M. G., Leij, F. J., and Wösten, J. 1980. H. M.: Description of the unsaturated soil hydraulic Zhuang, J., Jin, Y., and Miyazaki, T.: Estimating water re- database UNSODA version 2.0, J. Hydrol., 251, 151–162, tention characteristic from soil particle-size distribution us- https://doi.org/10.1016/S0022-1694(01)00465-6, 2001. ing a non-similar media concept, Soil Sci., 166, 308–321, Or, D. and Tuller, M.: Liquid retention and interfacial area in https://doi.org/10.1097/00010694-200105000-00002, 2001. variably saturated porous media: Upscaling from single-pore to sample-scale model, Water Resour. Res., 35, 3591–3605, https://doi.org/10.1029/1999WR900262, 1999. Hydrol. Earth Syst. Sci., 22, 4621–4632, 2018 www.hydrol-earth-syst-sci.net/22/4621/2018/
You can also read