Re-Evaluating the Climate Factor in Agricultural Land Assessment in a Changing Climate-Saskatchewan, Canada - MDPI
←
→
Page content transcription
If your browser does not render page correctly, please read the page content below
land
Article
Re-Evaluating the Climate Factor in Agricultural Land
Assessment in a Changing
Climate—Saskatchewan, Canada
Samantha A. Kerr 1,2, *, Yuliya Andreichuk 1 and David J. Sauchyn 1,2
 1   Prairie Adaptation Research Collaborative (PARC), University of Regina, Regina, SK S4S 7J7, Canada;
     andreici@uregina.ca (Y.A.); sauchyn@uregina.ca (D.J.S.)
 2   Department of Geography and Environmental Studies, University of Regina, Regina, SK S4S 0A2, Canada
 *   Correspondence: SamanthaKerr@uregina.ca

 Received: 13 February 2019; Accepted: 15 March 2019; Published: 19 March 2019

 Abstract: We established the statistical relationships between seasonal weather variables and average
 annual wheat yield (Hard Red Spring and Durum wheat: Triticum spp.) for the period of 1979–2016
 for 296 rural municipalities (RMs) throughout six soil zones comprising the arable agricultural
 zone of Saskatchewan, Canada. Controlling climate variables were identified through Pearson’s
 product moment correlation analysis and used in stepwise regression to predict wheat yields in each
 RM. This analysis provided predictive regression equations and summary statistics at a fine spatial
 resolution, explaining up to 75% of the annual variance of wheat yield, in order to re-evaluate the
 climate factor rating in the arable land productivity model for the Saskatchewan Assessment and
 Management Agency (SAMA). Historical climate data (1885–2016) and Regional Climate Model
 (RCM) projections for the growing season (May–August) were also examined to put current climatic
 trends into longer-term perspective, as well as develop a better understanding of possible future
 climatic impacts on wheat yield in Saskatchewan. Historical trends demonstrate a decrease in
 maximum temperature and an increase in minimum temperature and precipitation throughout all
 soil zones. RCM projections also show a potential increase in temperatures and total precipitation by
 5 ◦ C and 10%, respectively. We recommended against a modification of the climate factor rating at this
 time because (1) any increase in wheat yield could not be attributed directly to the weather variables
 with the strongest trends, and (2) climate and wheat yield are changing more or less consistently
 across the zone of arable land, and one soil zone is not becoming more productive than another.

 Keywords: agriculture; Canadian Prairies; climate change; climate projections; land values;
 regression analysis; Saskatchewan; wheat yield

1. Introduction
     Saskatchewan, one of the Canadian Prairie provinces, has approximately 42% of Canada’s
cropland [1]. More than half of Canadian farms are located within the Canadian Prairie provinces,
where more than 32,000 farms seed and produce wheat in Saskatchewan alone [1]. In 2016, wheat
exports of approximately $3 million CAD represented two of the top ten exports for Saskatchewan [2].
This area is vulnerable to a variable hydroclimate and the resulting year-to-year variation of differences
in agricultural production of crops and livestock is due to weather [3]. This study provides
an evaluation of the influence of several climatic variables on wheat (Triticum spp.) yield over
Saskatchewan’s arable agricultural zone (Figure 1). The recognition of significant climate change
in this region prompted a re-evaluation of the role of the climate in the assessment of the value of
agricultural land.

Land 2019, 8, 49; doi:10.3390/land8030049                                        www.mdpi.com/journal/land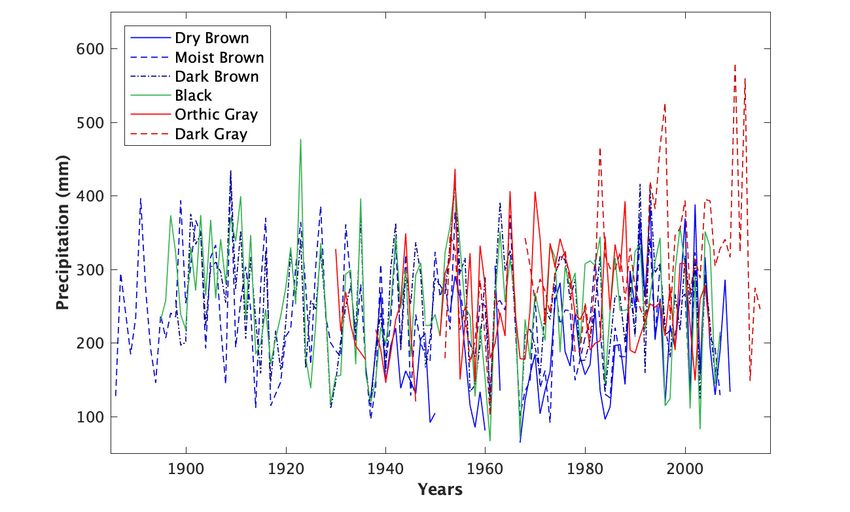
precipitation is low (approximately 300–500 mm), but most of it occurs during the growing season in
the spring and summer months. It follows a southwest to northeast gradient, where the southwest is
much drier. Crop yields are limited by the generally dry climate but also sensitive to climatic
variability and extreme weather, including heat waves, drought, frost, minimum and maximum
temperatures, plough winds, hail, and excess moisture. Continuous snow cover throughout the
Land 2019, 8, 49                                                                              2 of 23
winter months is essential as water supply and early summer moisture depends on the snowmelt.

                           Figure 1. Study area: Saskatchewan’s arable agricultural zone.
                           Figure 1. Study area: Saskatchewan’s arable agricultural zone.
       Saskatchewan’s climate is characterized by short, hot summers and long, cold winters. Annual
      Since theissettlement
precipitation                   of the Prairie
                     low (approximately          provinces,
                                            300–500           agricultural
                                                       mm), but    most of itproduction
                                                                                occurs duringhas the
                                                                                                  adapted    to the
                                                                                                       growing        highly
                                                                                                                   season  in
variable    and   cyclical climatic conditions    of this semiarid   region  [4]. Crop   production
the spring and summer months. It follows a southwest to northeast gradient, where the southwest is       in Saskatchewan
has
much thus   become
         drier.  Crop much
                       yields more   diversified
                              are limited  by thewith    an increase
                                                   generally           in pulse
                                                               dry climate   but crops   (i.e., peas,
                                                                                  also sensitive       lentils), variability
                                                                                                    to climatic   soybeans,
and   corn   [5]. Crop   production   data  from   2005  to 2016  show    an increase   in
and extreme weather, including heat waves, drought, frost, minimum and maximum temperatures,the  average    yield,   and this
trend
plough  is consistent
           winds, hail, with
                           andprojections  of higher
                               excess moisture.        crop yieldssnow
                                                     Continuous     in a warming     climate [6,7].
                                                                           cover throughout        theResearch      suggests
                                                                                                         winter months     is
that  crop   producers     could benefit  from   a warming     climate   [5,8],
essential as water supply and early summer moisture depends on the snowmelt.    provided     that agricultural     practices
and Since
       policiesthecan    be adapted
                    settlement  of the to  withstand
                                        Prairie          increased
                                                 provinces,           climatic
                                                              agricultural        variability
                                                                             production      has[9,10].
                                                                                                  adapted Climate
                                                                                                              to the model
                                                                                                                      highly
projections
variable andshow        warming
                  cyclical climatictemperatures
                                     conditions ofincreased     precipitation
                                                     this semiarid   region [4].(i.e.,
                                                                                   Cropinproduction
                                                                                           the amountinand       timing, as
                                                                                                            Saskatchewan
well  as the
has thus        form),much
            become      but also increased
                              more            evapotranspiration,
                                     diversified   with an increasewhich
                                                                       in pulsewill result
                                                                                  crops      in peas,
                                                                                         (i.e., decreased     summer
                                                                                                        lentils),        soil
                                                                                                                  soybeans,
moisture     [4,11,12].  Also, an increase   in the  number    of frost-free  days  (FFD)    and
and corn [5]. Crop production data from 2005 to 2016 show an increase in the average yield, and    growing     degree   days
(GDD)     could improve Prairie wheat crop production as well as reduce the number of days between
this trend is consistent with projections of higher crop yields in a warming climate [6,7]. Research
seeding and harvest seasons [13]. Rising temperature could also, however, be favorable for pests,
suggests that crop producers could benefit from a warming climate [5,8], provided that agricultural
disease, and weeds [14]. Thus, research on the degree to which crop productivity varies with climate
practices and policies can be adapted to withstand increased climatic variability [9,10]. Climate
has taken on a new relevance with concerns about the impacts of global climate change on food
model projections show warming temperatures increased precipitation (i.e., in the amount and timing,
security [5]. Ultimately, this potential for increased productivity implies rising values of
as well as the form), but also increased evapotranspiration, which will result in decreased summer
Saskatchewan’s arable land.
soil moisture [4,11,12]. Also, an increase in the number of frost-free days (FFD) and growing degree
      The Saskatchewan Assessment and Management Agency (SAMA) is an independent provincial
days (GDD) could improve Prairie wheat crop production as well as reduce the number of days
government agency within Saskatchewan that provides property assessment valuations as a basis for
between seeding and harvest seasons [13]. Rising temperature could also, however, be favorable
tax policy and property tax rates [15]. There is a reassessment of land values every five years. For
for pests, disease, and weeds [14]. Thus, research on the degree to which crop productivity varies
rural Saskatchewan, SAMA uses an arable land model to determine the assessed value of agricultural
with climate has taken on a new relevance with concerns about the impacts of global climate change
on food security [5]. Ultimately, this potential for increased productivity implies rising values of
Saskatchewan’s arable land.
       The Saskatchewan Assessment and Management Agency (SAMA) is an independent provincial
government agency within Saskatchewan that provides property assessment valuations as a basis for
tax policy and property tax rates [15]. There is a reassessment of land values every five years. For rural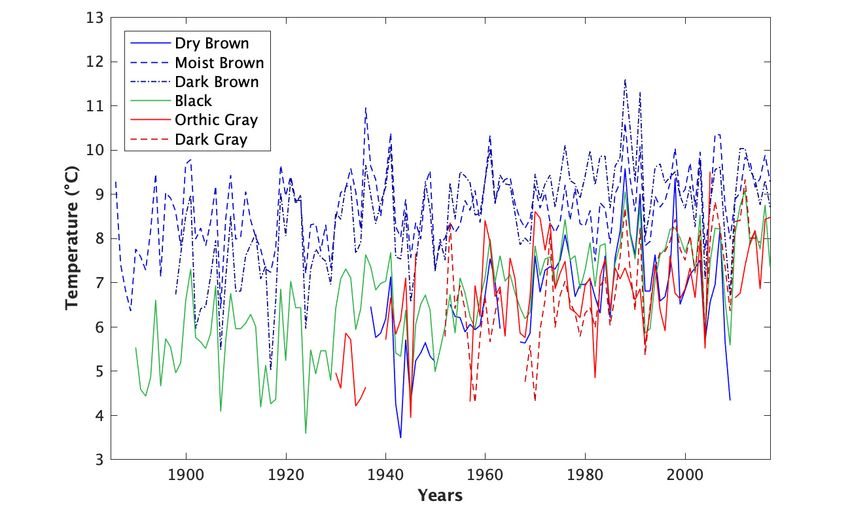
Land 2019, 8, 49 3 of 23
Saskatchewan, SAMA uses an arable land model to determine the assessed value of agricultural
land according to ratings of climate, soil characteristics, and physical, economic, and regional factors.
Climate is a major factor in their model. The climate rating varies by rural municipality (RM) according
to soil zone, accounting for the relationship between climate and soil productivity. Further description
of the methodology and calculations that SAMA uses can be found at: https://www.sama.sk.ca/
property-owner-services/understanding-assessment/methods-assessment.
Significant changes in crop diversity (i.e., pulse crops, soybeans, corn, etc.) and production [5],
as well as the climate of the Canadian Prairie provinces [9,16], warranted a re-evaluation of the climate
factor in SAMA’s arable land productivity model, and a potential reassessment of property values.
Current climate ratings are based on 1973–1989 climatic and wheat yield data [17]. Hard Red Spring
and Durum wheat crops were selected for this analysis, as they continue to be produced extensively
throughout the agricultural region of Saskatchewan. Production of wheat yield has increased from
1979 to 2016 under a changing climate. If Saskatchewan farms produce more yield per hectare per year
with the changing climate, the assessed value of that farm land should ultimately change. However,
awareness of the potential effects of a changing climate on crop yields first requires an understanding
of how specific crops respond to the natural hydroclimatic variability of the region [18]. While there is
research on the prediction of crop yield through complex numerical modeling [8,19–24], this was not
the purpose of this research.
Therefore, the primary objective of this research was to determine whether recent climate changes
are associated with significant trends in crop productivity and, in turn, agricultural land values in
Saskatchewan’s arable agricultural zone, and to understand how these trends have varied over space
and time. Any significant change in climate and wheat yields would thus necessitate a change in the
climate factor rating for SAMA’s arable agricultural productivity model. Neither SAMA, the land
assessment agency, nor the researchers quantitatively define significant changes. We collaboratively
evaluated the changes in climate and yield in the context of projected further climate changes, and
according to whether the rates were (1) consistent across the agricultural landscape or differed among
soil zones, and (2) attributable to natural variability in the regional hydroclimatic regime.
2. Materials and Methods
The geographic sampling unit for this research was the RMs of Saskatchewan. The study area,
as depicted by the RM boundaries, is shown in Figure 1. The use of high-resolution geographic data
sets enables accurate estimations of wheat yield in Saskatchewan’s arable agricultural zone, capturing
the spatial variation and influence of climate change.
2.1. Soil Data
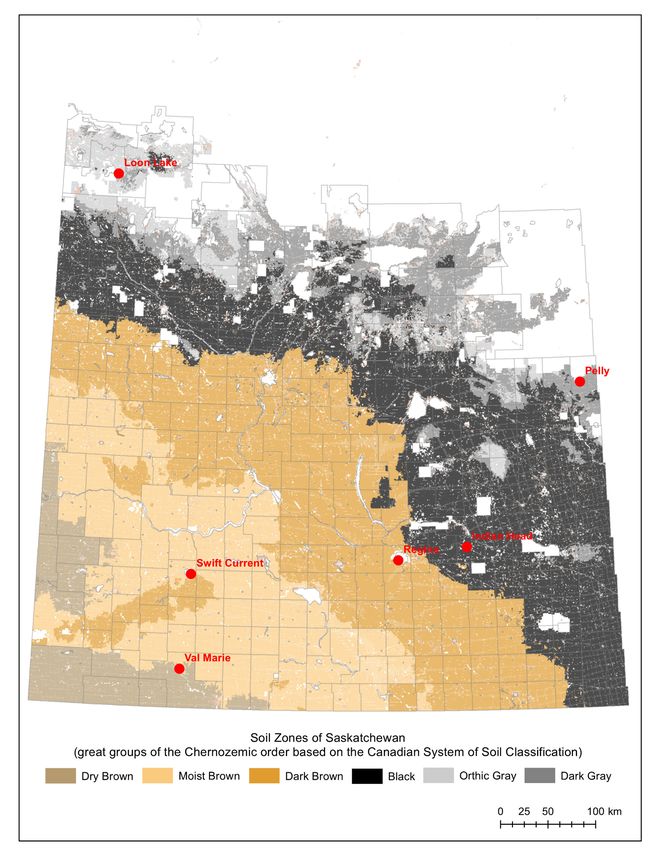
Soil zone data (Figure 2) were provided by SAMA. The six major soil zones within the arable
agricultural zone of Saskatchewan are Dry Brown, Moist Brown, Dark Brown, Black, Orthic Gray, and
Dark Gray. These soil zones are identified by soil surface color, which is determined by the organic
matter type and content within the soil. The Brown, Dark Brown, Black, and Dark Gray soil zones
are based upon the Canadian System of Soil Classification (CSSC) color criteria for the great groups
of the Chernozemic soil order, while the Orthic Gray soil zone is based upon CSSC color criteria of
the Luvisolic soil order. Soil zones are the best spatial representation of regional climate zones, since
each type of soil has developed under a distinct temperature and precipitation regime, as well as
vegetation conditions. Since there is a general decrease in annual precipitation from the northeast to
the southwest, there is also a corresponding decline in productivity from the Black to Dark Brown
to Dry Brown soils. This soil information for the province allows for the analysis of climate-driven
variation in soil and crop productivity at high spatial resolution.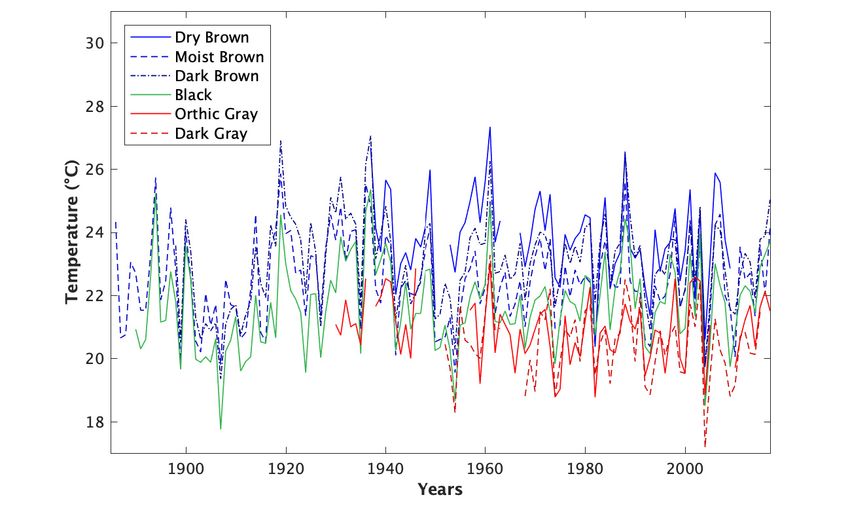
Land 2019, 8, 49                                                                                             4 of 23
Land 2019, 8, x FOR PEER REVIEW                                                                             5 of 23

                  Soil
     Figure 2.2.Soil
     Figure            zones,
                     zones,    rural
                            rural    municipalities
                                  municipalities     (RMs),
                                                 (RMs),      and selected
                                                        and selected       weather
                                                                     weather stationsstations  (in red)
                                                                                      (in red) within   within
                                                                                                      southern
     southern   Saskatchewan.
     Saskatchewan.
2.2. Weather Data
     Confidential weather station data for 1979–2016 were provided by Information Systems Management
(ISM) Canada from the Weather Company for 714 weather stations computed by nearest-neighbor
interpolation with 30-km (km) spatial resolution (Figure 3). From this large monthly data set of total
precipitation, average, minimum, and maximum temperature, and potential evapotranspiration (PET),
annual and seasonal values were computed for each station and the difference in trends (1979–2016)
were documented. Thirty-eight years of weather records do not fully represent the natural variability
Land 2019, 8, 49                                                                                         5 of 23

of the climate system, so in addition to this interpolated data set, historical records (1885–2016) from
Environment and Climate Change Canada’s Adjusted and Homogenized Canadian Climate Data
(AHCCD) [25] were used to determine the long-term trends and natural variability of minimum and
maximum temperatures and total precipitation for the growing season throughout the six soil zones
prior to 1979. While there will be differences among the climate stations throughout the soil zones,
within each of the six soil zones, we selected the longest and most complete record for a single weather
station, as averaging climatic data smooths the natural variability and extremes. The selected stations
Land 2019, 8, x FOR PEER REVIEW                                                                   6 of 23
were: Swift Current, Regina, Indian Head, Val Marie, Loon Lake, and Pelly (Figure 2, Table 1).

      Figure 3. Interpolated weather station (1979–2016) network and rural municipality (RM) boundaries.
        Figure 3. Interpolated weather station (1979–2016) network and rural municipality (RM) boundaries.

2.3. Crop Yield Data
     Confidential detailed crop yield data for 1973–2016 were provided by the Saskatchewan Crop
Insurance Corporation (SCIC). Saskatchewan crop yield data by RM are also publicly available at
http://www.agriculture.gov.sk.ca/rmyields. Crop yield data were converted from bushels per acre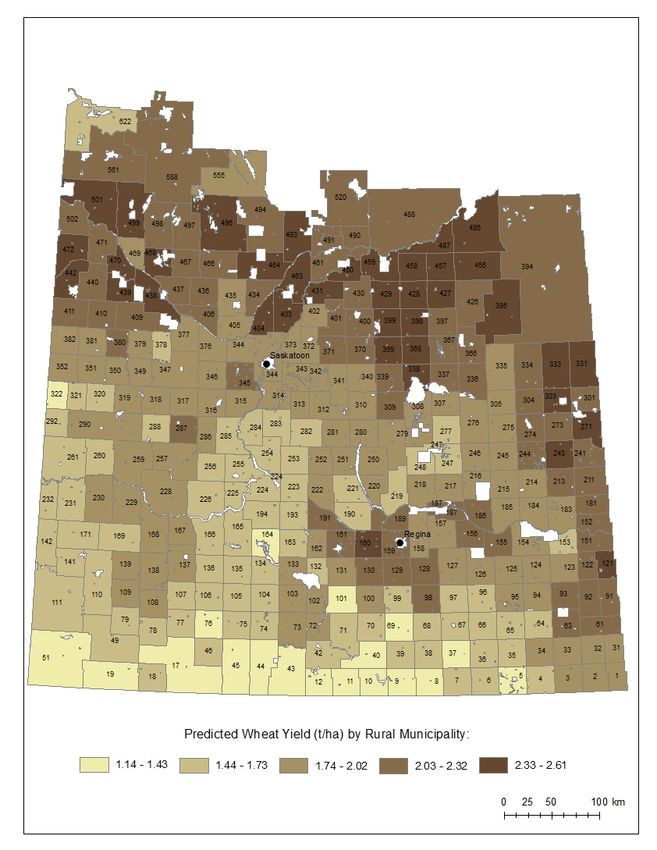
Land 2019, 8, 49                                                                                    6 of 23

                               Table 1. Historical weather station information.

        Station Name      Latitude (◦ N)      Longitude (◦ W)    Length of Record       Soil Zone
          Val Marie            49.37             −107.85             1937–2010        Dry Brown
        Swift Current          50.27             −107.73             1885–2017        Moist Brown
           Regina              50.43             −104.67             1898–2017        Dark Brown
        Indian Head            50.55             −103.65             1889–2017           Black
         Loon Lake             54.02             −109.13             1930–2017        Orthic Gray
            Pelly              52.08             −101.87             1951–2016         Dark Gray

      Ten km gridded daily weather data (1950–2010) compiled by Natural Resources Canada
(ANUSPLIN) [26] were also used to compute historical trends in growing degree days (GDDs)
and frost-free days (FFDs). While this record provides complete and uniform coverage of daily
climatic data for North America, minimum and maximum temperatures are smoothed as a result of
interpolation [27]. Both GDDs and FFDs were computed for the grid point closest to the AHCCD
historical weather station. GDDs are a measure of accumulated heat over a period of time, and are
calculated as the difference between an average of minimum and maximum temperature, as well as a
base temperature that is required for plant growth (i.e., minimum temperature for wheat to grow is
5 ◦ C). FFDs, on the other hand, are a measure of the number of days between the average last date of
0 ◦ C in the spring and the average first date of 0 ◦ C in the fall.

2.3. Crop Yield Data
     Confidential detailed crop yield data for 1973–2016 were provided by the Saskatchewan Crop
Insurance Corporation (SCIC). Saskatchewan crop yield data by RM are also publicly available at http:
//www.agriculture.gov.sk.ca/rmyields. Crop yield data were converted from bushels per acre (bu/ac)
to metric tons per hectare (t/ha) using the appropriate conversion factor (1 bu/ac = 0.06725 t/ha).
A time series of average wheat yield (t/ha) for 1973–2016 is plotted in Figure 4. In general, wheat
yields have been increasing over time throughout Saskatchewan’s arable agricultural zone, and in
the last five years, wheat yields have been higher than they have ever been. There is a noticeable
pattern from the southwest to the northeast, where the average yield is greater towards the northeast.
The Brown and Dark Brown soil zones show similar trends in terms of average wheat yield, while the
Black and Gray soil zones are also comparable to each other.

2.4. Relationship of Wheat Yield to Climate
     Using the RM boundaries as the geographical sampling unit, interpolated weather stations were
assigned to each of the RMs by first calculating the centroid of each RM polygon, then determining the
closest weather station using a buffer of approximately 30 km. Then, interpolated weather data were
extracted and averaged for 1979–2016. Next, statistical relationships between wheat yield and climate
were determined through Pearson’s product moment correlation analysis using the variables listed
in Table 2.
     The correlation of average annual wheat yield (t/ha) to annual and seasonal precipitation and
temperature variables was analyzed by RM within each of the six soil zones to identify climatic
controls of wheat yield. Significant positive correlation (p < 0.05) between yield and growing season
precipitation was highest in the semiarid Brown soil zone, and decreased throughout the Dark Brown
and Black soil zones. It was not significant in the region of Gray soils. Significant negative correlation
(p < 0.05) with temperature during the summer months reflects the detrimental effect of midsummer
hot, dry weather on wheat yields (i.e., when crops are exposed to heat and moisture stress), except for
the Gray soil zones.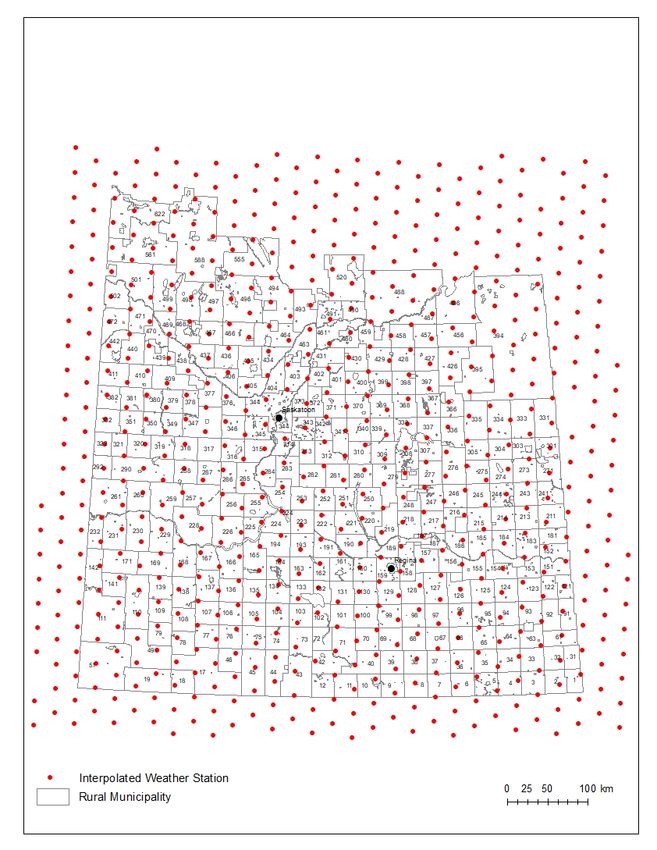
Land 2019, 8, x FOR PEER REVIEW                                                                              7 of 23

The Brown and Dark Brown soil zones show similar trends in terms of average wheat yield, while
Land 2019, 8, 49                                                                         7 of 23
the Black and Gray soil zones are also comparable to each other.

                  Figure 4. Average wheat yield (t/ha) by rural municipality (RM) (1979–2016).
                  Figure 4. Average wheat yield (t/ha) by rural municipality (RM) (1979–2016).
       Regression models of average annual wheat yields (1979–2016) with historical interpolated
 seasonal   climateofwere
2.4. Relationship      Wheatcreated  forClimate
                              Yield to    Saskatchewan’s arable agricultural zone by RM. Initial exploratory
 analysis revealed that regression equations at this fine scale, compared to a larger geographic area
(i.e., Using  the results
       soil zone,  RM boundaries     as the
                           not shown),       geographical
                                          were              sampling
                                                better predictors       unit, interpolated
                                                                   of average   annual wheatweather
                                                                                                yield.stations were
                                                                                                       At the larger
assigned    to each
 scale, where         of the
                climate   andRMs
                              yieldby  first
                                    data     calculating
                                           were  averagedthe centroid
                                                          over  the soilofzone
                                                                           eachlevel,
                                                                                  RM the
                                                                                      polygon,   thenofdetermining
                                                                                          influence     temperature
the  closest  weather    station using   a buffer  of approximately    30  km.  Then,
was lost, and precipitation became the dominant predictor of wheat yield for most RMs. interpolated   weather   data
                                                                                                          Overall, at
were    extracted   and  averaged   for  1979–2016.   Next, statistical relationships   between   wheat
 the scale of RMs, both temperature and precipitation were significant predictors of average annual       yield and
climate   were determined
wheat yield,                   throughof
                 and the deviations       Pearson’s
                                            predictedproduct  moment correlation
                                                       from observed     wheat yields analysis using thethan
                                                                                         were smaller      variables
                                                                                                               when
listed  in Table   2.
 using regression models based on soil zones.
       While the validity of the regression models for all 296 RMs confirms that weather is the dominant
 determinant of annual wheat yield, the maximum variance of 75% explained by weather variables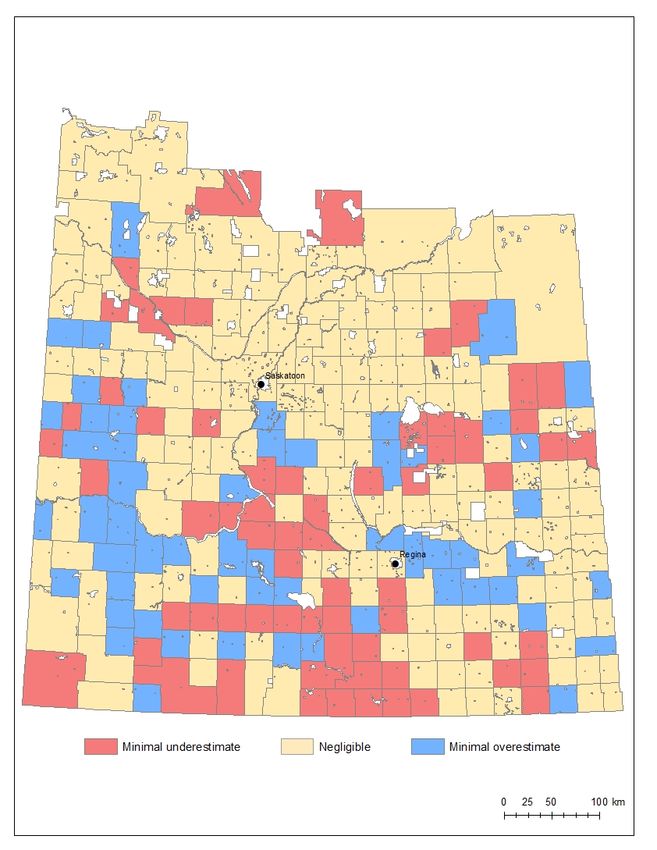
Land 2019, 8, 49                                                                                                    8 of 23

reflects the influence of other factors such as local topography and soil conditions, disease and pests,
storm damage, and changes in farming practices (i.e., discontinuing use of summer fallow) [28].
While simple regression gave reasonable predictions of wheat yield, these statistical models are not
numerical crop models, that is, they are not intended to be predictors of crop yields derived from
an understanding of the environmental and physiological processes that sustain and limit plant
productivity [14,29].

               Table 2. Climatic variables legend for correlation analysis and regression equations *.

                                                   Temperature (◦ C)
                                          Average monthly temperature a
                                  Average spring (March, April, May) temperature
                                 Average summer (June, July, August) temperature
                                 Average maximum temperature (spring & summer)
                                 Average minimum temperature (spring & summer)
                                                  Precipitation (mm)
                                             Total monthly precipitation b
                                    Total spring (March, April, May) precipitation
                                   Total summer (June, July, August) precipitation
      * From interpolated weather station data. a Average monthly temperature: averages for January through December.
      b Total monthly precipitation: totals for January to December.

      Regression equations were thus developed to establish the influence of climate on wheat yields
over 38 years and 296 RMs, using the stepwiselm function in MATLAB R2016b (MathWorks® ). Climatic
variables that were significantly (p < 0.05) correlated with wheat yield represented a pool of potential
predictors. Linear stepwise regression is an iterative application of forward selection and backward
elimination [30]. The dependent variable is wheat yield (t/ha), and the resulting equation for each RM
is a unique set of independent climatic variables, representing the climatic controls on wheat yield
(t/ha) in a given RM. Using the stepwise regression methodology, after a variable is added to the
model, any nonsignificant (below the threshold of 95%) variable is removed. Therefore, backward
elimination removed redundant variables from the model [30].
      Yield regression models were evaluated by comparing the model-predicted yields to the
observed yield over the 38-year period of 1979–2016 using goodness-of-fit measures: the coefficient
of determination (R2 ) and the root mean square error (RMSE). The coefficient of determination (R2 )
is a measure of the proportion of the total variance in the observed data shared with the predictors
in the model, ranging from 0 to 1, where values closer to 1 indicate a better agreement between the
observed and predicted data. Regression equations accounted for approximately 20 to 75% of annual
variation in wheat yield. Because R2 values can be highly sensitive to outliers in data sets, the RMSE
was also used to evaluate the model performance. The RMSE is a measure of the average differences
between predicted and observed values, providing an estimate of model error in the units of the
variable (i.e., wheat yield). The sum of squared errors (SSE) was computed for each unique regression
equation as a measure of variance. The SSE is a unitless value calculated from the sum of squared
deviation, or difference between the observed and predicted values. SSE values ranged from 4.52
to 17.49 throughout the six soil zones (Dry Brown: 4.52–8.90, Moist Brown: 5.01–10.75, Dark Brown:
5.28–13.74, Black: 6.03–15.97, Orthic Gray: 8.14–16.06, and Dark Gray: 9.12–17.49). For example, RM
#17 (Table 3) within the Dry Brown soil zone had the highest goodness of fit (R2 ) and the lowest
variance (SSE), indicating that this model best fits the observed data with minimum variance for the
soil zone. The RMSE and SSE are important measures of statistical precision due to both variance and
outliers in the data. F and p-values also were used to verify the statistical significance of the regression
analysis. The regression models did not include more than four predictors per equation, limiting the
risk of overfitting the models.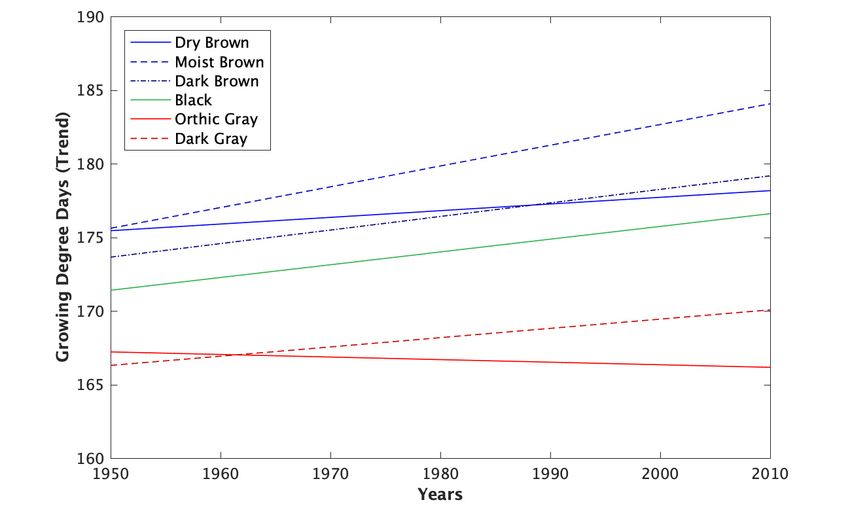
Land 2019, 8, 49                                                                                                                                                                  9 of 23

                                               Table 3. RM-based regression equation statistics for selected RMs (one per soil zone).

                                                                                               Average Yield      Predicted
    Soil Zone        RM #                         Regression Equation *                                                            R2       RMSE       SSE      F-Stat       p-Value
                                                                                                  (t/ha)         Yield (t/ha)
   Dry Brown          17               y = −0.621 + 0.007 (spr_pr) + 0.005 (sum_pr)                1.352            1.355          0.74      0.36      4.52      49.70     5.94 × 10⁻¹¹
                                   y = 3.875 + 0.008 (may_pr) + 0.004 (sum_pr) − 0.102
  Moist Brown         46                                                                           1.436            1.445          0.68      0.41      5.76      24.26     1.41 × 10⁻⁸
                                                         (sum_tmax)
  Dark Brown          100        y = 2.884 − 0.112 (jul_t) + 0.004 (jun_pr) + 0.005 (spr_pr)       1.717            1.724          0.62      0.39       5.29     18.50     2.73 × 10⁻⁷
     Black            469             y = 6.016 + 0.006 (sum_pr) − 0.156 (sum_tmax)                2.286            2.309          0.57      0.53       9.95     23.26     3.76 × 10⁻⁷
  Orthic Gray         499             y = 6.335 + 0.005 (sum_pr) − 0.174 (sum_tmax)                2.136            2.160          0.55      0.55      10.75     21.20     9.30 × 10⁻⁷
  Dark Gray           501            y = 8.580 − 0.229 (sum_tmax) + 0.172 (spr_tmin)               2.318            2.337          0.49      0.59      12.05     16.94     7.14 × 10⁻⁶
      * spr_pr: total spring precipitation; sum_pr: total summer precipitation; may_pr: total May precipitation; jun_pr: total June precipitation; sum_tmax: average maximum summer
      temperature; spr_tmin: average spring minimum temperature; and jul_t: average July temperature.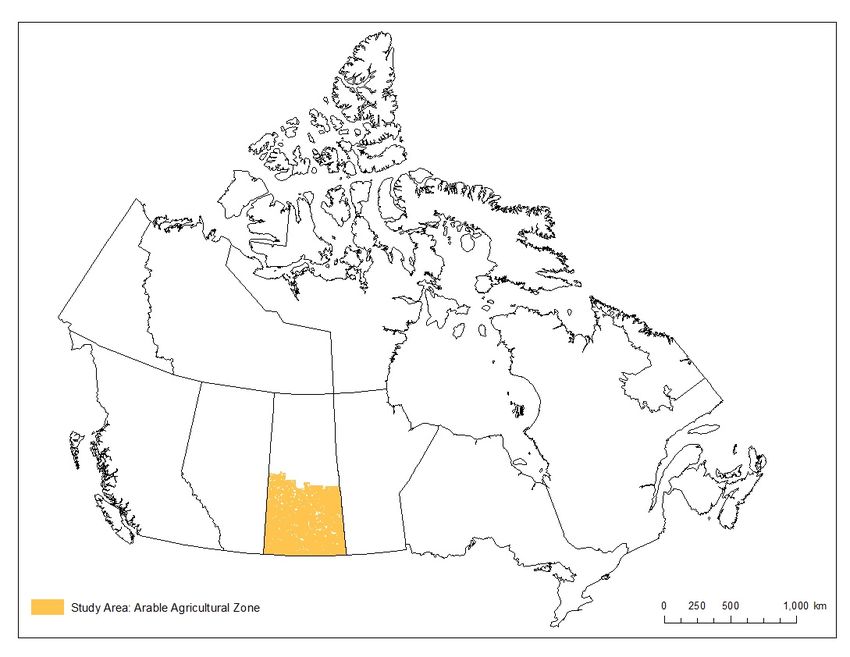
Land 2019, 8, 49                                                                                    10 of 23

     In Table 3, the best RM-based regression equations and summary statistics are provided for one
RM per soil zone. Differences in the climate determinants of wheat yield demonstrate the hydroclimatic
gradients throughout Saskatchewan’s arable agricultural zone over time, with the prominent southwest
to northeast gradient of lower temperatures and greater precipitation and the transition in soil zones.
Correlation and regression results indicate the importance of growing season (spring and summer
months) precipitation and temperature variables as predictors of wheat yield.

2.5. Climate Projections of Precipitation and Temperature Variables
     For climate projections, we used output from an ensemble of seven Regional Climate Models
(RCMs) from the North American domain of the Coordinated Regional Climate Downscaling
Experiment (NA-CORDEX). All RCMs were forced with RCP 8.5, which is a high-emissions pathway.
Raw monthly data for minimum (tasmin) and maximum (tasmax) temperatures and precipitation (pr)
for 2021–2100 were extracted from NetCDF files for North America. For temperature variables, units
were converted from K to ◦ C, and precipitation values were converted from kg/m2 /s to mm/month.
Leap years were taken into consideration when converting mm/day to mm/month. Next, grid
points below 55◦ N within the provincial boundary of Saskatchewan were selected. Growing season
(May–August) mean tasmin, tasmax, and total pr were calculated for each grid point, and then
averaged over the agricultural zone for each model separately. Raw data were not bias-corrected,
as we were only comparing future and historical simulations, and presumably they were subject to the
same degree of bias.

3. Results

3.1. Climate Data
      Temperature and precipitation trends have changed throughout all soil zones from 1979 to 2016.
Table 4 gives the direction of change from trends over 38 years for each weather variable by soil zone,
and over Saskatchewan’s arable agricultural zone, computed as the difference between 2016 and 1979
trend values. Throughout the six soil zones, the average standard error (SE) for mean, maximum,
and minimum temperature trends fell between 1.13 and 4.30 (i.e., annual: 1.23–1.95, growing season:
1.13–1.66, and winter: 1.59–4.30). The average SE for total precipitation trends was 104.60 (annual), 72.61
(growing season), and 30.93 (winter). The average SE for mean, maximum, and minimum PET trends
fell between 0.06 and 5.54 (i.e., annual: 0.06–3.12, growing season: 0.08–5.54, and winter: 0.13–0.72).
The most apparent change in climatic trends is an increase in minimum temperatures, especially in
winter. The statistical relationships between weather and wheat yield do not include minimum winter
temperature as a correlate or predictor. This may change, however, as winter continues to get warmer
and thus shorter in terms of the length of the frost-free period and growing season. The amount of
warming is greatest in the Black and Gray soil zones. Thus, the climate of Saskatchewan is warming
by becoming much less cold, rather than hotter. Maximum temperatures, especially in the growing
season, have actually declined. This could be the result of more humid conditions and increased
precipitation (high summer temperatures are associated with dry, clear conditions). These documented
climate changes from trends are generally favorable for crop production, as the decrease in maximum
temperatures should expose crops to less heat and moisture stress.
      There is also an upward trend in precipitation in all soil zones since 1979. While wetter conditions
are consistent with a warming climate, the results of our analysis of precipitation over the past
several decades should be interpreted with caution. The continental climate of western Canada is
characterized by large variability in precipitation from year to year and decade to decade. The time
series analyzed here starts with a dry decade (the 1980s) and ends with the relatively wet conditions
of the past decade. This decadal variability could be a factor in the upward trends observed over
the past several decades. Results from this analysis also show a decrease in PET for all soil zones
over all time periods, which coincides with decreasing trends of evaporation (E) and PET across the
Land 2019, 8, 49 11 of 23
Canadian Prairies [31]. Our research agrees with Gameda et al. (2007), who found significant decreases
in maximum temperature and increasing precipitation during June and July for the Black, Dark Brown,
and Brown soil zones of the Canadian Prairies [32].
Table 4. Summary of climatic change from trends by soil zone and Saskatchewan’s arable agricultural
zone (1979–2016).
Time Climate Dry Moist Dark Orthic Dark Arable
Black
Period Variable * Brown Brown Brown Gray Gray Agricultural Zone
Tmean 0.1 0.0 0.0 0.2 0.3 0.2 0.2
Tmax −1.2 −1.3 −1.5 −1.5 −1.2 −1.3 −1.3
Tmin 0.7 0.9 1.1 1.2 1.4 1.3 1.5
Total P 235 275 300 273 177 203 225
Annual PETmean −2.05 −2.44 −2.54 −2.30 −1.53 −1.76 −1.94
PETmax −6.05 −7.06 −7.24 −7.24 −5.97 −6.53 −6.29
PETmin −0.18 −0.15 −0.15 −0.14 −0.13 −0.12 −0.13
GDD ** 2.7 8.5 5.5 5.2 −1.0 3.8 5.6
FFD ** 2.7 8.6 3.8 2.3 −2.1 8.3 8.1
Tmean −0.8 −1.1 −1.3 −1.1 −0.5 −0.6 −0.8
Tmax −2.1 −2.6 −3.2 −3.5 −2.6 −2.9 −2.8
Tmin 0.9 1.0 0.9 1.4 1.3 1.2 1.2
Growing
Total P 165 192 211 206 142 162 169
Season
PETmean −4.17 −5.14 −5.68 −5.22 −3.11 −3.72 −4.25
PETmax −10.51 −12.57 −14.28 −14.02 −9.81 −11.30 −11.59
PETmin −0.23 −0.20 −0.24 −0.26 −0.18 −0.20 −0.21
Tmean 0.1 0.3 0.6 0.5 0.6 0.5 0.7
Tmax −2.4 −2.1 −1.1 −0.7 −0.3 −0.3 −0.9
Tmin 0.6 1.3 1.9 1.7 2.3 1.9 2.4
Winter Total P 8.0 20.0 23.0 14.0 −6.0 −1.0 7.0
PETmean −0.65 −0.46 −0.17 −0.10 −0.03 −0.05 −0.16
PETmax −5.28 −4.07 −2.07 −1.33 −0.68 −0.75 −1.77
PETmin −0.10 0.04 0.07 0.04 0.01 −0.01 0.02
* Tmean = mean temperature (◦ C); Tmax = mean maximum temperature (◦ C); Tmin = mean minimum temperature (◦ C);
Total P = total precipitation (mm); PETmean = mean PET (mm); PETmax = mean maximum PET (mm); PETmin = mean
minimum PET (mm). ** Growing degree days (GDDs) and frost-free days (FFDs) were calculated for 1950–2010.
Therefore, because we examined only 38 years of climate data, the interpretation of the climatic
changes from trends by soil zone should be done so with caution. The trends we see in the shorter
climate record for this current analysis (1979–2016) coincide with the upward part of a natural cycle in
the regional hydroclimate. Longer instrumental records for Saskatchewan (1885–2016) show increasing
trends in growing season minimum temperatures and a decreasing trend in growing season maximum
temperatures, and emphasize the natural variability of precipitation over the length of a longer
historical instrumental record. Figures 5 and 6 are plots of minimum and maximum growing season
temperatures for 1885–2016 for the six soil zones. Figure 7 is a plot of growing season total precipitation
for 1885–2016 for the six soil zones. The trends of GDDs and FFDs for 1950–2010 are presented in
Figures 8 and 9, respectively. A summary of these climatic trends by soil zone and by Saskatchewan’s
agricultural zone is also provided in Table 4. There is an increase in GDDs and FFDs for all soil
zones except for the Orthic Gray soil zone, although there is a relatively small area of Gray soil
in the agricultural zone, and thus, much less weather station data. This longer climate time series
demonstrates the importance of a long-term perspective, which in this case, shows a consistent
warming trend but also natural decadal scale cycles.PETmean −0.65 −0.46 −0.17 −0.10 −0.03 −0.05 −0.16
PETmax −5.28 −4.07 −2.07 −1.33 −0.68 −0.75 −1.77
PETmin −0.10 0.04 0.07 0.04 0.01 −0.01 0.02
* Tmean = mean temperature (°C); Tmax = mean maximum temperature (°C); Tmin = mean minimum
temperature (°C); Total P = total precipitation (mm); PETmean = mean PET (mm); PETmax = mean
maximum
Land 2019, 8, 49 PET (mm); PETmin= mean minimum PET (mm). ** Growing degree days (GDDs) and frost-
12 of 23
free days (FFDs) were calculated for 1950–2010.
Land 2019, 8, x FOR PEER REVIEW 12 of 23
Figure 5. Growing season (May–August) minimum temperature (◦ C) (1885–2016) for all soil zones.
Figure 5. Growing season (May–August) minimum temperature (°C) (1885–2016) for all soil zones.
Figure 6. Growing season (May–August) maximum temperature (◦ C) (1885–2016) for all soil zones.
Figure 6. Growing season (May–August) maximum temperature (°C) (1885–2016) for all soil zones.Land 2019, 8, 49 13 of 23
Figure 6. Growing season (May–August) maximum temperature (°C) (1885–2016) for all soil zones.
Land 2019, 8, x FOR PEER REVIEW 13 of 23
Figure 7. Growing season (May–August) total precipitation (mm) (1885–2016) for all soil zones.
Figure 7. Growing season (May–August) total precipitation (mm) (1885–2016) for all soil zones.
Figure 8. Growing degree days (GDDs) trend (1950–2010) for all soil zones.
Figure 8. Growing degree days (GDDs) trend (1950–2010) for all soil zones.Land 2019, 8, 49 14 of 23
Figure 8. Growing degree days (GDDs) trend (1950–2010) for all soil zones.
Figure 9. Frost free days (FFDs) trend (1950–2010) for all soil zones.
Figure 9. Frost free days (FFDs) trend (1950–2010) for all soil zones.
3.2. Wheat Yield
3.2. Wheat Yield
Figure 10 shows the average wheat yield predicted by the regression equations by RM for
Figure 10
1979–2016. shows
Figure 11the
is aaverage
map ofwheat yield predicted
the percent bybetween
difference the regression equations
average measured by and
RM predicted
for 1979–
2016.
wheatFigure 11 is
yield for a map of These
1979–2016. the percent difference
differences, whichbetween
rangedaverage −6% and and
betweenmeasured predicted
5%, were wheat
categorized
yield for 1979–2016.
as minimal These (less
underestimates differences,
than or equal −1%), between
whichtoranged −6% and 5%, (greater
minimal overestimates were categorized as
than or equal
to 1%), and negligible differences (between −1% and 1%). Figures 12–17 are time series of average and
minimal underestimates (less than or equal to −1%), minimal overestimates (greater than or equal to
1%), and negligible
predicted wheat yield differences (between
(1979–2016) −1% and
for specific RMs.1%). Figures
They 12–17 are
are further time
valid series ofthat
indication average andis
climate
a major determinant of wheat yield. Increases not explained by climate are likely due to improved
farming practices. In Figure 12 through Figure 17, there tends to be an overestimate of yield during
drought years (i.e., 1984–1985). Linear regression overestimates yield in dry years due to the nonlinear
response of yield to precipitation below a certain level, which in some instances can result in crop
failure, that is, zero yield.
Summer precipitation, followed by spring precipitation and maximum summer temperature,
has had the strongest influence on wheat yield across Saskatchewan’s arable agricultural zone for
1979–2016. Table 3 gives the regression equations and summary statistics. For each example provided,
the model predictors are characteristic of the soil zones and follow a southwest to northeast gradient.
For the Dry Brown soil zone, crop yield was heavily influenced by spring and summer precipitation.
In the Moist Brown soil zone, crop yields were also predicted by spring and summer precipitation,
but also summer temperature. In the Dark Brown soil zone, maximum summer temperature had a
negative effect on crop yield. The main climatic controls on wheat yield in the Black soil zone were
summer and maximum summer temperature. Minimum and maximum spring temperatures also
influenced wheat yield in several RMs within the Black soil zone. For the Orthic and Dark Gray soil
zones, the main controlling climatic variables on wheat yield included maximum summer temperature
and summer precipitation.Land 2019,
Land 8, x49FOR PEER REVIEW
2019, 8, 1515ofof 23
23
Figure 10. Predicted wheat yield (t/ha) by rural municipality (RM) (1979–2016).
Figure 10. Predicted wheat yield (t/ha) by rural municipality (RM) (1979–2016).Land 2019,8,8,49
Land2019, x FOR PEER REVIEW 16
16 of
of23
23
Figure 11. Percent difference between average and predicted wheat yield by rural municipality (RM)
Figure 11. Percent difference between average and predicted wheat yield by rural municipality (RM)
(1979–2016).
(1979–2016).Land 2019, 8, x FOR PEER REVIEW 17 of 23
Land 2019, 8, 49 17 of 23
Land 2019, 8, x FOR PEER REVIEW 17 of 23
Figure 12. Average vs. predicted wheat yield for rural municipality # 17 (1979–2016) (Dry Brown soil
zone). 12. Average vs. predicted wheat yield for rural municipality # 17 (1979–2016) (Dry Brown
Figure
Figure 12. Average vs. predicted wheat yield for rural municipality # 17 (1979–2016) (Dry Brown soil
soil zone).
zone).
Figure 13. Average vs. predicted yield for rural municipality # 46 (1979–2016) (Moist Brown soil zone).
Figure 13. Average vs. predicted yield for rural municipality # 46 (1979–2016) (Moist Brown soil zone).
Figure 13. Average vs. predicted yield for rural municipality # 46 (1979–2016) (Moist Brown soil zone).Land 2019, 8, x FOR PEER REVIEW 18 of 23
Land 2019, 8, 49 18 of 23
Land 2019, 8, x FOR PEER REVIEW 18 of 23
Figure 14. Average vs. predicted yield for rural municipality # 100 (1979–2016) (Dark Brown soil
zone).
Figure 14. Average vs. predicted yield for rural municipality # 100 (1979–2016) (Dark Brown soil zone).
Figure 14. Average vs. predicted yield for rural municipality # 100 (1979–2016) (Dark Brown soil
zone).
Figure 15. Average vs. predicted yield for rural municipality # 469 (1979–2016) (Black soil zone).
Figure 15. Average vs. predicted yield for rural municipality # 469 (1979–2016) (Black soil zone).
Figure 15. Average vs. predicted yield for rural municipality # 469 (1979–2016) (Black soil zone).Land 2019, 8, x FOR PEER REVIEW 19 of 23
Land 2019, 8, 49 19 of 23
Land 2019, 8, x FOR PEER REVIEW 19 of 23
Figure 16. Average vs. predicted yield for rural municipality # 499 (1979–2016) (Orthic Gray soil zone).
Figure 16. Average vs. predicted yield for rural municipality # 499 (1979–2016) (Orthic Gray soil zone).
Figure 16. Average vs. predicted yield for rural municipality # 499 (1979–2016) (Orthic Gray soil zone).
Figure 17. Average vs. predicted yield for rural municipality # 501 (1979–2016) (Dark Gray soil zone).
Figure 17. Average vs. predicted yield for rural municipality # 501 (1979–2016) (Dark Gray soil
3.3. Climate Projections
Figure zone).
17. Average vs. predicted yield for rural municipality # 501 (1979–2016) (Dark Gray soil
zone).
Figures 18 and 19 are scatterplots of projected changes from trends in growing season
(May–August) precipitation and maximum and minimum temperatures between 2021 and 2100,
simulated by the seven NA-CORDEX RCMs. First, we calculated the linear trends for tasmin, tasmax,
and pr, and then we computed the difference between the trend values for 2100 and 2021 to estimate
the potential range of changes. Total precipitation could potentially increase by 10%, while minimum
and maximum temperature could potentially increase by approximately 5.1 ◦ C and 4.9 ◦ C, respectively.Land 2019, 8, 49 20 of 23
These changes in mean values will be advantageous, although any increases in crop productivity could
beLand 2019,by
offset 8, xthe
FOR PEER REVIEW
impacts 20 the
of extreme weather events, which are not considered for the assessing of of 23
Land 2019, 8, x FOR PEER REVIEW
value of arable agricultural land. 20 of 23
Figure 18. Projected changes from trends in growing season (May–August) minimum temperature
Figure 18. Projected changes from trends in growing season (May–August) minimum temperature
and total
Figure 18.precipitation (each colored
Projected changes circle represents
from trends in growingaseason
different RCM, and theminimum
(May–August) dashed lines represent
temperature
and total precipitation (each colored circle represents a different RCM, and the dashed lines represent
average climatic changes).
and total precipitation (each colored circle represents a different RCM, and the dashed lines represent
average climatic changes).
average climatic changes).
Figure 19. Projected changes from trends in growing season (May–August) maximum temperature
Figure 19. Projected changes from trends in growing season (May–August) maximum temperature
and total precipitation (each colored circle represents a different RCM, and the dashed lines represent
and total
Figure 19.precipitation (each colored
Projected changes circle in
from trends represents
growingaseason
different RCM, and themaximum
(May–August) dashed lines represent
temperature
average climatic changes).
average
and totalclimatic changes).
precipitation (each colored circle represents a different RCM, and the dashed lines represent
average climatic changes).
4. Discussion
4. Discussion
This study established the geographic patterns and trends in climate and wheat yield over an
extensive area, Saskatchewan’s
This study established the arable agricultural
geographic patternsland,
andand for ainlarge
trends number
climate and of weather
wheat yieldvariables,
over an
includingarea,
extensive the length of GDDs and
Saskatchewan’s FFDs,
arable annual and
agricultural seasonal
land, and foraverages of maximum
a large number and minimum
of weather variables,
temperatures,
including and total
the length precipitation
of GDDs and FFDs, for 1979–2016.
annual The averages
and seasonal results revealed that and
of maximum hydroclimatic
minimumLand 2019, 8, 49 21 of 23
4. Discussion
This study established the geographic patterns and trends in climate and wheat yield over an
extensive area, Saskatchewan’s arable agricultural land, and for a large number of weather variables,
including the length of GDDs and FFDs, annual and seasonal averages of maximum and minimum
temperatures, and total precipitation for 1979–2016. The results revealed that hydroclimatic variability
across Saskatchewan’s arable agricultural landscape is strongly correlated with wheat yield in all soil
zones, with climate variables sharing up to 75% of the annual variance in wheat yield. Historical
climate trends (1885–2016) show an increase in growing season minimum temperature and decrease in
maximum temperature throughout all soil zones, and large precipitation variability, although with a
recent increasing trend. These full weather records provide a better understanding of where the shorter
record (1979–2016) falls in terms of long-term trends, natural climatic variability, and decadal cycles.
Analysis of the interpolated data revealed that the strongest trends were for minimum winter
temperatures. However, regression analysis of interpolated weather and wheat yield data for 1979–2016
and 296 RMs throughout six soil zones indicated that summer precipitation, followed by spring
precipitation and maximum summer temperature, have had the strongest influence on wheat yield
across Saskatchewan’s arable agricultural zone for the last 38 years. Each unique regression equation
for the RMs did a fairly good job at predicting the annual wheat yield, as the differences between
average and predicted yield were negligible and only minimally overestimated or underestimated.
The linear models minimally overestimated yield during some drought years, due to the nonlinear
relationship of precipitation and yield, whereby very low precipitation can result in crop failure
(i.e., zero yield).
Our investigation of regional climate change also included RCM projections (2021–2100) of
increasing maximum and minimum temperatures and total precipitation. These projected climate
changes suggest the potential for higher crop productivity as predicted by crop modeling studies [7,8],
although neither our study nor most of the crop modeling research account for the changes in the
severity of extreme weather on crop yield.
5. Conclusions
The objective of our study was to consider whether the provincial agency responsible for assessing
the value of agricultural land should adjust the climate rating in their arable land assessment model.
We examined recent climate changes and the statistical relationship between weather variables
and wheat yield, in contrast to research on the numerical simulation and prediction of crop yields.
Because climate and wheat yield are changing more or less consistently throughout all soil zones
within Saskatchewan’s arable agricultural landscape, modifying the climate factor ratings in one area
compared to another is not warranted at this time. The strongest historical climate trends are for
minimum winter temperature, but according to the correlation and regression analyses, this weather
variable did not influence wheat yield significantly for 1979–2016 (p > 0.05). Hence, there is no evidence
that crop yields are benefiting from a warmer winter. According to the climate and wheat yield
data for 38 years, there is no evidence of significant increases in growing season precipitation and
temperature, and thus, the current climate ratings in place are reasonable. However, with further
warming of the climate of Saskatchewan, modifications to the climate rating in the land assessment
model could be considered for the revaluation due in 2025. Due to a high degree of uncertainty in
the projections of temperature and highly variable precipitation [33], we cannot speculate as to when
the change in these variables will result in a change in crop yields that necessitates a change in the
land assessment climate factor rating. However, based on the recent and projected climate changes
documented within this paper, at some point a modification in the climate factor rating will be justified,
and thus, we suggest that there should be periodic re-evaluation of the climate factor rating. Future
analyses should consider the impacts of extreme weather on crop yield, as research suggests that a
warming climate is amplifying the severity of extreme weather events (i.e., droughts, floods, and heat
waves [34]). Any future analyses at high spatial and temporal resolution (i.e., daily and 10 km) mayLand 2019, 8, 49 22 of 23
also consider bias correction of the weather data to determine to what extent interpolation methods
can smooth climate extremes (i.e., minimum and maximum temperature, and precipitation) [27].
Author Contributions: Conceptualization, S.A.K. and D.J.S.; methodology, S.A.K.; data curation, S.A.K. and Y.A.;
formal analysis, S.K.; investigation, S.A.K.; writing—original draft preparation, S.K.; writing—review and editing,
D.J.S.; visualization, S.K. and Y.A.; supervision, D.J.S.; funding acquisition, D.J.S.
Funding: This research was funded by MITACS Accelerate, Information Systems Management (ISM) Canada,
and the Saskatchewan Assessment Management Agency (SAMA).
Acknowledgments: Weather station data were provided by ISM Canada, and the Saskatchewan Crop Insurance
Corporation (SCIC) provided wheat yield data. We thank Steve Suchan, Shaun Cooney, Kim Hardy, Naiomi Lynn,
Travis Juffinger, and Joe Lovick for their guidance and advice. We thank Sheena Hatcher for assistance with data
preparation, and the three anonymous reviewers for their helpful comments and suggestions.
Conflicts of Interest: The authors declare no conflict of interest. The authors acknowledge that the funders had a
role in the design of the study and provided data for the analysis.
References
1. Statistics Canada. Total Area of Farms and Use of Farm Land, Historical Data. 2016. Available
online: https://www150.statcan.gc.ca/t1/tbl1/en/tv.action?pid=3210015301&pickMembers%5B0%5D=1.
9&pickMembers%5B1%5D=3.2 (accessed on 15 January 2019).
2. Saskatchewan Trade & Export Partnership. State of Trade Report. 2017. Available
online: https://www.sasktrade.com/public/uploads/Exporter%20Resources/Saskatchewan%20State%
20of%20Trade%202017.pdf (accessed on 15 January 2019).
3. Wheaton, E.; Kulshreshtha, S. Agriculture. In The New Normal: The Canadian Prairies in a Changing Climate;
Sauchyn, D.J., Diaz, H., Kulshreshtha, S., Eds.; CPRC Press: Regina, SK, Canada, 2010; Chapter 7.
4. Bradshaw, B.; Dolan, H.; Smit, B. Farm-Level Adaptation to Climatic Variability and Change: Crop
Diversification in the Canadian Prairies. Clim. Chang. 2004, 67, 119–141. [CrossRef]
5. Campbell, I.D.; Durant, D.G.; Hunter, K.L.; Hyatt, K.D. Food Production. In Canada in a Changing Climate:
Sector Perspectives on Impacts and Adaptation; Warren, F.J., Lemmen, D.S., Eds.; Government of Canada:
Ottawa, ON, Canada, 2014; pp. 99–134.
6. Chipanshi, A.; Zhang, Y.; Kouadio, L.; Newlands, N.; Davidson, A.; Hill, H.; Warren, R.; Qian, B.;
Daneshfar, B.; Bedard, F.; et al. Evaluation of the Integrated Canadian Crop Yield Forecaster (ICCYF)
model for in-season prediction of crop yield across the Canadian agricultural landscape. Agric. For. Meteorol.
2015, 206, 137–150. [CrossRef]
7. Poudel, S. Economic Impacts of Climate Change and Weather Extremes on Canadian Prairie Mixed Farms.
Ph.D. Thesis, Department of Bio-Resource Policy, University of Saskatchewan, Saskatoon, SK, Canada,
January 2016.
8. Qian, B.; Gameda, S.; Zhang, X.; De Jong, R. Changing growing season observed in Canada. Clim. Chang.
2012, 112, 339–353. [CrossRef]
9. Bonsal, B.; Cuell, C.; Wheaton, E.; Sauchyn, D.; Barrow, E. An assessment of historical and projected future
hydro-climatic variability and extremes over southern watersheds in the Canadian Prairies. Int. J. Climatol.
2017, 37, 3934–3948. [CrossRef]
10. Wheaton, E.; Sauchyn, D.; Bonsal, B. Future Possible Droughts. In Vulnerability and Adaptation to Drought:
The Canadian Prairies and South America; Diaz, H., Hurlbert, M., Warren, J., Eds.; University of Calgary Press:
Calgary, AB, Canada, 2016; Chapter 3; 387p.
11. Herrington, R.; Johnson, B.; Hunter, F. Responding to Global Climate Change in the Prairies. In Canada
Country Study: Climate Impacts and Adaptations; Environment Canada: Ottawa, ON, Canada, 1997; Volume 3,
270p.
12. Kharin, V.V.; Zwiers, F.W.; Zhang, X.; Hegerl, G.C. Changes in Temperature and Precipitation Extremes in
the IPCC ensemble of Global Couple Model Simulations. J. Clim. 2007, 20, 1419–1444. [CrossRef]
13. Weber, M.; Hauer, G. A Regional Analysis of Climate Change Impacts on Canadian Agriculture.
Can. Public Pol. 2003, 29, 163–180. [CrossRef]
14. Qian, B.; De Jong, R.; Warren, R.; Chipanshi, A.; Hill, H. Statistical spring wheat yield forecasting for the
Canadian Prairie Provinces. Agric. For. Meteorol. 2009, 149, 1022–1031. [CrossRef]Land 2019, 8, 49 23 of 23
15. Saskatchewan Assessment Management Agency (SAMA). Methods of Assessment. 2018. Available online:
https://www.sama.sk.ca/property-owner-services/understanding-assessment/methods-assessment
(accessed on 20 December 2018).
16. Sauchyn, D. Prairie Climate Trends and Variability. In The New Normal: The Canadian Prairies in a Changing
Climate; Sauchyn, D.J., Diaz, H., Kulshreshtha, S., Eds.; CPRC Press: Regina, SK, Canada, 2010; Chapter 3.
17. Sauchyn, D.J.; Xongchao, Y. Evaluation of the Climatic Factor in Rural Land Assessment; Final Report to the
Saskatchewan Assessment and Management Agency; Report; University of Regina: Saskatchewan, SK,
Canada, 1990; p. 91.
18. Lobel, D.B.; Schlenker, W.; Costa-Roberts, J. Climate trends and global crop production since 1980. Science
2011, 333, 616–620. [CrossRef]
19. Kutcher, H.R.; Warland, J.S.; Brandt, S.A. Temperature and precipitation effects on canola yields in
Saskatchewan, Canada. Agric. For. Meteorol. 2010, 150, 160–165. [CrossRef]
20. Lobell, D.B.; Burke, M.B. On the use of statistical models to predict crop yield responses to climate change.
Agric. For. Meteorol. 2010, 150, 1443–1452. [CrossRef]
21. Mkhabela, M.S.; Bullock, P.; Raj, S.; Wang, S.; Yang, Y. Crop yield forecasting on the Canadian Prairies using
MODIS NDVI data. Agric. For. Meteorol. 2011, 151, 385–393. [CrossRef]
22. He, Y.; Wei, Y.; DePauw, R.; Qian, B.; Lemke, R.; Singh, A.; Cuthbert, R.; McConkey, B.; Wang, H. Spring
wheat yield in the semiarid Canadian prairies: Effects of precipitation timing and soil texture over recent
30 years. Field Crop Res. 2013, 149, 329–337. [CrossRef]
23. Robertson, S.M.; Jeffrey, S.R.; Unterschultz, J.R.; Boxall, P.C. Estimating yield response to temperature and
identifying critical temperatures for annual crops in the Canadian prairie region. Can. J. Plant Sci. 2013, 93,
1237–1247. [CrossRef]
24. Meng, T.; Carew, R.; Florkowski, W.J.; Klepacka, A.M. Analyzing Temperature and Precipitation Influences
on Yield Distributions of Canola and Spring Wheat in Saskatchewan. Bull. Am. Meteorol. 2017, 56, 897–913.
[CrossRef]
25. Adjusted and Homogenized Canadian Climate Data (AHCCD). 2017. Available online: http://ec.gc.ca/
dccha-ahccd/default.asp?lang=En&n=B1F8423 (accessed on 5 November 2018).
26. McKenney, D.W.; Hutchinson, M.F.; Papadopol, P.; Lawrence, K.; Pedlar, J.; Campbell, K.; Milewska, W.;
Hopkinson, R.F.; Price, D.; Owen, T. Customized spatial climate models for North America. Bull. Am. Meteorol.
2011, 92, 1611–1622. [CrossRef]
27. Newlands, N.K.; Davidson, A.; Howard, A.; Hill, H. Validation and inter-comparison of three methodologies
for interpolating daily precipitation and temperature across Canada. Environmetrics 2011, 22, 205–223.
[CrossRef]
28. Quiring, S.M.; Papakryiakou, T.N. An evaluation of agricultural drought indices for the Canadian Prairies.
Agric. For. Meteorol. 2003, 118, 49–62. [CrossRef]
29. Campbell, C.A.; Selles, F.; Zentner, R.P.; McConkey, B.G.; Brandt, S.A.; McKenzie, R.C. Regression model for
predicting yield of hard red spring wheat grown on stubble in the semiarid prairie. Can. J. Plant Sci. 1997, 77,
43–52. [CrossRef]
30. Von Storch, H.; Zwiers, F.W. Statistical Analysis in Climate Research; Cambridge University Press: Cambridge,
UK, 1999; 484p.
31. Burn, D.H.; Hesch, N.M. A Comparison of Trends in Potential and Pan Evaporation for the Canadian Prairies.
Can. Water Resour. J. 2006, 31, 173–184. [CrossRef]
32. Gameda, S.; Qian, B.; Campbell, C.A.; Desjardins, R.L. Climatic trends associated with summer fallow in the
Canadian Prairies. Agric. For. Meteorol. 2007, 142, 170–185. [CrossRef]
33. Barrow, E.; Sauchyn, D. Uncertainty in climate projections and time of emergence of climate signals in
western Canada. Int. J. Climatol. in press.
34. Intergovernmental Panel on Climate Change (IPCC). Climate Change 2013: The Physical Science Basis.
Contribution of Working Group I to the Fifth Assessment Report of the Intergovernmental Panel on Climate
Change. 2013. Available online: https://www.ipcc.ch/report/ar5/wg1/ (accessed on 15 November 2018).
© 2019 by the authors. Licensee MDPI, Basel, Switzerland. This article is an open access
article distributed under the terms and conditions of the Creative Commons Attribution
(CC BY) license (http://creativecommons.org/licenses/by/4.0/).You can also read