CLIMATE CHANGE AND ITS IMPACTS ON FORESTS OF SIKKIM - ENVIS ...
←
→
Page content transcription
If your browser does not render page correctly, please read the page content below
CLIMATE CHANGE AND ITS IMPACTS ON FORESTS OF SIKKIM
N.H.Ravindranath, Nitasha Sharma, Anitha Sagadevan, Mathangi Jayaraman, Madhushree Munsi
ABSTRACT
C
limate change is one of the major environmental threats facing the world. Studies have shown that
Indian sub-continent is likely to experience a warming of over 3-5°C, increased flood and drought
frequency and intensity. Forests provide a wide range of ecosystem services. However, climate is one
of the most important determinants of vegetation patterns globally and thus climate change can significantly
alter the distribution, structure and ecology of forests. Forest type distribution, carbon stocks or emissions
and climate change are interlinked processes. Deforestation and land degradation contributes to about 20% of
global CO2 emissions and forest sector provides a large opportunity to mitigate climate change, particularly
through the REDD+ (Reducing Emissions from Deforestation and Degradation) mechanism. This chapter
presents an assessment of climate variability and climate change impacts on forest ecosystems of Sikkim
using dynamic global vegetation modeling. Climatic variables like precipitation and temperature were taken
into consideration to understand the past and current trends. The drought and flood data were also assessed
to understand the recent trends. The study shows that the forest sector in Sikkim is unlikely to be adversely
impacted by climate change in the short- and medium-term. But keeping in mind the various model limitations,
there is a need for multiple climate scenarios and vegetation model-based assessment of climate change impacts
at decentralized levels. Critical evaluation of the current national as well as state policies, programmes and
capacity of institutions are required that will help in increasing resilience of forests.
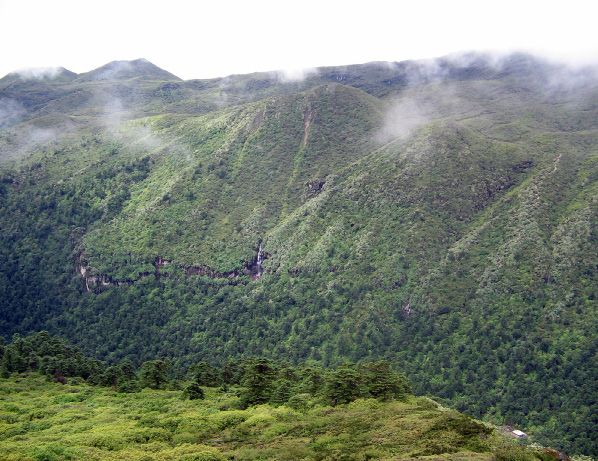
Over the last decade, the area under dense forests is increasing in Sikkim
125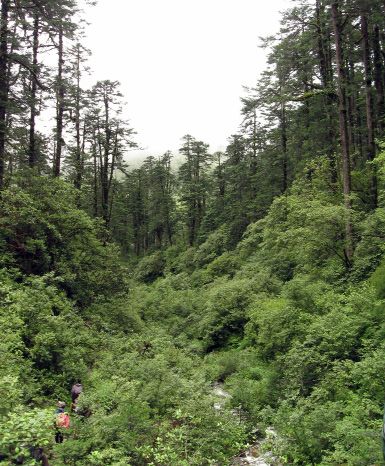
Multi-layered forests of the Sikkim Himalaya are a part of the global biodiversity hotspot

                                          126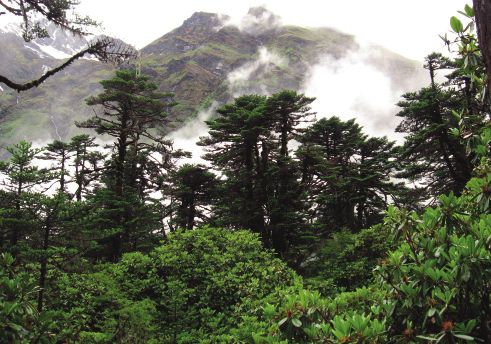
C
        limate change is one of the biggest environmental threats facing the world, potentially impacting
        food production and security, sustained water supply, biodiversity of forests and other natural
        ecosystems, fisheries, health and settlements. Climate change modeling studies for India show that the
Indian sub continent is likely to experience a warming of over 3-5°C, increased flood and drought frequency
and intensity.

Forests provide a wide range of ecosystem services such as protecting water quality and quantity (including
stream flow, drinking water supplies, and groundwater) by retarding runoff, protecting biodiversity, sequestering
carbon; providing wood and other non-timber forest products (NTFPs) and providing an aesthetic element in
the landscape that has both important economic and spiritual values (Heal 2000). Although these ecosystem
services are generally defined as “the life-support and life-enhancing services of natural ecosystems”, human
activities are already impairing the flow of these ecosystem services from the forests on a large scale and if
these current trends continue with climate change posing to be an added stressor, a large share of the Earth’s
remaining natural forest ecosystems will be altered within a few decades.

Climate is one of the most important determinants of vegetation patterns globally and has significant
influence on the distribution, structure and ecology of forests. It is therefore logical to assume that changes in
climate would alter the configuration of forest ecosystems. Forest sector is also important in the context of
climate change due to three reasons namely; i) deforestation and land degradation contributes to about 20%
of global CO2 emissions, ii) forest sector provides a large opportunity to mitigate climate change, particularly
the REDD (Reducing Emissions from Deforestation and Degradation) mechanism, and iii) forest ecosystems
are projected to be adversely impacted by climate change, affecting biodiversity, biomass growth and forest
regeneration.

Based on a range of vegetation modeling studies, IPCC (2007) concluded that a-third of biodiversity is under
the threat of extinction and further, significant impacts of climate change are projected on forest biodiversity
and regeneration, especially in tropics and mountain areas. A number of studies have been carried out in the
past to evaluate impacts and vulnerability towards climate change on a national and global level. But there
are very few studies at the regional level. Studies at Indian Institute of Science (IISc) concluded that under
the climate projections for the year 2085, 77% and 68% of the forested grids in India are likely to experience
shift in forest types under A2 and B2 scenarios, respectively. A recent study from IISc using a dynamic global
vegetation model showed that at the national level, about 45% of the forested grids are projected to undergo
change by 2030s under A1B climate change scenario.

Sikkim, located in the Eastern Himalayas has a geographic area of 7096 sq. km with the entire state comprising
hilly terrain with forests on hilltops and valleys. 82% of the total geographical area of the state is under the
administrative control of the Forest Department and forestry is the major land use in the state. Although one-
third of Sikkim consists of perpetually snow-covered mountains, forest is an important resource in Sikkim
with a predominantly large population living in close association with forests and dependent on it. Terrace
cultivation is practiced by the people. The state occupies a significant place in terms of floral and faunal
biodiversity, being identified as one of the global biodiversity hotspots in the Eastern Himalayas.

In this chapter, we present an assessment of climate variability and climate change impacts on forest ecosystems
of Sikkim using dynamic modeling.

                                                      127
The mosaic of various forest types with high levels of variability makes their quantification
                                        using standard techniques very difficult

STATUS OF FORESTS IN SIKKIM

Sikkim has a recorded forest area of 5,841 sq km which is 82.31% of its geographical area. The total forest
and tree cover of the state is 3,377 sq km, which is 47.59 % of the geographical area (FSI 2009). The protected
areas constitute 30.70% of the geographical area of the state. The Sikkim Himalayas falls under the Himalayan
(2) Bio –geographic Zones and Central Himalaya (2C) Biotic Province having about 9 forests types (Champion
& Seth). However, as per FSI reports, forests in the state can be categorized into 6 types as Tropical Moist
Deciduous, Sub Tropical Broad-leaved Hill, Montane Wet Temperate, Himalayan Moist Temperate, Sub Alpine
Forests and Moist alpine Scrub. The carbon sequestration of forests of Sikkim is very significant in India. The
distribution of forests along with crown densities in Sikkim is given in Figure 1a. Moderate dense forests
account for about 30.45% of the forest area followed by very dense forests accounting for about 7.05%. Forests
are classified as Reserved Forests (93.34%) and Protected Forests (6.66%). Sikkim Himalayas has more than
26% of flowering plants of the country and is very important phyto-geographical reserve of the country. Sal,
Bamboos and orchids are commonly found in the subtropical forests of Sikkim upto a height of 1520m. In
the temperate region above 1520m and up to 3960m, Oak, Laurel, Chestnut, Rhododendron, Fir, Maple and
Spruce are predominantly found and alpine tundra at the higher elevations. More than 4000 species of plants
– Magnolias, Rhododendrons, blue poppies, Gentians and Primulas are found in Sikkim. The rich biodiversity
of the state also renders it a huge potential for developing eco-tourism.

                                                           128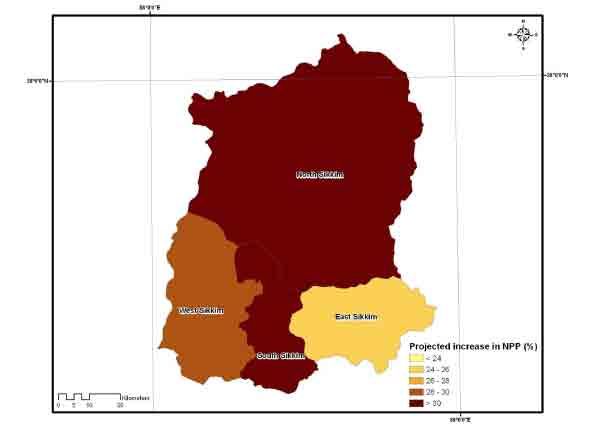
Trends in area under forests are given in Table 1. According to Forest Survey of India, the area under dense
forests seems to have marginally declined during the period 2001 to 2003 and then again increased from 2003
onwards. The area under scrub vegetation also increases from 2001 onwards but it is observed to decrease from
2005 onwards. Table 2 and 3 show the trends in forest cover at district level.

                 Table 1: Trends in area under different types of forest in Sikkim (sq. km.)

                    Figure 1: Sikkim Forest Cover Map (1a to the left) and Forest types of Sikkim
                                               (1b – to the right) (FSI 2009)

                               Table 1: Forest cover (sq km) as per FSI Assessments

 Forest type      2001 assessment                2003 assessment                2005 assessment         2007 assessment

 Dense forest                           2391                         2362                        2410                    2661

 Open forest                             802                           900                        852                     696

 Scrub forest                            341                           360                        363                     356

 Total                                  3534                         3622                        3625                    3713

                          Table 2: Trends in forest cover at district-level (sq. km.)

 State             Districts                         Total forest                 Total forest               Change

                                                         2005                        2007                  2005 - 2007

 Sikkim            East Sikkim                                       679                         699                       20

                   North Sikkim                                     1326                     1315                         -11

                   South Sikkim                                      529                         571                       42

                   West Sikkim                                       728                         772                       44

                                                           129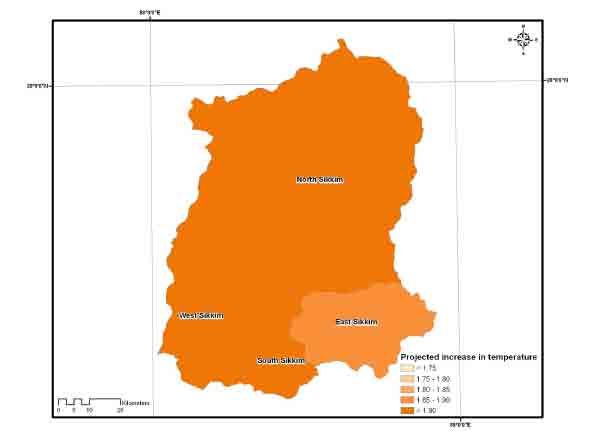
Table 3: Trends in forest cover at district-level (sq. km.)

 State       Districts            Forest cover in 2005         Forest cover in 2007        Change (2005 - 2007)

                               VDF      MDF      OF         VDF        MDF     OF       VDF        MDF     OF

 Sikkim      East Sikkim          162      396        121      162       411      126         0       15           5

             North Sikkim         132      755        439      135       890      290         3      135        -149

             South Sikkim          95      311        123         93     371      107         -2      60          -16

             West Sikkim          109      450        169       110      489      173         1       39           4

           VDF - Very Dense Forest,           MDF - Medium Dense Forest,              OF - Open Forest

CURRENT AND FUTURE CLIMATE VARIABILITY OF SIKKIM

The starting point for an investigation of adaptation to future climate change is to develop an understanding
on the adaptation to current climate variability. This means that the focus for the investigation of adaptation to
climate change should not be based only on scenarios of the future but also on the analysis of present vulnerability
in the face of current climate variability. Rainfall and Temperature are subjected to variability on all time
scales: intra-seasonal, inter-annual, decadal, centennial, etc. Food production system, water availability, water
resources etc. are sensitive to intra-seasonal, inter-annual, decadal variability in these two important climate
variables. Global warming and Climate Change is projected to increase the number of extreme temperature
and rainfall events, and hence climate variability is expected to show an upward trend. It is very important to
understand the past trends and variability in rainfall, minimum and maximum temperature in Sikkim since the
knowledge on the past could provide guidance for the future.

‘Climate variability’ refers to variations in the mean state (of temperature, monthly rainfall, etc.) and other
statistics (such as standard deviations, statistics of extremes, etc.) of the climate on all temporal and spatial
scales beyond that of individual weather events. Variability may be due to natural internal processes within
the climate system (internal variability) or due to natural variations (e.g. solar and volcanic) or due to external
forcing (external variability). Anthropogenic climate change, on the other hand, is a change in climate which
is attributed directly or indirectly to human activity that alters the composition of the global atmosphere (e.g.
increase in greenhouse gases due to fossil fuel emissions) or surface characteristics (e.g. deforestation) and
which is in addition to natural climate variability observed over comparable time periods (United Nations
Framework Convention on Climate Change 1992). In this section, we focus on the current mean climate
and climate variability in Sikkim at district level. Precipitation and temperature are used as the key climate
variables in this analysis.

RAINFALL AND TEMPERATURE VARIABILITY

Information on spatial and temporal variations of rainfall is important in understanding the hydrological
balance on a global/regional scale. The distribution of precipitation is also important for water management
in agriculture, power generation and drought-monitoring. In India, rainfall received during the southwest
monsoon season (June–September) is crucial for its economy. Real-time monitoring of rainfall distribution
on a daily basis is required to evaluate the progress and status of monsoon and to initiate necessary action to
control drought/flood situations.

Coefficient of Variation (C.V.) is defined as the inter-annual variability (estimated as the standard deviation)
of rainfall over the region as a fraction of mean. Higher values of C.V. indicate larger inter-annual variability

                                                         130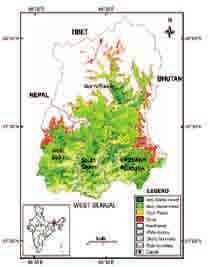
and vice versa. The Standard deviations of rainfall for the districts of Sikkim are given in Table 4. Minimum
and maximum temperature trends (°C per 100 yr) of southwest monsoon season (June-September) for Sikkim
are also shown (Table 4)

Table 4: Mean, Standard Deviation, Coefficient of Variation (C.V.), Precipitation Trend, Minimum and
Maximum Temperature Trend of southwest monsoon season (June-September) rainfall computed using the
data for the period 1901-2007 for Sikkim

      District          Mean        Standard      Coefficient    Precipitation     Minimum           Maximum
                      (mm/day)      Deviation         of         Trend (mm/       Temperature       Temperature
                                    (mm/day)      Variation       day/100yr)         Trend             Trend
                                                     (%)                           (oC/100yr)        (oC/100yr)

 East Sikkim,
 North Sikkim,
                         17.82         3.55           20            -2.627             2.86              0.73
 South Sikkim,
 West Sikkim

** Data Source: 1° x 1° lat. and long. daily gridded rainfall dataset provided by Indian Meteorological
Department (IMD) for the Northeast Indian region for a period of 107 years (1901–2007) for precipitation, and
37 years (1969-2005) for temperature.

3.2. Drought and flood analysis

Drought is a normal, recurrent feature of climate and is observed in all the climatic zones. However, it has
significantly different characteristics from one region to another. Drought over a geographic area is a temporary
condition caused by significantly less (deficient) rainfall for an extended period of time, usually during a
season when substantial rainfall is expected over the area. The severity of the drought can also be aggravated
by other climatic factors such as high temperature, high wind and low humidity.

The studies on droughts in India have used rainfall during the monsoon season (June to September) which
contributes about 75-90% of the total annual rainfall over most parts of the country. Gore et al. (2010) examined
spatial variation of drought probability over India. In this chapter, only meteorological droughts and floods have
been analyzed. The Standard Precipitation Index (SPI) is an index developed by McKee et al. (1993) based on
the probability of rainfall for the time scale of interest and is relatively less complex to compute. The time scale
reflects the impact of drought on the availability of different water resources. Soil moisture conditions respond
to rainfall anomalies on a relatively short time scale. Groundwater, stream flow, and reservoir storage reflect
the longer-term rainfall anomalies.

For the calculation of SPI for any location, long time series (at least 30 years) of rainfall for the desired period
(monsoon season for this study) is used. This long time series of rainfall is fitted to a probability distribution,
which is then transformed into a standardized normal distribution so that the mean SPI for the location and
desired period is zero. Positive SPI values indicate greater than median rainfall and negative values indicate
less than median rainfall. The classification of the drought and flood intensities based on the SPI value is as
follows; moderately dry/ moderate drought for SPI value from -1.0 to -1.49, severely dry/ severe drought for
SPI value from -1.5 to -1.99 and extremely dry/ extreme drought for SPI value of -2 and less (Table 5).

                                                       131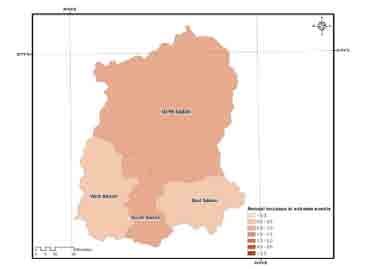
Table 5: Classification of SPI values

    SPI                 Classification                       SPI              Classification
    0 to -0.99          Near Normal                          0 to 0.99        Near Normal
    -1 to -1.49         Moderately Dry/Moderate              1 to 1.49        Moderately Wet/Moderate Flood
                        Drought
    -1.5 to -1.99       Severely Dry/Severe Drought          1.5 to 1.99      Severely Wet/Severe Flood
    ≤-2                 Extremely Dry/Extreme Drought        ≥2               Extremely Wet/ Extreme Flood

From Table 6, one can infer that the percentage of incidences of different types of drought and flood years in
Sikkim.

      Table 6: District-wise percentage of incidences (probability) of flood and drought years (1901-2007)
                     during the southwest monsoon season (June to September) for Sikkim

                          Moderate         Severe       Extreme           Moderate      Severe      Extreme
                           Drought        Drought       Drought          Flood Years     Flood       Flood
          District        Years (%)      Years (%)     Years (%)             (%)       Years (%)   Years (%)
    East Sikkim,
    North Sikkim,
                              2.8            0.93           1.87            10.28         1.87       0.93
    South Sikkim,
    West Sikkim

** Method: Standardized Precipitation Index developed by McKee et al. (1993) based on the probability of
rainfall has been used to compute the probability of droughts and floods.

3.3 Climate Change Projections

Climate change projections for any geographic region are obtained using GCMs (global circulation models)
and RCMs (regional climate models). Normally, climate change projections are made for variables such as:
•         Surface air temperature (height of 1.5m) – average, maximum and minimum
•         Precipitation (both snow and rainfall)
•         Relative humidity
•         Incoming radiation (both shortwave and longwave)
•         Wind speed (height of 1.5m)
For such climate change projections, an extensively-tested GCM is HadCM3 from the Hadley Centre, UK
(Collins et al. 2001). HadCM3 has been used recently for generating climate change projections for various
parts of the Indian subcontinent (Rupa Kumar et al. 2006). According to that study, the Indian subcontinent
could be subjected to an average of over 4° C increase in temperature by 2085 for SRES A2 scenario.

GCM and SRES scenario used: In this report, data from the HadCM3 GCM, downscaled by PRECIS
model, a regional climate model for down-scaling climate projections (see Rupa Kumar et al. 2006), is used.
The combination of HadCM3 and PRECIS models is known as the HadRM3 model. The atmospheric CO2
concentration trajectory (an important input to GCMs) was from the SRES A1B mid-term (2021-2050)
projections. Climate change projections were made:

                                                      132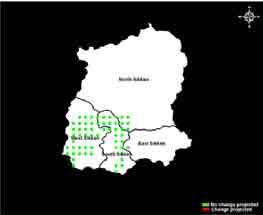
•       For daily values of temperature (average, maximum, minimum)
•       For daily values of precipitation
•       At grid-spacing of 0.44250 latitude by 0.44250 longitude
•       For periods of 2021-2050

Derivation of district-wise data: Data derived from the PRECIS model outputs (which had a grid spacing
of 0.4425° latitude by 0.4425° longitude) was regridded to 0.2° in latitude and 0.2° in longitude. This ensures
that enough grids fall inside each district. Then, the data was re-aggregated (as averages) at the district-level.
Figure 2 shows the projected increase in temperature for Sikkim. One can note that the projected temperature
increase for all the districts except East Sikkim, are on the higher side. These regions are expected to experience
a warming of about 20 C by 2050s. The same information is shown district-wise in Table 7.

                           Table 7: District-wise projected increase in temperature for
                             the period 2021-2050 (under A1B scenario) for Sikkim

        Sl No.          District                                              Increase in temperature (°C)

          1             North Sikkim, South Sikkim                            Greater than 2.0

          2             West Sikkim                                           2.0 - 1.9

          3             East Sikkim                                           1.8-1.9

** Data Source: Data from the HadCM3 GCM, downscaled by PRECIS model, a regional climate model for
downscaling climate projections is used. The atmospheric CO2 concentration trajectory (an important input to
GCMs) was from the SRES A1B mid-term (2021-2050) projections. Climate change projections are made for
daily values of precipitation and temperature.

        Figure 2: Spatial distribution of projected increase in temperature (°C) for the period 2021-2050 in Sikkim

                                                           133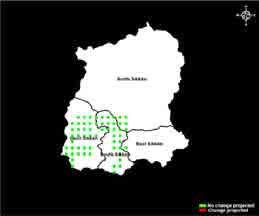
Table 8 represents the projected change in rainfall. It can also be seen that all the districts of Sikkim are
expected to show a decline in rainfall (as much as 5%).

                  Table 8: District-wise projected increase in rainfall for the period 2021-2050
                                        (under A1B scenario) for Sikkim

       District                                                              Increase in rainfall - annual (%)

       East Sikkim, North Sikkim, South Sikkim, West Sikkim                              -5.0 - 0.0

** Data derived from the PRECIS model outputs (which had a grid spacing of 0.4425° latitude by 0.4425°
longitude) was regridded to 0.2° in latitude and 0.2° in longitude. This ensures that enough grids fall inside
each district. Then, the data was re-aggregated (as averages) at the district-level.

A recent study of rainfall patterns over the Indian subcontinent (Goswami et al. 2006) found out that the
frequency of “extreme events” with respect to rainfall (that is, frequency of days with either very high or very
low rainfall) have been increasing over the past 100 years. Table 9 and Figure 3 show the district-wise change
in the number of days (in a year, on an average) when the rainfall exceeds 100 mm per day for Sikkim. The
value of “0.0-1.0” indicates that the number of days heavy rainfall days per year is expected to increase is by
1 day.

       Table 9: District-wise change in the number of days (in a year, on an average) when the rainfall
                                    exceeds 100 mm per day for Sikkim

       District                                                     Annual increase in extreme event days
       East Sikkim, North Sikkim, South Sikkim,                                      0.0 – 1.0
       West Sikkim

** A heavy rainfall day is defined as a day when the rainfall exceeds 100 mm.

            Figure 3: District wise map of projected increase in the number of days (in a year, on an average)
                                  when the rainfall exceeds 100 mm per day for Sikkim

                                                              134
IMPACT OF CLIMATE CHANGE ON FORESTS IN SIKKIM
Based on a range of vegetation modeling studies, IPCC 2007 suggests potentially severe impacts on forests
towards the end of this century and beyond, especially in tropics, boreal and mountain areas (Miles 2002,
McClean et al. 2005). The most recent report from International Union of Forest Research Organization
(Seppälä et al. 2009) paints a gloomier picture about the future of the world forests in a changed climate. It
suggests that in a warmer world, the current carbon regulating services of forests (as carbon sinks) may be
entirely lost, as land ecosystems could turn into a net source of carbon dioxide later in the century. Because of
these reasons, it is essential to conduct scientific studies on the projected impact of climate change on forests.
The method of assessment is described below:
Methods and Models: An assessment of the impact of projected climate change on forest ecosystems in
Sikkim is made using the following:
• Climate model; Regional Climate Model of the Hadley Centre (HadRM3)
• Climate change scenario; A1B scenario
• Climate impact model; The present study investigates the projected impacts of climate change on forests
using IBIS, a dynamic global vegetation model (DGVM) (Kucharik et al. 2000). It specifically assesses the
boundary shifts in vegetation types, changes in NPP and soil carbon stocks, as well as the vulnerability of
existing forests to future climate change.
• Period of assessment; short-term (2021-2050) and long-term (2071-2100) periods.
• Input data; monthly mean cloudiness (%), monthly mean precipitation rate ( mm/day), monthly mean
relative humidity (%), monthly minimum, maximum and mean temperature (C) and wind speed (m/s), soil
parameter (percentage of sand, silt and clay) and topography.
Salient steps: The salient steps of this impact assessment of climate change on forests are as follows:
1. Atmospheric CO2 emission trajectory for the future is assumed to follow SRES scenario A1B (atmospheric
CO2 concentration reaches 490 ppm by 2030-2050 period). This value (of 490 ppm) is assumed as the
average, for the entire period.
2. Climate projections for the period of 2021-2050 and 2071-2100 were derived from the outputs of HadCM3/
PRECIS models (see Rupa Kumar et al. 2006 for 2071-2100 derivations).
3. The vegetation model (IBIS) was run for both the current climate and the projected climate (derived as
described in step 2). The change in important forest characteristics (such as vegetation type, NPP, biomass
and SOC) was derived in a spatially explicit fashion.
4. District-wise data was derived from spatially explicit data of step 3. Then, the districts were ranked as
per the change projected in their forests. For example, if a district had a large percent of area undergoing
vegetation type change, it means that a shift in vegetation type (e.g., tropical deciduous to tropical
evergreen) is predicted in a large percent of the area of the district. This means that the future climate may
not be optimal to the current vegetation, in those places. In other words, this district is highly vulnerable to
climate change.
Impacts of climate change: The dynamic global vegetation model has been validated by Indian Institute of
Science for its suitability for Indian conditions. The impacts are assessed at regional climate grid scales. It can
be observed from Table 10 that during the short term period of 2030s, out of the 58 forested grids in Sikkim,
none will be impacted by climate change. The distribution of the forested grids which are projected to be
impacted by climate change are presented in Figure 4 for 2030s and Figure 5 for 2080s. Thus, the projections
135for the forest sector of Sikkim show that the biodiversity rich districts of Sikkim are not likely to be impacted
by climate change by 2030s and 2080s.
Table 10: No. of forested grids projected to be impacted by climate change during 2030s and 2080s in Sikkim
Period Number of grids affected
Total number of grids 58
Number of grids projected to be affected in 2035 0
Number of grids not affected in 2035 58
Number of grids projected to be affected in 2085 0
Number of grids not affected in 2085 58
Table 11 and Figure 6 show the district-wise projected increase in Net Primary Productivity (NPP) (%) for
the future (2021-2050) relative to current NPP for Sikkim. It can be inferred that all the districts of Sikkim are
likely to show increase in NPP for the future.
Figure 4: Forest vegetation change projected by 2035 under Figure 5: Forest vegetation change projected by 2085 under
A1B scenario in Sikkim A1B scenario in Sikkim
Table 11: District-wise projected increase in NPP (%) for the future
(2021-2050) relative to current NPP for Sikkim.
Districts Net Primary Productivity NPP (%)
East Sikkim 25.38
North Sikkim 30.65
South Sikkim 38.14
West Sikkim 28.82
** NPP is an important measure of forest health and productivity. The projected values are from IBIS, a dynamic
global vegetation model (DGVM). It specifically assesses the boundary shifts in vegetation types, changes in
NPP and soil carbon stocks, as well as the vulnerability of existing forests to future climate change.
136Figure 6: Spatial pattern of projected increase in NPP (%) for the future
(2021-2050) relative to current NPP for Sikkim
It should be added that such high increases in NPP may not be actually realized because IBIS model does not
have representation for nitrogen limitations in soil, changes in frequency of forest fires and pest incidences.
IBIS is a fairly complex process-based model. However, many processes (chemical, biophysical, etc) are not
represented in the model. This adds to the uncertainty. Also, IBIS depends on the input of climate change models.
For example, there is uncertainty in climate projections, particularly in precipitation at down-scaled regional
levels. There are inherent uncertainties in the projections generated by these models. Climate projections are
currently not available in probabilistic terms, which currently limit us from presenting a probability-based
forest dynamics scenario for India. Climate change might not have any observable impacts on forests in Sikkim.
MITIGATION AND ADAPTATION IN THE FOREST SECTOR
The fourth assessment report of the IPCC (2007) advocates this two-pronged approach to address climate
change. Mitigation involves reducing GHG emissions or enhancing sinks in forests and soil (Murthy et al.
2010). Forests can also contribute to climate change mitigation (IPCC 2007) by increasing in carbon density of
existing forests at both stand and landscape scales and reducing emissions from deforestation and degradation.
According to the IPCC, the mitigation potential of forest sector is estimated to be in the range of 8.2 to 13.5%
of total mitigation potential, considering all sectors. Carbon stock enhancement involves restoring carbon
stocks in degraded forests, or creating forests where none currently exist and approaches include afforestation,
reforestation, restoration through natural regeneration, assisted natural regeneration or planting, rehabilitation,
or forest landscape restoration (Miles et al. 2010).
The IPCC (2001) defines adaptation as “Adjustment in natural or human systems in response to actual or
expected climatic stimuli or their effects, which moderates harm or exploits beneficial opportunities. Various
types of adaptation can be distinguished, including anticipatory and reactive adaptation, private and public
adaptation, and autonomous and planned adaptation”. Adaptation to current climate variability can also
increase resilience to long-term climate change. The main drivers of changes in status of forests affect both the
area under forests, biodiversity, species composition, biomass productivity and regeneration. There is a need
for developing and implementing adaptation measures to enable forest ecosystems to cope with climate risks.
Many ‘win-win’ or ‘no-regret’ adaptation practices could be considered for implementation. A few examples
of adaptation practices (Murthy et al. 2010) include:
137• Modifying the forest working plan preparation process, incorporating the projected climate change and
likely impacts.
• Initiating research on adaptation practices, covering both conservation and forest regeneration practices.
• Linking protected areas and forest fragments.
• Anticipatory planting of species along the altitudinal and latitudinal gradient. Adopting mixed species
forestry in all afforestation programmes.
• Incorporating fire protection and management practices, and implementing advance fire warning
systems.
• Adopting sanitary harvest practices and thinning.
CONCLUSION
Analysis of climate change impacts on forest sector in Sikkim shows that there is not going to be any impact
in the short-term and long-term periods. But keeping in mind the various model limitations, there is a need
for better understanding of climate change impacts at a more regional basis. There is a need for climate
impact assessment studies using multiple global climate models as well as multiple dynamic global vegetation
models. This may require generation of climate, vegetation, soil and water-related data for the different forest
types. There is a need to develop tropical forest or country specific dynamic global vegetation models which
will require generation of a number of plant physiological parameters (Gopalakrishnan et al. 2011). Forest
management in the context of climate change should aim to moderate or offset the potential damages of climate
change and at the same time try to take advantage of the opportunities created by that change (Innes et al.
2009). Model limitations and uncertainties should not stop policies and interventions to reduce vulnerability of
forests to climate risks and enhance the resilience to projected climate change.
REFERENCES:
Collins, M., Tett, S.F.B., and Cooper, C. (2001). The internal climate variability of HadCM3, a version of the
Hadley Centre coupled model without flux adjustments. Climate Dynamics 17: 61–81
Forest survey of India (FSI) (2001) State of Forest Report (2001). Forest survey of India, Ministry of
Environment and Forests, Dehra Dun
Forest survey of India (FSI) (2005) State of Forest Report (2005). Forest survey of India, Ministry of
Environment and Forests, Dehra Dun
Forest survey of India (FSI) (2009) State of Forest Report (2009). Forest survey of India, Ministry of
Environment and Forests, Dehra Dun
Geoffrey Heal, Nature and the Marketplace, Capturing the Value of Ecosystem Services (2000), Washington
DC: Island Press, p. 1-2
Gopalakrishnan R., Jayaraman R., Bala G. and Ravindranath N.H. (2011) Climate change and Indian forests,
Current science, Vol. 101, No. 3, 10, pp 348-355
Gore, P. G., Thakur P. and Hatwar, H.R. (2010). Mapping of drought areas over India, NCC Research Report.
N0.12, India Meteorological Department, Pune.
Goswami, B. N., Venugopal, V., Sengupta, D., Madhusoodanan, M. S., and Prince, K. Xavier. (2006). Increasing
Trend of Extreme Rain Events Over India in a Warming Environment, Science, 1 December. 314: 1442-1445
138Innes J, Joyce LA, Kellomaki S, Louman B, Ogden A, Parotta J, Thompson I et al. (2009) Adaptation of forest
and people to climate change—A global assessment report. In: Risto Seppala., Alexander Buck and Pia Katila
(Eds) International Union of Forest Research Organizations (IUFRO)
IPCC (2001) Climate Change 2001: Synthesis Report, 2001a, Intergovernmental Panel on Climate Change,
Geneva, Switzerland
IPCC (2007) Climate Change 2007: Impacts, Adaptation and Vulnerability. Contribution of Working GroupII
to the Fourth Assessment Report of the Intergovernmental Panel on Climate Change. Parry ML, 174 Mitigation
and Adaptation Strategies for Global Change (2011) 16:161–175 Canziani OF, Palutikof JP, van der Linden
PJ, Hanson CE (eds.) Cambridge University Press, Cambridge, UK
Kucharik CJ, Foley JA, Delire C et al. (2000), Testing the performance of a dynamic global ecosystem model:
Water balance, carbon balance and vegetation structure. Global Biogeochemical Cycles, 14(3):795-825
McClean CJ, Lovett JC, Kuper W,Hannah L, Sommer JH, Barthlott W, Termansen M, Smith GE, Tokamine
S, Taplin JRD (2005). African plant diversity and climate change. Annals of the Missouri Botanical Garden,
92:139-152
McKee T. B., Doesken, N. J., Kliest, J. (1993). The relationship of drought frequency and duration to time
scales, In Proceedings of the 8th Conference on Applied Climatology, 17–22 January, Anaheim, CA. American
Meteorological Society: Boston, MA; 179–184.
Miles, L.J. (2002). The impact of global climate change on tropical forest biodiversity in Amazonia. Dissertation,
University of Leeds
Miles, L. 2010. Implications of the REDD negotiations for forest restoration. Version 2. UNEP World
Conservation Monitoring Centre, Cambridge, UK http://www.unepwcmc.org/resources/publications/pdf/
Restoration%20REDD%20briefing%20lo-res.pdf.
Murthy I K, Tiwari R. and Ravindranath N.H. (2010) Climate change and forests in India: adaptation
opportunities and challenges, Mitigation and Adaptation Strategies for Global Change, 16:161–175
Rupa Kumar, K., Sahai, A.K., Krishnakumar, K., Patwardhan, S.K., Mishra, P.K., Revadekar, J.V., Kamala,
K., Pant, G.B. (2006). High-resolution climate change scenarios for India for the 21st century, Current Science
90(3):334-344
Seppälä R, Buck A, Katila P (eds.) (2009) Adaptation of Forests and People to Climate Change: A Global
Assessment Report. IUFRO World Series Volume 22. Helsinki. 224 p.
AUTHORS
N.H.Ravindranath, Nitasha Sharma, Anitha Sagadevan
Mathangi Jayaraman, Madhushree Munsi
Centre for Sustainable Technologies
Indian Institute of Science, Bangalore-560012
Email: ravi@ces.iisc.ernet.in
139Trans-Himalayan alpine meadows of Tso Lhamo plateau, North Sikkim are not only the habitat of endangered
wildlife but also provide valuable fodder resources for the local pastoral community
Photo Courtesy: Pranav Chanchani
140You can also read