Climate Change Risks for European Aviation - Summary report - Eurocontrol
←
→
Page content transcription
If your browser does not render page correctly, please read the page content below

Climate Change Risks
for European Aviation
Summary report

SUPPORTING EUROPEAN AVIATION
Foreword

                      Eamonn Brennan, Director General EUROCONTROL

                      This report carried out by Egis and the UK Met Office on behalf of
                      EUROCONTROL sets out how our industry faces increasing disruption on
                      the ground and in the air from climate change, and highlights the growing
                      danger that climate change poses to all parts of the aviation sector.

                     It provides extensive quantitative data on storms, wind pattern changes, sea-
                     level rise and temperature increases that can help our industry better
understand how these will impact aviation in the years ahead, and update their climate change risk
assessments and adaptation strategies in order to build in resilience to adapt and address future
climate impacts.

The findings highlight the importance of the work done at network level by the EUROCONTROL
Network Manager and partners to mitigate weather impacts on delays and the environment.

Taking an integrated and collaborative network approach to managing bad weather has helped
reduce the impacts of major storms on the network in terms of extra costs, emissions and delays,
and its importance will further increase in the years ahead as extreme weather events increase in
frequency.

                                                                                                 2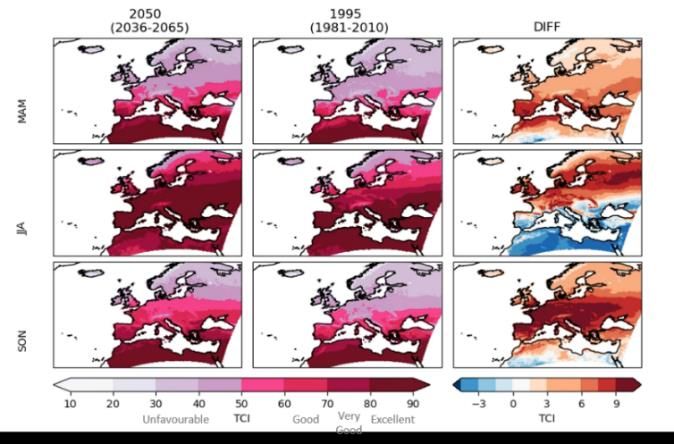
Contents
Foreword ........................................................................................................................................ 2
Introduction ................................................................................................................................... 4
Summary of the key findings ......................................................................................................... 5
An overview of short-term weather impacts on European aviation ............................................. 6
Impact of changes in storm patterns and intensity on flight operations ...................................... 7
Impact of sea level rise on European airport operations .............................................................. 9
Impact of Climate Change on Tourism Demand .......................................................................... 11
Impact of changes in wind patterns on flight operations............................................................ 13
Acknowledgements...................................................................................................................... 15

                                                                                                                                                 3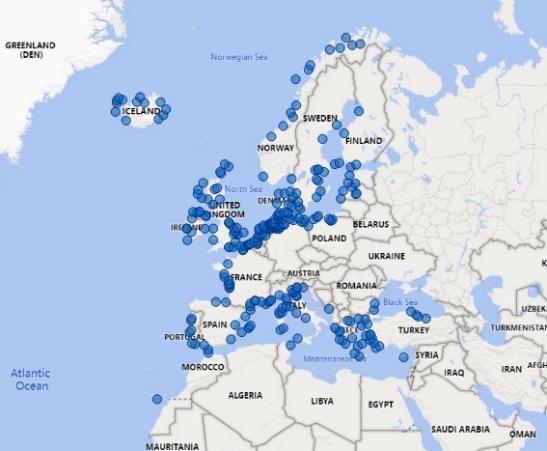
Introduction
Overwhelming scientific evidence demonstrates that the Earth’s climate is changing due to rising levels of
greenhouse gases in the atmosphere. The link between modern day climate change and emissions caused by
human activity is widely recognised, and increasingly so at the policy level. Whilst the recent European Green
Deal commitment to achieve carbon neutrality in Europe by 2050 is certainly cause for optimism, the latest
analysis from the United Nations Intergovernmental Panel on Climate Change reports that the earth’s global
average surface temperature is likely to reach 1.5°C above pre-industrial levels, the optimal target set out in
the Paris Agreement, within the next 20 years, regardless of any actions taken to cut greenhouse gas
emissions in that time. In a worst case scenario where no mitigation action is taken, global temperatures
could reach over 5°C above pre-industrial levels by the end of the century.
It is therefore expected that the impacts of climate change will increase across the century. It is not just rising
temperatures, but also the secondary impacts that are cause for concern. Higher temperatures are associated
with increasingly unpredictable or severe weather events, whilst the melting of land ice and the warming of
the oceans threatens coastlines around the world due to sea level rise. These impacts pose threats to
infrastructure, transport, supply chains, communities and the resilience of the global economy. More
positively, although it may seem counterintuitive, certain regions may see a more favourable climate for
certain activities, although this would not balance out the damage that climate change is likely to inflict.
To prepare for these potential impacts, it is vital that the European aviation sector understands the
character and scale of the risks that climate change poses to it, and acts in a proportionate and timely
manner to adapt and build resilience.
This study consists of five work packages which explore the risks posed by climate change to the European
aviation sector. The findings of each are summarised in this report, whereas the technical detail can be found
in the corresponding annexes:
Annex 1 – An overview of short-term weather impacts on European aviation: assesses the link between
disruptive weather and delays over the past ten years and next five years as a basis for the wider study.
Annex 2 – Impact of changes in storm patterns and intensity on flight operations: considers the potential
impact of changes in the intensity and frequency of storms on flight operations up to 2050.
Annex 3 – Impact of sea level rise on European airport operations: investigates the progression in flooding
risk expected for European coastal airports up to 2090 due to sea level rise and storm surge.
Annex 4 – Impact of climate change on tourism: assesses projected changes in the attractiveness of the
climate at European tourism destinations during summer and shoulder months and examines how intra-
European traffic could be impacted by 2050.
Annex 5 – Impact of changes in wind patterns on flight operations: investigates how flights could be
affected by changing wind patterns by 2050.
4
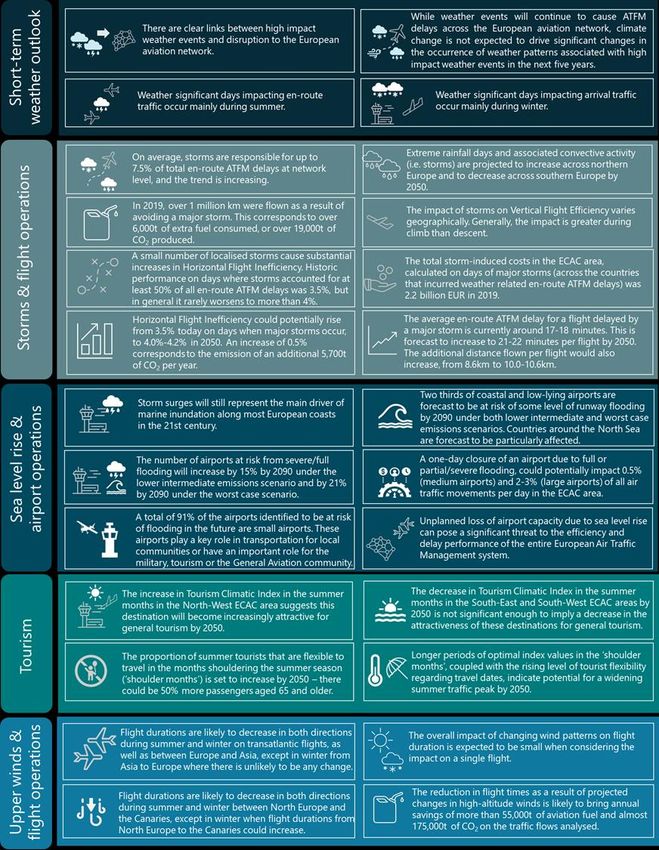
Summary of the key findings

                              5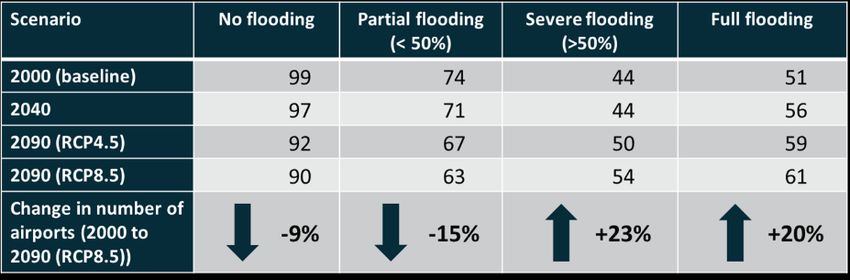
An overview of short-term weather impacts on European aviation
The impacts of weather can be disruptive and costly for the European aviation sector. A clear link between
disruptive weather and delays is apparent, yet the exact sensitivity of operations to different weather events
and between regions is not as well understood. Given that scientific literature suggests that certain weather
events could change in frequency, intensity, or both, in the future, it was important to assess the current
relationship and short-term outlook for the impact of weather on flight operations before exploring the
longer term trends associated with climate change.
The initial analysis outlined in full in Annex 1 aimed to explore:
The links between weather and Air Traffic Flow Management (ATFM) delays;
Patterns of European-scale weather associated with those ATFM delays; and,
Periods throughout the year when certain ATFM delays occur.
Both airport arrival and en-route ATFM delays1 were investigated to determine the number of significant
weather days impacting airports and countries across the European network. These trends were investigated
over the past ten years and forecast for the next five years to establish a baseline for the relationship between
weather and delays.
As expected, the analysis found clear seasonal trends in the datasets. Impactful weather
that causes airport arrival ATFM delay occurs more often in winter, for example
windstorms, snowstorms and fog. Meanwhile, impactful weather that causes en-route
ATFM delays (i.e. convective activity2) occurs overwhelmingly in summer.
Significant weather days for both airport arrival and en-route ATFM delays were compared
against the classification of weather pattern 3 observed on that day. As expected, there is
variability in the weather patterns that are responsible for disruption across European airports
and countries. The likelihood of a pattern causing an ATFM delay was found to be related to
the weather conditions expected with that weather pattern, for a given geographical location
and season.
There is no evidence for significant changes in these weather patterns over the next five years. This
suggests that, while weather events will continue to cause ATFM delays across the European aviation
network, the large-scale weather setups for these events are not expected to change in frequency due to
climate change in the short term. This does not mean that localised weather events that have the potential
to generate severe disruption will not occur. Over the next five years, the role of year-to-year natural
variability is considerable, and uncertainty due to this is expected to dominate any trends related to
climate change. This does not mean that changes will not occur out to more distant time horizons, as
explored in the rest of the study (Annexes 3 and 5).
1 ATFM delay is defined as the duration between the last take-off time requested by the aircraft operator and the take-off slot allocated
by the Network Manager following a regulation communicated by the Flow Management Position (FMP), in relation to an airport
(Airport ATFM Delay) or sector location (En-Route ATFM Delay).
2 Convective activity here refers to the vertical movement of air that can pose a hazard to aviation and is linked with thunderstorms.
3 The weather patterns used are primarily based on the classification of daily mean sea level pressure (MSLP) fields.
6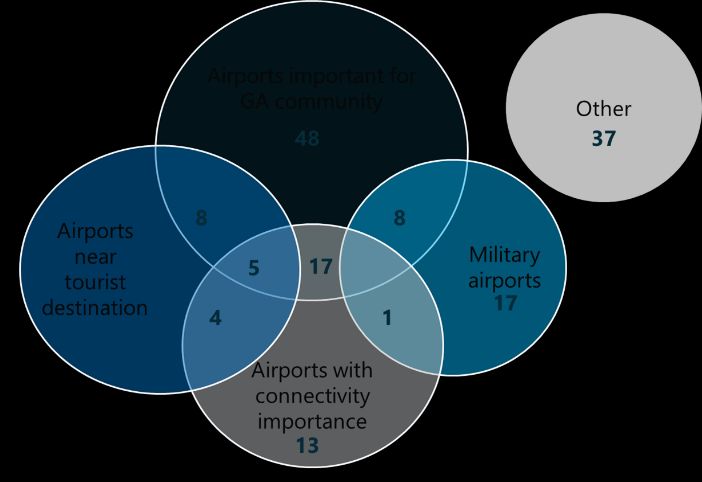
Impact of changes in storm patterns and intensity on flight operations
The analysis of short-term weather impacts on European aviation investigated the link between weather and
ATFM delays. This was used as a basis to assess the impact of changes in storm patterns and intensity, and
to quantify the impacts of storms on aviation for historical and future periods (up to 2050) using a set of
operational metrics. The methodology and findings are described in detail in Annex 2.
The climate analysis established a link between weather that is associated with ATFM delays and a small
number of weather pattern categories. The projected changes in these weather patterns out to 2050, as
indicated by climate models, enabled an assessment of how the likelihood of potentially disruptive weather
will change by mid-century. Changes in the frequency of intense, disruptive storms were also directly
quantified using climate model simulations.
A very strong relationship was found between:
Significant Weather Days4 (SWDs) with the most major en-route ATFM delays; and,
Storm intensity, for which the respective country average of the convective available potential
energy (CAPE)5 is used as a proxy.
This confirms that convection is responsible for a large proportion of the major en-route ATFM delay days.
The level of disruption associated with the different categories of weather patterns was
investigated in more detail. It was found that weather patterns characterised by drawing
warm and humid air northward from the Mediterranean are associated with a greater
probability of en-route ATFM delay due to disruptive convection likely to be concentrated in
southern and central Europe. Weather patterns characterised by deep low-pressure systems across northern
and western Europe are associated with a greater probability of arrival ATFM delay in these areas due to
disruptive high surface wind speeds. By understanding the link between weather patterns and SWDs the
projected changes in weather patterns can be used to determine the projected changes in ATFM delays.
Considering the changes in weather pattern occurrence projected by climate models out to 2050, a
possible shift towards more frequent settled weather regimes across northern Europe in summer is
expected. This suggests that weather patterns for impactful summer storms may become less common
but does not necessarily mean that there will be less Significant Weather Days (SWDs) overall.
Using extreme daily rainfall as a proxy for convective activity (i.e. storms), extreme rainfall days are projected
to increase across northern Europe, but decrease across southern Europe6. The regions of northern Europe
that are projected to have the greatest increases in days with extreme rainfall actually have the least
potential for en-route ATFM delays in the current climate. Given the very localised impact of disruptive wind
speeds it is difficult to make robust statements about the projected changes in these events in climate
models, nevertheless changes by 2050 are not expected to fall outside the present-day observed variability.
4 Significant weather days (SWDs) refer to days on which considerable ATFM delays were experienced.
5 CAPE is measured in joules per kilogram of air, and when greater than zero this indicates instability and that an increasing
possibility of thunderstorms and hail exists.
6 Here, northern and southern Europe refers to the general regions. The operational impact analysis in the report explores impacts
at the level of five areas: Western Europe, Mediterranean, Central/Eastern Europe, Northern Europe and Iberian Peninsula.
7Storms are historically responsible for up to 7.5% of total en-route ATFM delays at network level.
If a flight is affected by a storm, then the average en-route ATFM delay due to that storm can
be expected to be around 17-18 minutes per delayed flight. By 20507, the proportion of flights
experiencing en-route ATFM delays due to a major storm is likely to decrease, but if a flight
ends up being delayed by a storm, the delay will be on average greater by 3-5 minutes than it is today.
The horizontal flight inefficiency measured at ECAC network level during days of major
storm activity was historically around 20% worse than the average performance measured
throughout the year. However, inefficiency on days with major storms rarely increased
above 4%. Although performance on individual days when major storms occurred
deteriorates significantly, the localised geographical extent of such storms means the
overall impact on annual performance remains very small. The horizontal flight
inefficiency measured across all days when major storms accounted for at least 50% of all en-route ATFM
delays was 3.5% (2013-2019). This should be compared to overall average performance, which ranged
between 2.7% and 2.9% across 2013-2019.
In 2019, over 1 million kilometres were flown as a result of avoiding a major storm. This
roughly corresponds to more than 6,000 tonnes of extra fuel consumed, or over 19,000
additional tonnes of CO2 produced. This should be taken in context: the total gate-to-gate
carbon dioxide (CO2) emissions of IFR traffic in the European Civil Aviation Conference (ECAC)
area was 202 million tonnes in 20198. The additional distance flown due to storms was 8.6 km per flight.
Due to the projected changes in intense convective activity (used as a proxy for storm activity) horizontal
flight inefficiency could increase to 4.0%-4.2% by 2050. This was measured across all days when major
storms accounted for at least 50% of delay and is based on data for all countries projected to be impacted
by a major storm. This suggests a 0.5% increase in horizontal flight inefficiency compared to 2013- 2019,
or around an additional 5,700tCO2 per year.
For the purpose of this study, vertical flight efficiency is measured as a distance flown level
during approach or climb phases of flight. As most of the storms occur during the peak
summer months (June to August), vertical flight efficiency on days when major storms took
place was compared against typical summer values. Results suggest variability of impacts
across the countries in the sample, with the general seasonal impact on vertical flight efficiency during the
climb phase of flight being greater than its impact on vertical flight efficiency during the descent phase.
The total storm-induced costs over the ECAC area, calculated on days of major storms across the
countries that incurred weather related en-route ATFM delays (and associated deterioration in
horizontal flight efficiency), were estimated to be €2.2 billion in 2019. The greatest share of these
costs (61.6%) relates to en-route ATFM delays caused by a major storm, followed by the cost of
lost passenger time (28.8%). Less than 10% of costs can be attributed to the extra fuel and additional
emissions associated with avoiding storms.
7 Inthe absence of any recent long-term traffic projection, the latest STATFOR long term forecast (projected until 2040) was used as
a basis for extrapolation of traffic evolution to 2050. This is described further within Annex 2.
8 As reported in the Editorial of the Spring/Summer 2020 edition of EUROCONTROL’s Skyway magazine. In fact emissions increased
by 24% between 2012 and 2019 from 163 million to 202 million tonnes of CO2.
8Impact of sea level rise on European airport operations
A key impact of a warming planet is Sea Level Rise (SLR), caused by thermal expansion of sea water and the
melting of ice accumulated on land. SLR generates an increasing risk of flooding along coastlines, which will
be amplified by increased frequency or intensity of storm surges. It is expected that Global Mean Sea Level
(GMSL) rise could reach up to 0.84 m by
2100 compared to years 1986–2005.9
In the ECAC region, there are more than 270
coastal or low-lying10 airports that classify
as aerodromes and aerodromes with
heliports 11 . Some of these airports have
already recognised the risk and begun to
prepare, for example by the improvement
of airport drainage systems. In a world
where SLR and changing storm patterns are
expected across the century, however, it is
likely that the level of European flooding risk
will also rise. This would not only increase
the risk for those airports already affected
but threaten other airports not currently at
risk.
Figure 1: Coastal and low-lying airports in the ECAC region
It is crucial for the protection and resilience of European airport capacity that airport operators are aware
of the risk they face from Sea Level Rise (SLR) and climate change, and understand the steps they can
take to better characterise and adapt to this risk at the local level.
The investigation into the European-level threat of rising sea level on airport capacity in the ECAC region was
assessed and is detailed in full in Annex 3. To quantify the number of ECAC airports at risk from marine
flooding, Geographic Information System (GIS) simulations were used to compare sea level projections
against airport elevations of coastal airports based on the worst case scenario (RCP8.5) and lower
intermediate scenario (RCP4.5) for greenhouse gas emissions. The projected flooding risks combine the
effects of storm surges (100-year return period), expected SLR, and Glacial Isostatic Adjustment (GIA)12.
Flooding risk refers to the level of flooding of the runway track and was categorised into no flooding, partial
(More than 270 coastal and low-lying
airports (aerodromes and aerodromes
with heliports) were assessed. In total,
two thirds of airports (178 of 273) are
expected to be at risk of marine
flooding in the event of a storm surge
during the period up to 2090. The
number of ECAC airports at risk of
Table 2: Summary of airports impacted by a 100-year storm during the reference
year (2000), 2040 and 2090 (RCP4.5 and RCP8.5). Arrow shows change from current severe or full flooding is projected to
number of airports at risk under the worst case emissions scenario (RCP8.5). Note increase by just over 20% by 2090
that details of data limitations and validation are described in Annex 3. (RCP8.5) in both cases13.
The operational impact assessment investigated the effect on large airports (>100,000 movements) and
medium airports (30,000 – 100,000 movements). A one-day closure at an airport due to full or
partial/severe flooding could impact around 0.5% (medium airports) or 2-3% (large airports) of all
movements per day in the ECAC region.
The cost of diverted and cancelled flights in the case of a one-day closure due to full flooding could be in
the region of €3 million (medium airports) or €18 million (large airports). The average estimated cost of
diverted, cancelled and delayed flights due to partial or short-term airport closure caused by partial/severe
flooding is slightly lower - around €2 million (medium airports) or €15 million (large airports). Actual costs
will vary significantly based on airport operations and characteristics such as the nearest alternative airport
or the extent of damage.
A total of 91% of the airports that were identified as
at risk of flooding are small airports, where typically
less than 10,000 movements per year are expected.
These small airports may play a key role in supporting
the local community, the military, the tourism sector
or the General Aviation (GA) community. Whilst the
costs from delayed, diverted and cancelled flights at
these airports may be limited, the costs to the local
or regional economies from secondary impacts are
expected to be far greater.
Figure 3: Categories of small airports identified as at risk of flooding
Unplanned loss of airport capacity due to SLR can
also pose a threat to the efficiency and delay performance of the entire European Air Traffic Management
(ATM) system. In the event of an airport closure due to an environmental event such as a storm surge,
network impacts can be observed from both tactical and strategic perspectives, as discussed further within
the technical annex. Other impacts include cost implications of disrupted airport operations on airlines and
impacts associated with loss of ground transport links due to flooding.
13This is of the same order of magnitude as found in a JRC study published in 2019, which suggests that 196 coastal airports will be
at risk of flooding in 2080 based on RCP 8.5.
10Impact of Climate Change on Tourism Demand
With climate change increasingly affecting the temperature, weather patterns and environment of locations
worldwide, there is a possibility that the appeal of (and thus demand for) existing tourist hotspots could
change geographically or shift in time, or a combination of both. There are many aspects that inform tourist
travel choices. A common consideration is climate, which can influence the choice of destination and time of
year of travel, both being associated with a perceived favourability towards a certain climate and acceptable
comfort level by the consumer.
This study focuses on summer tourism and the analysis is described in full in Annex 4. To estimate
destination favourability, a measure of tourist comfort based on climate, the Tourism Climatic Index (TCI)
was used. The TCI indicates the desirability of a destination’s climate for tourism by combining climate
variables, including those representing thermal comfort, in a mathematical formula and classifying values
into defined categories ranging from ‘ideal’ to ‘impossible’. Historical climate data (ERA5) and the UK Climate
Projections 2018 (UKCP18) regional model were used to model European TCI levels and predict trends on the
2030- and 2050- timescales. Changes in climate have been analysed based on thirty-year averages centred
on 2050.
There are significant challenges and limitations associated with modelling tourist behaviour, particularly with
respect to the link between climate and tourist demand. This study instead undertook a high-level
assessment to consider the proportion of tourists that would be able to alter their holiday patterns in order
to take advantage of any changes in optimal destination climate favourability. A base-case traffic forecast
was developed for the month of August on the 2030- and 2050- timescales using traffic data from Sabre for
a sample of airports selected for their level of seasonal tourism. The potential impact of climate change on
air traffic movements for August 2030 and August 2050 was explored based on a combination of projected
TCI, tourism demographics and drivers of tourism.
TCI Analysis
Across the ECAC region, countries are projected to have an increasing length of time in which the climate will
be ‘Good’ to ‘Ideal’ for general, low level tourist activity. For most countries, this increase will be the result
of improved climate for tourism into the autumn months (September-October-November), particularly in
central Europe.
Countries in the south of the ECAC region
will see a small decrease in destination
favourability in the summer months
(whilst remaining favourable) driven by
changes in the climate parameters
underpinning the TCI, but an
improvement in both spring and autumn
months.
It is likely that central Europe, northern
Spain and most of Scandinavia will Figure 4: TCI values for peak summer tourism months (middle row) and
become more favourable all year round for shoulder months (March-April-May on top row, September-October-
November on bottom row). Note that the ‘Ideal’ TCI category refers to
general, light tourism activity, with a the TCI range 90 – 100 (not shown on the scale bar).
11projected improvement in TCI in all seasons. The Atlantic island groups (the Azores, Madeira and
Canary Islands) are also projected to increase in TCI value in all seasons, improving the existing
favourability of these destinations.
Patterns in TCI change should clearly emerge by 2030, particularly for countries projected to see an
improvement in TCI during summer (June-July-August), and it is likely that these changes will develop
and be observable in the next decade.
Northern and central ECAC countries will see an increased TCI (improving destination favourability)
during summer months, with a number of countries improving to the same TCI levels as countries in the
southern ECAC region on the 2050 timescale
Potential Traffic Impacts
Based on analysis of the current and future European demographics and the flexibility within
certain sections of the population to travel outside of the peak summer period, the
following was found:
Around 12% of tourists travelling by air from the top six tourist origin countries for this study’s airport
sample are currently in the 65 and over age bracket. Looking ahead to 2050, however, the number
could increase by 50% by 2050.
The UK and Germany were identified as having the highest proportion of tourists in this age bracket,
as well as the highest total number of passengers travelling to the airports in the sample. Changes in
the time of year that elderly UK and German citizens go on holiday would most impact flows (i.e.
reduce number of passengers) to the South West in August, both now and in 2050.
Whilst the proportion of intra-ECAC traffic comprised of tourists travelling without children could not
be estimated with the available data, the number is likely to be significant given that currently almost
50% of the EU population are adults without children; the proportion is set to increase by 2050.
Findings indicate a significant proportion of the passenger-base would be able to take advantage of the
forecasted widening period of optimal tourism climate in Europe.
It proved difficult to assess the number of tourists that could be constrained in their choice of holiday location
in peak summer months. Whilst it is not anticipated that climate favourability will act as a key driver for
changes in summer holiday location on the 2050 time horizon, tourists may choose to take advantage of
increasingly favourable climates for tourists in the ECAC North West region. The relative
size of existing flows means this could have a significant impact on demand at North
Western tourist-focused airports - a transfer of 10% of tourists expecting to travel to the
South East in 2050 would result in a nearly 70% increase in tourists travelling to the North
West based on the base case scenario for the airports sampled.
The expected rise in tourist climate favourability in France and Germany to mirror Mediterranean levels is
also significant, noting these represent two of the dominant tourist origin countries. If tourist behaviour
responds to these changes, projected growth in summer traffic flows to the ECAC South West and South East
may be reduced. As well as shifting traffic demand away from international flights, increased domestic
tourism in France and Germany would very likely lead to modal shift as those tourists take alternative means
of transport.
12Impact of changes in wind patterns on flight operations
The day-to-day variability of high-altitude winds has a considerable influence on the time-optimal routes of
aircraft. The jet stream is a feature of high-altitude winds that has a significant influence on transatlantic
flights.
The jet stream is projected to strengthen and shift poleward under climate change, impacting transatlantic
flight routings and duration. Surface winds have an important impact on airport operations therefore the
changes for a subset of European airports were also considered in this part of the study. The full analysis is
outlined in Annex 5.
The study uses a state-of-the-art trajectory prediction (TP) algorithm that was applied to both historical
observed data, and historical and future climate model data to understand past and future trends in flight
duration. The historical observed flight times are classified by weather patterns, with future changes in flight
duration derived through the projected changes in the weather patterns. Meanwhile, the future changes in
flight times were also calculated directly using the output from climate models to provide additional detail.
Finally, wind roses were plotted for a sample of European airports and linked to weather patterns to assess
what the projected changes in weather patterns means for future changes in wind direction.
The effect of weather pattern on flight duration, using historical data, is strongest in winter
and weakest in summer. The simulations predict that, by 2050, summer weather patterns
will have changed more than those of winter. Indeed, little change is expected in winter
weather patterns. Overall, this makes identifying potential changes to flight duration from
weather pattern analysis alone rather difficult. On the other hand, it has been possible to estimate changes
in flight durations from a direct application of the TP algorithm to climate model data. This indicates that:
Both eastbound and westbound transatlantic flights are projected to become shorter in duration
by 2050 (by approximately 1-2 minutes), in both summer and winter.
Flight durations are also projected to decrease for flights from Europe to Asia in both summer and
winter (by approximately 2-5 minutes), and from Asia to Europe in summer (by approximately 2-4
minutes). There is unlikely to be a change in duration for flights from Asia to Europe in winter.
Flight durations from the Canaries to North Europe (northbound) are projected to decrease
(irrespective of season) by approximately 1-3 minutes.
There is an indication that flight durations from North Europe to the Canaries (southbound) could
decrease in summer (by about 1 minute) and increase in winter (by about 1 minute).
These changes can be understood by considering the most significant changes in high-altitude winds. It is
found that the zonal mean (averaged over a latitude circle) zonal wind is projected to strengthen in the mid-
latitudes in winter, while weakening in the high latitudes. This is interpreted as a ‘narrowing’ of the strongest
high-altitude winds (in other words, these winds become stronger where they are already strongest but
weaken further to the north). Therefore, eastbound flights can benefit from stronger winds where they are
already strongest, while westbound flights can avoid stronger head winds due to this ‘narrowing’. This has a
particularly strong impact on transatlantic flights, but this effect is expected to extend (albeit weaken) across
Europe and Asia, thereby influencing flights between Europe and Asia (particularly North Asia).
13Although the average impact of changing wind patterns on a single flight may look
negligible, the combined impact - which takes into account all flights operating on the
traffic flows considered in this study - is much more substantial. The overall reduction in
flight times, as a result of projected changes in high-altitude winds, is likely to bring savings
of more than 55,000t of aviation fuel per year, which corresponds to roughly 175,000t of CO2
saved each year, with the greatest reduction expected on routes to and from Asia. These figures assume
current fleet mix, aircraft performance and pre-pandemic traffic levels. Traffic, fuel burn and emissions are
forecast to increase substantially from 2019 to 2050. The fuel and emissions that can be saved by taking
advantage of changes to the jet stream on the traffic flows analysed should also increase – as presented in
the table below:
2050 traffic at 2019 traffic Expected 2050 traffic levels Expected 2050 traffic levels
Fuel and CO2 saved
levels (0% change) (+47%) (+65%)
(1,000 tonnes)
Fuel burn CO2 Fuel burn CO2 Fuel burn CO2
Europe to North America 9 28 13 42 15 47
North America to Europe 12 38 18 56 20 63
Europe to Asia 23 72 33 105 37 118
Asia to Europe 10 32 15 47 17 53
N. Europe to CanariesAcknowledgements
This study was undertaken on behalf of EUROCONTROL by Egis and the UK Met Office.
Find out more about them by visiting their websites:
Egis: https://www.egis-aviation.com/
Met Office: https://www.metoffice.gov.uk/services/research-consulting/weather-climate-consultancy
15SUPPORTING EUROPEAN AVIATION © EUROCONTROL - September 2021 This document is published by EUROCONTROL for information purposes. It may be copied in whole or in part, provided that EUROCONTROL is mentioned as the source and it is not used for commercial purposes (i.e. for financial gain). The information in this document may not be modified without prior written permission from EUROCONTROL. www.eurocontrol.int
You can also read