ASSESSING SHORELINE RESPONSE TO SEA LEVEL RISE: AN ALTERNATIVE TO THE BRUUN RULE
←
→
Page content transcription
If your browser does not render page correctly, please read the page content below
ASSESSING SHORELINE RESPONSE TO SEA LEVEL RISE: AN
          ALTERNATIVE TO THE BRUUN RULE

V Rollason1, D Patterson2, C Huxley2
1
 BMT WBM, Newcastle, NSW
2
 BMT WBM / University of QLD, Brisbane, QLD

Introduction

The Coastline Management Manual guided coastal hazard assessment in New South
Wales for the last 20 years. In 2009 the NSW Government (DECCW) released its ‘Sea
Level Rise Policy Statement’ and in 2010, ‘Draft Guidelines for preparing Coastal Zone
Management Plans’ (CZMP Guidelines), setting the minimum standard for assessing
shoreline recession due to sea level rise and coastal erosion.

DECCW (2010) recognise the limitations of the nearly 50 year old Bruun Rule (1962)
as a coarse first order estimate of recession due to sea level rise. DECCW (2010)
noted the new techniques now available for assessing shoreline recession and erosion.
This paper shall introduce the new techniques to the coastal management fraternity
and demonstrate their superior predictive capacity over the Bruun Rule. Councils
wishing to limit future liability from coastal hazards and climate change should make
themselves aware of the new ‘best practice’ techniques.

First, a Shoreline Evolution Model (SEM) has been developed that includes the effect
of headlands, reefs, breakwalls and other structures, the NSW wave climate and
longshore transport in predicting recession due to sea level rise. The Bruun (1962) and
Hallermeir (1981) equations cannot represent these three dimensional features. The
SEM is able to predict spatial variations in recession along a coastline updrift compared
with downdrift of headlands, and other structural effects.

Second, a Shoreline Response Model (SRM) capable of predicting storm erosion and
recession due to sea level rise and climate change induced shifts in wave climate has
also been developed.

Using examples from NSW (e.g., Coffs Harbour, Wooli), traditional models (e.g.
SBEACH) and approaches are compared to the new techniques. Traditional
approaches cannot account for existing variability in the wave climate over the medium
term (decades), and are unable to account for future change in the wave climate
combined with sea level rise.

Context for Using Available Techniques

The CZMP Guidelines have reiterated the responsibilities of local councils in
undertaking Coastal Zone Management Plans, including coastal hazards definition
studies. Councils who undertake coastal management actions in ‘good faith’ shall gain
exemptions from liability under the Coastal Protection Act, 1979. Decisions are said to
be made in ‘good faith’ where they are based upon the best available information and
sound science, and this implies the use of the best predictive tools available to
investigate coastal hazards extents. The hazards should then be incorporated into a
risk-based coastal planning approach, to account for uncertainties in assessment
techniques and climate science.

                                                                                       1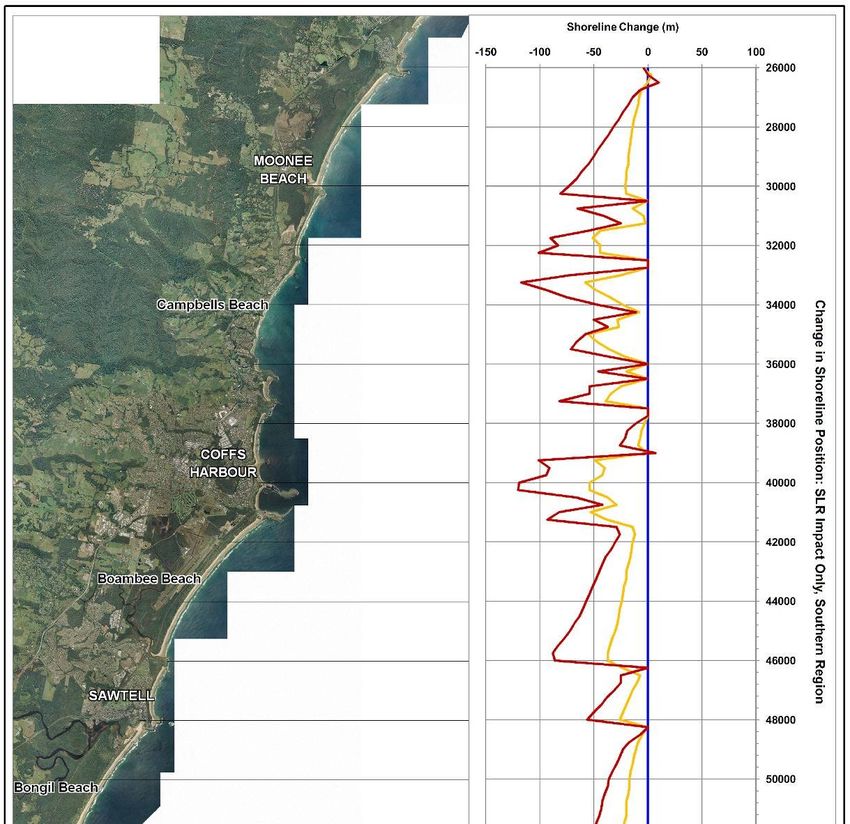
The capability of assessment techniques to provide the best available information is
dependent upon the aim of the assessment (e.g. storm erosion for planning purposes,
beach nourishment design), but also, the predictive ability of the assessment technique
itself.

Empirical and modelling techniques are reviewed here primarily in the context of their
capabilities in estimating the beach erosion and long term recession hazards at the
current and future timeframes, as part of a coastal hazards definition study. The
hazards definition directly influences future planning efforts, forming the basis of
local/regional Coastal Zone Management Plans. Due to this, the hazard estimates must
be suitable for planning purposes, particularly, for managing existing and future
development in the coastal zone.

The CZMP Guidelines define beach erosion as the short term response of the sandy
beach to waves and water levels during storms. This response may occur in relation to
a single event or series of events in succession (DECCW, 2010). Shoreline recession
is defined as the long term permanent landward movement of the shoreline in response
to a net deficit in sediment budget over time (DECCW, 2010). This may be caused by
an interruption in longshore sediment transport, lack of sediment supply, as a response
to sea level rise, or a combination of these processes.

Available Assessment Techniques

There are a range of available assessment techniques, including empirical approaches
and modelling approaches. The common techniques used in NSW for beach erosion
and recession estimates include photogrammetric (and other data) assessment,
SBEACH, the Bruun Rule, Hallermeier equations, and two new models, namely the
Shoreline Evolution Model and Shoreline Response Model. The capabilities and
limitations of each technique are summarised in Table 1.

                                                                                     2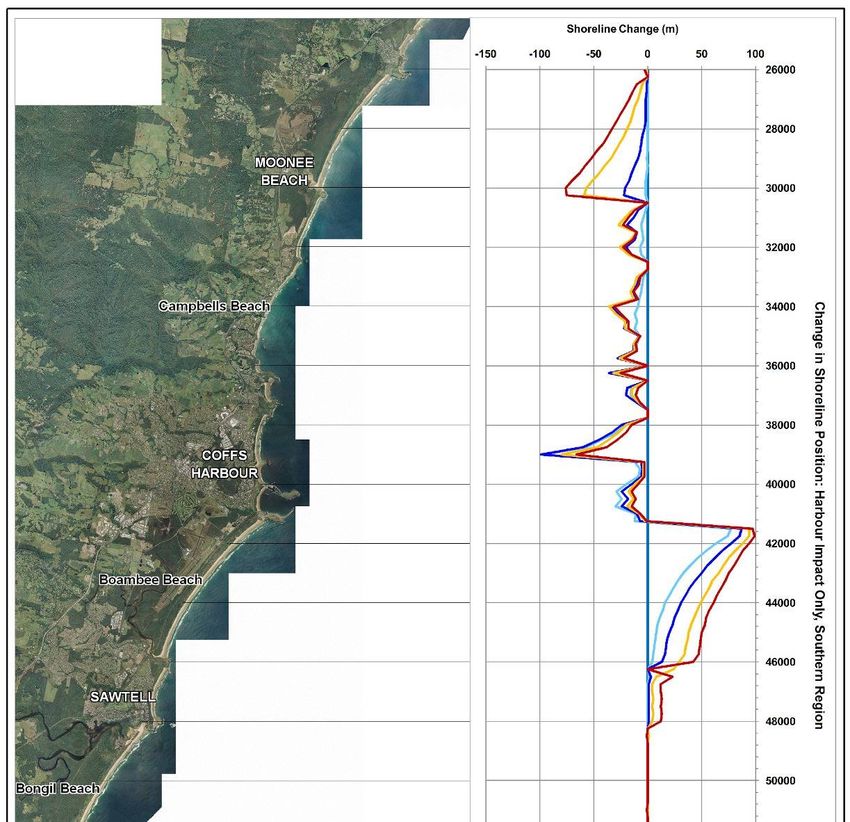
Table 1 Comparison of Available Hazard Assessment Techniques

               Photogrammetry                                                            Hallermeier      SEM                              SRM
                                              SBEACH               Bruun Rule (1962)     (1981)
               Analysis                                                                                   (Patterson, 2009)                (Huxley, 2009)

                                              Yes.                 Is an equilibrium     No.              Yes.
                                                                   cross-shore profile   This equation                                     Yes.
Cross-shore                                   This is done in 2D   concept, but does                      Calculates transport outside
               Provides snapshots of                                                     only                                              Calculates transport within
transport                                     cross-section        not calculate                          surfzone and interchange of
               beach state, thus shows                                                   estimates the                                     the beach and surfzone
                                              form, ignoring       transport under                        sediment across the closure
               outcome of combined                                                       depth of                                          region.
                                              longshore effects.   waves.                                 depth.
               transports, not separate                                                  closure term
Longshore      transports. Analysis is                                                   for use in the
                                              No                   No                    Bruun Rule.      Yes                              Yes
Transport      limited by coverage of data
Combined       both over time and along a
cross &        beach.
                                              No                   No                                     Yes                              Yes
longshore
transport
               Yes, but skill and care
               required to interpret data                                                                                                  Yes.
Beach          to separate data
erosion                                       No.                                                         Yes.                             This is the only model
               inaccuracies from short                                                                                                     capable of modelling short
hazard for     term (storm) processes,        SBEACH cannot                                               The model can be applied to
planning                                                                                                                                   term (hourly) to long term (up
               medium term wave climate       model shoreline      No                                     regional scale and individual
purposes (i.e. variability, long term                                                                                                      to 100 years) shoreline
                                              evolution with                                              beach units over long term or
including                                                                                                                                  response. Capable of
               change (sediment deficit).     longshore                                                   shorter time frames to
longshore                                                                                                                                  modelling recovery between
                                              gradients.                                                  calculate shoreline evolution.
processes)     Analysis is limited by                                                                                                      storms, as well as storm
               coverage of data both over                                                                                                  erosion.
               time and along a beach.

                                                                                                                                                                   3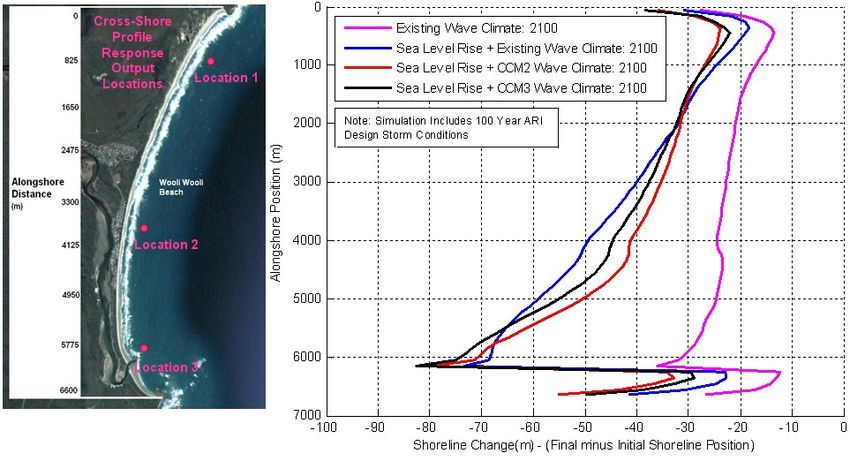
Photogrammetry                                                           Hallermeier   SEM                              SRM
                                               SBEACH                Bruun Rule (1962)   (1981)
                Analysis                                                                               (Patterson, 2009)                (Huxley, 2009)
                                               Yes, but limited to                                                                      Yes.
                                               cross shore                                                                              Calculates combined
Storm           No. Data is too coarsely       component only.                                                                          longshore and cross shore
Demand (e.g.    spaced (> 1 year) to           Longshore                                                                                transport during storms, to
                                                                     No                                No.
during single   capture erosion during a       transport is                                                                             represent design storm
design storm)   single storm event             ignored. Effects of                                                                      effects along a beach unit.
                                               rip cells are not                                                                        Effects of rip cells are not
                                               included.                                                                                included.
                                               Analysis limited to
              Yes, but care and skill
                                               cross shore
              required to interpret data
Shoreline                                      component only.                                         Yes.                             Yes.
              for short, medium and long
Response to term signals must be               Longshore                                               Model is run with time series    Model is run with time series
Existing Wave separated.                       transport is          No                                (height, period and direction)   (height, period and direction)
Climate                                        ignored, thus                                           representing existing wave       representing existing wave
Variability   Analysis is also limited by
                                               errors in                                               climate                          climate
              coverage of data both over
                                               estimation are
              time and along a beach.
                                               likely.
                Limited projections are        Analysis limited to
                possible only where            cross shore
Shoreline                                                                                              Yes                              Yes
                sufficient data is available   component only.
Response to                                                                                            Model can be run with time       Model can be run with time
                to assess beach response       Longshore
Future Wave                                                                                            series (height, period and       series (height, period and
                to various wave climates.      transport is          No
Climate due                                                                                            direction) representing          direction) representing
                In most cases, coverage of     ignored, thus
to Climate                                                                                             projected changes to wave        projected changes to wave
                data both spatially and        errors in
Change                                                                                                 climate with climate change.     climate with climate change.
                over time would preclude       estimation are
                such an assessment             likely.

                                                                                                                                                                 4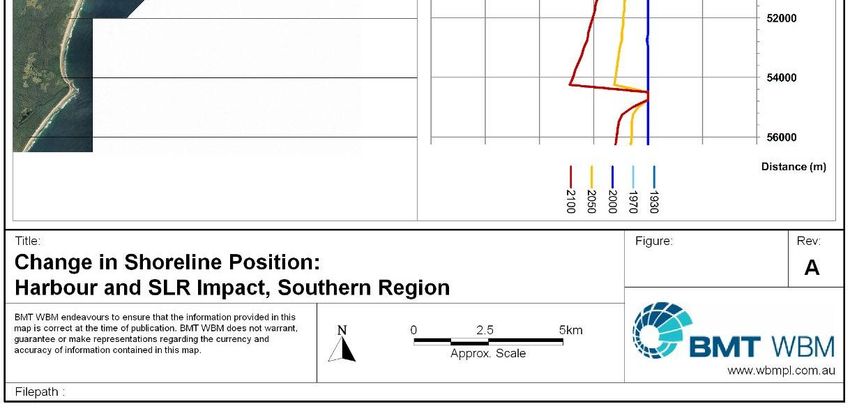
Photogrammetry                                                                 Hallermeier   SEM                              SRM
                                               SBEACH                Bruun Rule (1962)        (1981)
               Analysis                                                                                     (Patterson, 2009)                (Huxley, 2009)
                                                                     Limited to
                                                                                                            Yes.
                                                                     unstructured open,
                                                                     long coastlines only.                  Regional scale simulations
               No. There has been a                                                                         provide superior prediction of
               small rise in sea level over                          Concept is unable to                                                    Yes.
                                                                                                            alongshore variation in
               the prior 100 yrs (~ 10 cm),                          account for regional
                                                                                                            recession, for example,          Single beach unit scale
               however this is within                                longshore transport
Recession                                      Analysis limited to                                          enhanced recession at            simulations can model
               natural sea level variability                         and effects of coastal
Due to Sea                                     single profile                                               southern ends of beaches         combined sea level rise and
               (10 -15 cm on decadal                                 structures. Likely to
Level Rise                                     response only.                                               compared with Bruun Rule.        changes in wave climate,
               scale). Further, data                                 under- or over-
                                                                                                            The model includes features      including enhanced
               limitations limit                                     estimate recession
                                                                                                            such as longshore transport      recession at southern ends
               assessment of such                                    on shorelines with
                                                                                                            (regional and/or local scale),   of beaches
               impacts.                                              structural features
                                                                                                            back- barrier levels,
                                                                     that interact with
                                                                                                            headlands, seawalls, reefs
                                                                     longshore and cross-
                                                                                                            and breakwaters..
                                                                     shore transport.

               Yes.
               However, data limitations                                                                    Yes.
Recession
Due to         may limit the extent to                                                                      Capable of modelling impact
               which recession processes                                                                    on shoreline of structures       Yes, within single beach
Structures                                     No                    No.
               can be separated from                                                                        with and / or without sea        units.
(e.g.
breakwaters)   other natural shoreline                                                                      level rise on regional /
               change in response to                                                                        multiple beach unit scale.
               wave climate.

                                                                                                                                                                    5
Empirical Approach using Available Data

Empirical methods involve the use of photogrammetry, beach survey, hydrographic
charts, aerial photography, maps and geomorphological indicators to assess the beach
erosion and shoreline recession hazards. Typically, the main component of available
data is photogrammetry. Photogrammetry analysis requires experience to include or
exclude data for accuracy (e.g. elevation inaccuracy from older photographs, sand
mining, changes in vegetation height etc). Excluding inaccurate data, photogrammetry
analysis then requires sound knowledge of coastal geomorphology to calculate and
separate short term erosion and long term recession processes. For example, to
recognise erosion scarps, features of the beach system such as incipient dunes,
contemporary dune evolution, medium term beach cycles (accretionary or erosionary
decadal cycles), ongoing permanent recession and so on.

Photogrammetric data cannot be used to estimate the storm demand occurring during
an individual ‘design’ storm, because the dates of data are coarsely spaced in time (> 1
year between dates) and may not capture a ‘design’ event. However, for planning
purposes, for example, deriving setbacks for housing development in the coastal zone,
measuring erosion from a single ‘design’ storm event only involving water levels and
waves does not fully describe the potential erosion risk. In addition to water levels and
waves, the extent of beach erosion is also affected by the beach state prior to storm
impact (e.g. eroded or accreted), wave direction, longshore transport processes and
sediment bypassing of headlands, and the impact of consecutive, closely spaced
storms.

The envelope of natural shoreline movement relating to climatic processes, rather than
erosion from a single storm, is more appropriate for planning development setbacks.
Photogrammetry and beach survey can provide a picture of the envelope of beach
change. However this analysis is dependent upon the quality and amount of available
data.

The assessment of long term recession with photogrammetry requires careful analysis
and professional experience to separate short term storm processes, medium term
shoreline variability from a permanent landward movement of the shoreline. An
extended period (decade(s)) of wave climate promoting erosion may appear as long
term recession in the photogrammetric data, but may actually be part of a cyclic,
reversible process. For example, when photogrammetric data was reviewed in the late
1980s after the stormy decade of the 1970s, many NSW beaches were determined to
be receding. From the 1980s to ~ 2007, a number of NSW beaches have
demonstrated prolonged accretion, with the growth of incipient dune features (for
example, Bongil Beach, Moonee Beach and Station Beach in Coffs Harbour and the
majority of Wollongong’s beaches). When all of the data is combined, the assessment
indicates such beaches to be stable.

Empirical analysis is dependent upon data availability both over time and spatially
along the beach. Analysis with photogrammetry is limited by the number of reliable
surveys, the timing of surveys in relation to wave climate and storm events, and the
extent of beach measured. Photogrammetric data provides only snapshots over time,
and greater extents of change (erosion, accretion) than captured by the data are
possible. All but very few beaches have fongoing and regular beach survey programs
(e.g. Narrabeen, Moruya).

Where data is limited to develop clear conclusions, modelling may assist in data
interpretation and prediction for hazard extents. The limitations in the historical data

                                                                                       6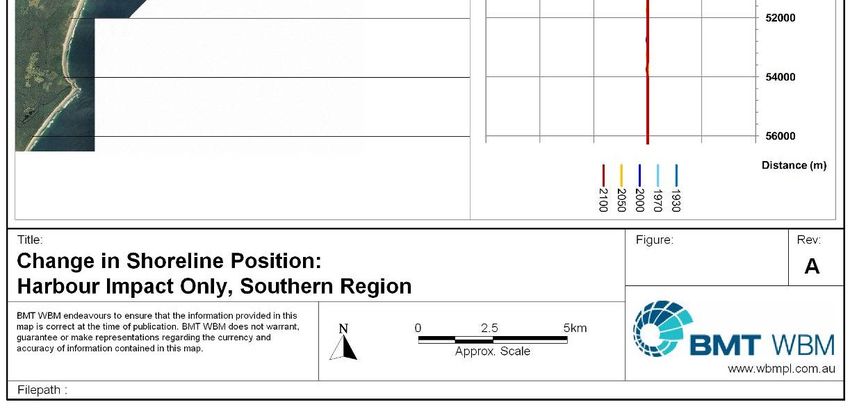
also limit the ability to define the likely shoreline response to a higher sea level and
modified wave climate in the future due to climate change. Once again, new modelling
techniques such as the Shoreline Evolution Model and Shoreline Response Model are
capable of providing predictions of future shorelines in response to climate change.

SBEACH

The Storm-induced BEAch CHange model (SBEACH) is a numerical model developed
in 1989 by the US Army Corps of Engineers for estimating erosion of the beach, berm
and dune by storm waves and elevated water levels. SBEACH is a two-dimensional (in
profile cross section) cross-shore transport model. The erosion of beach to dune is
based on the concept of an equilibrium cross-shore profile occurring during storm
events. The primary application was for the design of volumes for beach nourishment
projects, such as calculating the beach profile response of alternative beach
nourishment designs to storms of varying intensity.

In Australia, it has often been used to estimate the “storm demand” of a single ‘design’
storm event, to form the basis of the beach erosion hazard for subsequent use in
coastal planning. As stated by the model’s developers (Wise, et al., 1996),

  “A fundamental assumption of the SBEACH model is that profile change is
  produced solely by cross-shore processes, resulting in a redistribution of
  sediment across the profile with no net gain or loss of material. Longshore
  processes are considered to be uniform and neglected in calculating profile
  change. This assumption is expected to be valid for short-term storm-induced
  profile response on open coasts away from tidal inlets and coastal structures”

SBEACH is an effective assessment tool for certain applications. However, it has often
been criticised for underestimating storm erosion demand, and this relates to the key
assumptions given above. In the USA, SBEACH is widely reported to have inaccurately
predicted volumes required in beach nourishment projects, underestimating the
volumes required for ongoing programs or the time between subsequent nourishment
operations (e.g. Pilkey, 1994; Libbey et al., 1998). In Australia, the program is also
reported to underestimate potential storm erosion, compared with measured data.

One key reason for such underestimates is that SBEACH does not include longshore
transport in erosion estimates, treating the surfzone as a two-dimensional system.
Longshore processes are a very important component of sediment transport during
short term storm events. For a storm arriving from an oblique direction, the ‘protected’
end of the beach will be eroded as sand is transported alongshore by oblique waves to
build sand bars at the opposing ‘impacted’ end of the beach. This is not represented in
SBEACH storm erosion calculations.

As for other one-line and 2D cross-shore models, SBEACH also cannot represent rip
currents. The landward end of rip currents are often the site of the largest erosion
extents, for example, the highest recorded erosion extent at Wamberal Beach of 240
m3/m after the 1978 storms (NSW Government, 1990).

It is questionable whether SBEACH is an appropriate tool to estimate storm erosion for
planning purposes at beaches, where shoreline change (accretion, erosion, rotation) is
affected by longshore transport processes (regional or within individual embayments)
as well as cross-shore processes, interacting with coastal structures and headlands.

                                                                                      7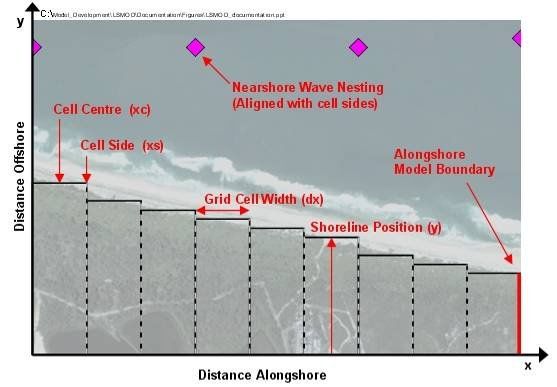
The Bruun Rule (1962)
The Bruun Rule (1962) concept is that the entire beach profile will shift landward and
upward in response to a rise in sea level. The Bruun Rule concept is illustrated in
Figure 1 below.
B
Beach
r Sea Level After Rise
a
Initial Sea level
Initial Bottom Profile
Bottom Profile D
After Sea Level Rise d
Bottom After Sea Level Rise
r = Ba
D
Initial Bottom Limiting Depth Between
Predominant Nearshore
And Offshore Material
Figure 1 Bruun Rule for Shoreline Response to Rising Sea Level
Shoreline recession predicted by the Bruun Rule is given by:
Ba
r=
D
where a (metres) is the sea level rise, B (metres) is the width of the bottom influenced
by the sea level rise extending to d (metres), where d is the depth of closure or offshore
limit of transport, and D (metres) is the depth to closure including the dune height. Both
B and D can be calculated from the nearshore profile once d is known.
As cited in Ranasinghe et al. (2007), it is generally agreed by the scientific community
that the Bruun Rule concept of a landward and upward shift in cross shore profile in
response to sea level rise is valid. However, Figure 1 illustrates the problem with this
approach in that it depends substantially on how the changes at the depth of closure
are dealt with. The extent of recession calculated with the Bruun Rule (and various
modifications to the equation) has not been successfully validated. The Bruun Rule is
at best an ‘order of magnitude’ estimate, as there are very few coastlines at which
longshore transport and structures can be ignored to satisfy the key assumption of a
cross-shore profile response only (Ranasinghe et al., 2007). DECCW (2010) note that
the Bruun Rule should be considered a ‘coarse, first-order approximate’.
The limitations of the Bruun Rule as summarised from Ranasinghe et al. (2007) are
outlined below.
The Bruun Rule does not include three dimensional variability, as it assumes
two-dimensional (cross-shore) sediment movement only, therefore, the rule
does not include alongshore gradients in longshore transport (such as a
regional transport rate); alongshore features or structures such as headlands,
engineering structures and nearshore reefs that control the shoreline shape due
8to their impact upon sediment transport; or estuaries/inlets which may act as
both source and sink for sediments in the nearshore zone.
The Bruun Rule is only applicable on ‘equilibrium’ beach profiles, that is, it is not
applicable at beaches where there is ongoing profile change (for example, the
profile is still evolving to the most recent rise/fall in sea level, or change in
sediment supply)
The Bruun Rule assumes there is no sediment movement (such as offshore
sediment loss) seaward of the depth of closure
The Bruun Rule does not allow for a majority of fine sediments in the dune,
which when eroded would be too fine to deposit and remain in the nearshore,
and it does not allow for variations in sediment between the nearshore, beach
berm and dune.
Hallermeier (1981, 1983)
A key input to the Bruun Rule is the depth of closure term, which is defined as the
depth at which exchange of sediment between the nearshore and offshore is effectively
zero. That is, the depth of closure is said to be the limit of nearshore sediment transport
processes. Where nearshore bathymetry is not available to calculate the depth of
closure, one method commonly used to estimate the depth of closure are the
Hallermeier equations (1981, 1983). Thus, the Hallermeier equation does not add to or
enhance the Bruun Rule concept, but provides an input to that equation.
Hallermeier depicts a shore normal beach profile in terms of three regions separated by
two depth values, ds that defines the depth limit of the littoral zone and d0 that defines
the depth beyond which shore normal sand transport processes may be considered
negligible. Typically the latter term is the depth of closure value applied in the Bruun
Rule. Inputs to the Hallermeier equations include local offshore wave climate (annual
average significant wave height and wave period, 1 year recurrence interval 12 hour
duration wave height), median sediment grain size, specific gravity of the sediment and
acceleration due to gravity.
The need to estimate the depth of closure, such as with the Hallermeier equation, adds
an additional factor of potential error in estimates with the Bruun Rule.
The Shoreline Evolution Model – A New Technique to Predict Recession due to
Sea Level Rise
A Shoreline Evolution Model (SEM) has been developed by Dean Patterson (BMT
WBM). The model has the capability to simulate short to geological time-scale coastline
evolution including minor to major sea level change (0 to 100 m). Patterson developed
the Shoreline Evolution Model as part of his current PhD studies investigating
Pleistocene to Holocene evolution of the Far North Coast of NSW. It uses a quasi-2D
extension of the conventional one-line shoreline representation to include cross-shore
as well as longshore sand transport. A schematic of the model domain is given in
Figure 2.
The effects of coastal structures such as headlands, nearshore reefs, groynes and
seawalls are included. These processes and factors, together with the assumption of
maintenance of an equilibrium shape to the upper beach and dune over the longer term
are used to predict the shoreline response to sea level rise (Patterson, 2009).
9The SEM uses a time stepping approach to drive shoreline evolution in response to
deep water wave time series data and sea level. The model internally refracts waves
from deep water into the near shore zone and calculates longshore sand transport at
each longshore grid location using the standard longshore transport equation of CERC
(1984).
The model is particularly effective at a regional scale, able to model multiple beach
units along long coastlines. The model provides for shoreward sand transport and
profile evolution below the depth of closure and accounts for cross-shore exchange of
sand into and from the active upper beach zone above the depth of closure. The
exchange is initiated by changes in the profile slope as the profile evolves, as shown in
Figure 3.
The SEM allows input of variable back-barrier dune levels, important where sea level
rise causes roll-back of the dune system, thus incorporating their effect on shoreline
recession. As a result, it offers substantial advantages over the simple Bruun Rule
(1962) for typical beaches along the NSW coastline.
By comparsion, the Bruun Rule will grossly under-estimate the potential for erosion at
the southern ends of beach units with northward net longshore sand transport. An
example of this at Coffs Harbour is given in Figure 4. As the sea level rises, headlands
act to trap northerly sediment transport within each embayment, with the southern end
of each beach starved of its full longshore supply. The southern end of each beach unit
thus experiences enhanced recession. In contrast, the supply from the southern end of
the beach is trapped by the bounding northern headland, reducing shoreline recession
due to sea level rise at the northern ends of beaches.
The model caters for the impact of sea level rise upon shorelines in the lee of reefs.
Sea level rise will tend to submerge reefs that are close to the current sea level and
allow greater wave impacts at the shoreline in lee of the reef. This will lead to
enhanced erosion of salients and reef-protected shorelines. Once again, the Bruun
Rule cannot account for this structural effect from sea level rise.
The model can be used to assess the impact of coastal works such as structures
(groynes, training walls and seawalls) and beach nourishment on sandy shorelines with
or without sea level rise. For example, the model was used to investigate the impact of
the harbour breakwaters at Coffs Harbour on updrift and downdrift beaches over the
last century. Outputs from the model as given in Figure 5 illustrate the extensive
accretion upon Boambee Beach updrift of the harbour. Downdrift of the harbour, the
shoreline recedes, initially at Park Beach and sequentially at beaches further
northwards over time. The erosion at Park Beach is limited by bounding headlands,
progressively transferring the impacts to beaches further north, to meet the longshore
supply of the shoreline. At the same time, Boambee beach continues to accrete until
the shoreline has built out to such a level that bypassing of the harbour may
commence. The model results were compared against the photogrammetric data at
Boambee and downdrift beaches such as Park Beach, Campbells Beach and Sapphire
Beach. The model results showed good agreement with the historical data. The model
results suggested the impacts to Park Beach have slowed in recent years, while
harbour impacts continue to migrate north and are beginning to impact upon Moonee
Beach. The photogrammetry data confirmed these trends.
A key capability of the SEM is the ability to investigate the impacts of sea level rise in
combination with the harbour structure. This is demonstrated in Figure 6. The rise in
sea level tends to ‘re-initiate’ the harbour impact to the downdrift coastline. Thus,
greater extents of erosion occur at Park Beach than can be predicted with the Bruun
Rule alone. As such, The SEM provides a significant advance on the Bruun Rule
10(1962) in predicting shoreline recession due to sea level rise and structural features, as
it is able to account for the three dimensional nature of the coastline.
Y
Shoreline
Cross-shore
increments (dx) Wave refraction
(Input intermediate depth
Groynes contour alignments)
X
Reefs / Headlands
Cross-shore
Seawalls transport
Longshore Breakwaters / Islands
increments (dy)
Longshore
transport
Figure 2 Plan View Schematisation of Shoreline Evolution Model
Domain
Z
Shoreline recession Dd X
Dcl
‘closure’ depth
Slope change induces
cross-shore transport
Z
Shoreline advance X
‘closure’ depth
Increasing depth of
toe of deposition
Figure 3 Cross-shore Profile View of Shoreline Evolution Model
Domain for Erosion (top) and Accretion (bottom)
11Figure 4 Recession due to Sea Level Rise Only with the
Shoreline Evolution Model, Southern Coffs Coastline
12Figure 5 Recession due to the Coffs Harbour Structure (without
Sea Level Rise) with the Shoreline Evolution Model, Southern Coffs
Coastline.
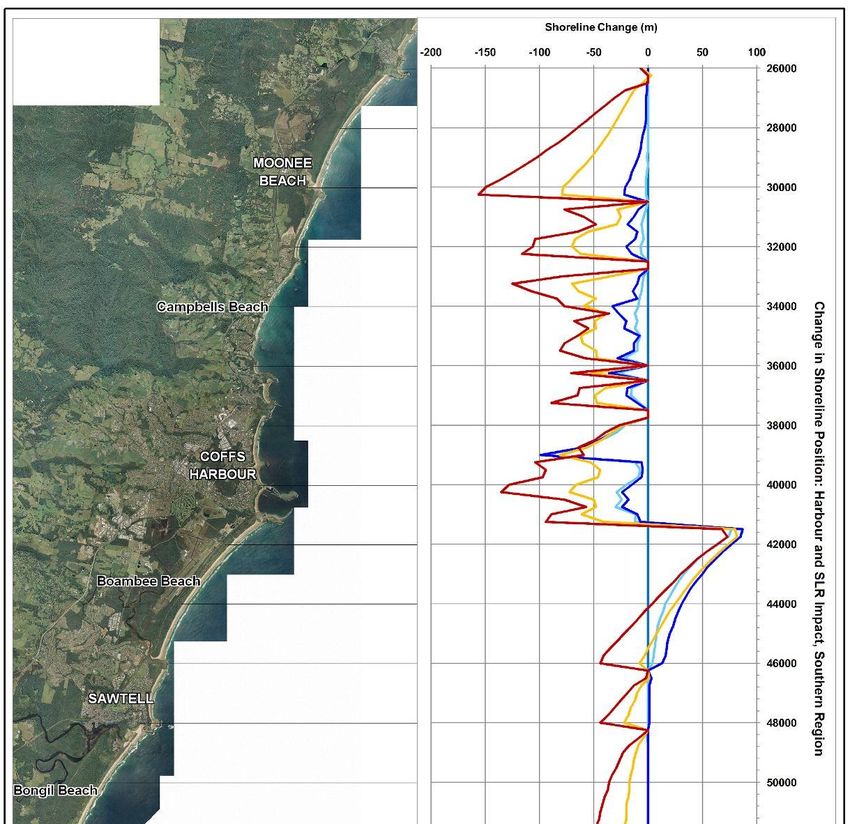
13Figure 6 Recession due to the combined impact of Sea Level
Rise and Coffs Harbour, Southern Coffs Coastline
14The Shoreline Response Model (SRM) – A New Technique to Predict Recession
and Erosion due to Wave Climate Change and Sea Level Rise
BMT WBM’s Chris Huxley, in association with DECCW developed the Shoreline
Response Model (SRM) (Huxley, 2010), which predicts shoreline response to the
combined impact of wave climate variability (height, direction) and sea level rise under
a future climate. This model is able to estimate the change in shoreline width and
orientation, by calculating both the longshore and cross shore sediment transport in
response to wave height, wave direction and water level, including sea level rise.
The SRM is the first model of its kind to combine both longshore and cross shore
sediment transport processes to estimate the response of the beach (erosion and
rotation) to the combined impact of short term storm events, long term wave height and
direction change and sea level rise. The model is able to simulate shoreline response
for hourly events (storms) as well as shoreline evolution over 100 years. Figure 7 and
Figure 8 show schematic representations of the cross-shore and longshore model
domains which form the basis of the SRM model.
The model uses a time-stepping approach to predict shoreline change resulting from
changes in both the cross shore and longshore sediment transport. On an hourly
timestep, the model uses water level (tide, surge and sea level rise) and wave input
(significant wave height, period and direction) to calculate shoreline response due to
both cross shore and longshore sediment transport processes (Huxley, 2009). The
dynamic linking of the cross shore and longshore sediment transport processes results
in a useful modelling tool, well suited to the assessment of climate change impacts
resulting from the combined impact of both sea level rise and wave climate.
Figure 7 Cross-shore Profile View of Shoreline Response Model
Domain
15Figure 8 Plan View Schematisation of Shoreline Response Model
Domain
The SRM is capable of predicting shoreline response (particularly beach erosion and
shoreline recession) to climate change driven forcings, most importantly (Huxley,
2009):
Sea level rise;
Changes in wave direction;
Changes in swell wave height; and
Changes in storm wave height and occurrence.
An assessment of the shoreline response to changes in the above forcings at Wooli
Wooli Beach (NSW North Coast) and Batemans Bay (NSW South Coast) has been
completed using the SRM model as part of the DECCW funded NSW Coastal Zone
Climate Change Impact Study. Figure 9 to Figure 11 present some of the historic and
climate change shoreline response assessment results from the Wooli Wooli Beach
Assessment.
Further validating the shoreline response trends shown in Figure 6 for the Coffs
Harbour coastline using the SEM, the Wooli Wooli Beach assessment indicates that
shoreline response to sea level rise for littoral drift dominated coasts (northern NSW) is
non-uniform alongshore. The results indicate that beach sections immediately downdrift
from major headland/groyne controls are likely to experience the greatest shoreline
recession due to climate change induced sea level rise. For Wooli Wooli beach this
results in increased shoreline recession at the southern end of the beach unit. These
results highlight the need for detailed assessment of the impact of climate change
accounting for combined cross-shore/longshore sediment transport processes.
16100
Output Location 1
50 Output Location 2
Output Location 3
Dune Volume (m3 above 0mAHD)
0
-50
-100
-150
-200
-250
-300
Jan00 Jan02 Jan04 Jan06 Jan08
Time (Date)
Figure 9 Historic Shoreline Responce Assessment Results:
Dune Volume – Wooli Wooli
Figure 10 Varied Wave Climate/ Sea Level Rise Shoreline Response
Results – Wooli Wooli Beach
1720
0
-20
Shoreline Change(m)
-40
-60
Note: 100 Year Wave Time Series
Synthesisied From 8 Years of
Recorded Cape Byron Wave Data
-80 Output Location 1
Including 100 Year Design Storm at
2030, 2070 and 2100 Planning Output Location 2
Horizons Output Location 3
-100
2000 2010 2020 2030 2040 2050 2060 2070 2080 2090 2100
Time (Year)
Figure 11 Sea Level Rise Scenario Only Assessment Results:
Shoreline Position – Wooli Wooli
Accounting for Uncertainty in Shoreline Change Assessments
The coastal zone is highly complex with many processes interacting independently and
dependently to various extents. Science is improving, but not yet able to represent all
of these processes. Climate change adds further to the uncertainty in assessing
coastal hazards, with uncertainty not only in projections for sea level and wave climate,
but in the extent and timeframe of impacts this may have in the coastal zone.
Given this complexity, assumptions are made and variables excluded in order to
develop models, or to assess empirical data. Therefore, the results from any
assessment technique are an estimate, not an absolute outcome. Modelling is a tool to
assist in our understanding of coastal processes, and should be used to augment
rather than replace real data. Model results need to be consistent and verifiable against
measured data that describes the physical constraints of coastal processes and
geomorphology.
While councils are urged to use the best available information and techniques, there
must be transparency as to the assumptions, accuracy and certainty of predictions
made, in order to support sound decision making.
Within a risk-based approach to coastal management, the certainty of hazards
estimates should be described in terms of the likelihood of the hazard impact.
Description of likelihood of hazard impact should indicate the limitations of the data
(e.g. accounting for storm periods not captured by the data) and assumptions used to
estimate the hazard (e.g. accounting for model assumptions regarding cross-shore or
18longshore transport). The likelihood of hazards forms one component of assessing the
risk from coastal hazards. Consequences from hazards are not dependent upon the
assessment techniques used for hazards, but rather, the people / land affected when
the hazard does occur.
The risk assessment framework has now been endorsed for use in coastal
management with the CZMP Guidelines and various other NSW coastal management
guideline documents.
Conclusions
There are a number of assessment techniques available for conducting beach erosion
and recession estimates for use in coastal planning. Councils are given exemptions
from liability where coastal management actions are undertaken in ‘good faith’, under
the Coastal Protection Act 1979. Councils need to be cognisant of the latest
techniques available for assessing coastal hazards, in order to provide the best
available information on which to base management responses and thereby limit their
future liability.
A review of techniques commonly used in the past in NSW indicates that fundamental
assumptions limit the predictive capacity of such techniques for coastal hazard
definition. In particular, the Bruun Rule is not able to account for regional longshore
transport and wave climate interactions with headlands, breakwaters and other
structural features of the coastline in predicting recession due to sea level rise.
SBEACH ignores longshore sediment transport and coastal structures, resulting in a
reduced or incomplete estimate of storm erosion. Empirical approaches with
photogrammetry are typically limited by data availability over time and along a beach,
and are limited to predict impacts from events that have not been recorded in the past,
such as sea level rise and climate change induced wave climate change.
Two new modelling tools have been developed that provide superior predictive
capacity over previous techniques.
The Shoreline Evolution Model of Patterson (2009) provides a powerful tool with which
to investigate the likely response of regional coastlines to sea level rise where
structural features such as headlands and reefs interact with wave climate driven
longshore processes. In particular, the model demonstrates that as the sea level rises,
existing headland features increasingly act as a barrier to northerly sediment transport,
which starves the southern ends of the beaches in lee of the headlands. The result is
enhanced recession at the southern end and reduced recession at the northern end of
beaches, compared with Bruun Rule estimates.
The Shoreline Response Model of Huxley (2010) is capable of estimating recession
due to sea level rise and wave climate change (e.g. due to climate change) together
with erosion during storms and subsequent beach re-accretion, over a 100 year period.
The SRM calculates combined longshore and surfzone cross shore transport, providing
a much improved estimate of beach response to storms. For individual beach units this
offers a powerful tool to investigate shoreline change under a future climate.
References
Bruun, P. (1962). Sea-level rise as a cause of shore erosion, Journal of Waterways and
Harbors Division, American Society of Civil Engineers, 88, 117-130.
19CERC (1984). Shore Protection Manual. Coastal Engineering Research Center [CERC]
U.S. Army Corps of Engineers, Washington, D.C.
Cowell, P.J., Thom, B.G., Jones, R.A., Everts, C.H., and Simanovic, D. (2006).
Management of Uncertainty in Predicting Climate-Change Impacts on Beaches,
Journal of Coastal Research, 22, 232-245
DECCW (2010). Draft Guidelines for preparing Coastal Zone Management Plans, NSW
Department of Environment, Climate Change and Water, August 2010.
Gordon, A.D. (1987). Beach Fluctuations and Shoreline Change - NSW, reprints of
Papers, 8th Australasian Conference on Coastal and Ocean Engineering, 30
November to 4 Dec, Institution of Engineers Australian National Conference Publication
No 87/17 pp 103-167
Hallermeier, R.J. (1981). A profile zonation for seasonal sand beaches from wave
climate, Coastal Engineering, 4, 253-277.
Hallermeier, R.J. (1983). Sand transport limits in coastal structure design, Proceedings
of Coastal Structures ’83, ASCE, pp. 703-716.
Hanslow, D.J. (2007). Beach Erosion Trend Measurement: A Comparison of Trend
Indicators, Journal of Coastal Research SI 50 (Proceedings of the 9th International
Coastal Symposium), 588 – 593. Gold Coast, Australia.
Huxley, C. (2009). Shoreline Response Modelling Assessing the Impacts of Climate
Change, Proceedings of the 18th NSW Coastal Conference , 3 – 6 November 2009,
Ballina.
Huxley, C. (2010). Quantification of the Physical Impacts of Climate Change on Beach
Shoreline Response, Master of Philosophy, School of Engineering, Civil Engineering
University of Queensland.
Libbey, L.K., McQuarrie, M.E.., Pilkey, O.H., Rice, T.M., Sampson, D.W., Stutz, M.L.
and Trembanis, A.C. (1998). Another View of the Maturity of Our Science, Discussion
in Shore & Beach 4 p.
NSW Government (1990), Coastline Management Manual, September 1990
Patterson, D. (2009). Modelling the Shoreline Impacts of Richmond River Training
Walls, Proceedings of the 18th NSW Coastal Conference, 3 – 6 November 2009,
Ballina.
Pilkey, O.H. (1994). Mathematical Modelling of Beach Behaviour Doesn’t Work, Journal
of Geological Education, 42, pp 358-361.
Ranasinghe, R., Watson, P., Lord, D., Hanslow, D. and Cowell, P. (2007). Sea Level
Rise, Coastal Recession and the Bruun Rule, Proceeedings of the 18th Australasian
Coastal and Ocean Engineering Conference.
Van Drie, R., Milevski, P., and Simon, M. (2010). Rapid Climate Change Assessment
Tool: ANUGA, Show Me The Hazard!, Draft Paper, 12 p.
Wise, R.A., Smith, S.J. and Larson, M. (1996). SBEACH: Numerical Model for
Simulating Storm-Induced Beach Change, Report 4, Cross-Shore Transport Under
Random Waves and Model Validation with SUPERTANK and Field Data, prepared for
US Army Corps of Engineers, CERC-89-9 rept. 4., 266 p.
20You can also read