Transition from continental rifting to oceanic spreading in the northern Red Sea area
←
→
Page content transcription
If your browser does not render page correctly, please read the page content below
www.nature.com/scientificreports
OPEN Transition from continental
rifting to oceanic spreading in
the northern Red Sea area
Sami El Khrepy1,2, Ivan Koulakov3,4,5*, Taras Gerya6, Nassir Al‑Arifi1, Mamdouh S. Alajmi7 &
Ayman N. Qadrouh7
Lithosphere extension, which plays an essential role in plate tectonics, occurs both in continents (as
rift systems) and oceans (spreading along mid-oceanic ridges). The northern Red Sea area is a unique
natural geodynamic laboratory, where the ongoing transition from continental rifting to oceanic
spreading can be observed. Here, we analyze travel time data from a merged catalogue provided
by the Egyptian and Saudi Arabian seismic networks to build a three-dimensional model of seismic
velocities in the crust and uppermost mantle beneath the northern Red Sea and surroundings. The
derived structures clearly reveal a high-velocity anomaly coinciding with the Red Sea basin and a
narrow low-velocity anomaly centered along the rift axis. We interpret these structures as a transition
of lithospheric extension from continental rifting to oceanic spreading. The transitional lithosphere is
manifested by a dominantly positive seismic anomaly indicating the presence of a 50–70-km-thick and
200–300-km-wide cold lithosphere. Along the forming oceanic ridge axis, an elongated low-velocity
anomaly marks a narrow localized nascent spreading zone that disrupts the transitional lithosphere.
Along the eastern margins of the Red Sea, several low-velocity anomalies may represent crustal zone
of massive Cenozoic basaltic magmatism.
The transition from continental rifting to oceanic spreading is a crucial yet partly enigmatic stage that determines
the birth and further evolution of an oceanic basin. This transition has been broadly investigated using two
dimensional (2D) and three-dimensional (3D) numerical geodynamic models. Both abrupt and gradual lith-
ospheric extension has been suggested depending on the initial thermal-rheological structure of the continental
lithosphere1–5. However, direct geophysical observations of the evolution of deep lithospheric structures are rare
because of the limited availability of appropriate transitional settings and logistical problems. Among the most
spectacular sites on Earth where such a transition can be directly observed is the Red Sea basin, particularly, its
northern part where different stages of the process are simultaneously active. More than 50 years of multidiscipli-
nary research6–8 (see also the overview in the supplement) has produced a comprehensive geological-geophysical
database of the Red Sea region that enables testing of geodynamic hypotheses. However, previous geophysical
studies did not provide sufficient spatial resolution for the deep lithospheric structures beneath the Red Sea to
corroborate or disprove the existing concepts and test predictions from numerical geodynamical models.
The Red Sea is part of the large “Afro-Arabian rift system” that propagates from the Dead Sea to Mozambique9
and is considered among the youngest oceanic spreading zones in the world. It has formed as a result of the
northeast displacement of the Arabian Plate with respect to the African P late10 with the relative divergence vary-
11,12
ing from 10 to 16 mm/year . The opening of the Red Sea began approximately 30 Ma because of the rupture of
the Arabian–Nubian Shield, which may have been triggered by flood basalt volcanism caused by the Afar plume
impingement on the non-uniformly stressed continental lithosphere4,7,13.
The opening of the southern part of the Red Sea (to the south of 20°N) presently occurs in the form of oceanic
spreading7. Clearly identified linear magnetic anomalies around a distinct axial trough indicate that oceanic crust
has developed here for at least 5 M a8,14–16. However, in the northern half of the Red Sea, the lithospheric extension
time is shorter and the extensional mechanism is not completely understood. The axial trough is not as clear here
1
Natural hazards and mineral resources chair, Geology and Geophysics Department, King Saud University,
P.O. Box 2455, Riyadh 11451, Saudi Arabia. 2Seismology Department, National Research Institute of Astronomy
and Geophysics (NRIAG), Helwan 11421, Egypt. 3Trofimuk Institute of Petroleum Geology and Geophysics SB
RAS, Prospekt Koptyuga, 3, Novosibirsk, Russia 630090. 4Novosibirsk State University, Pirogova 2, Novosibirsk,
Russia 630090. 5Institute of Volcanology and Seismology FEB RAS, Piip Boulevard, 9, Petropavlovsk‑Kamchatsky,
Russia 693006. 6Department of Earth Sciences, ETH Zurich, Sonneggstrasse 5, 8092 Zurich, Switzerland. 7King
Abdulaziz City of Science and Technology, Riyadh, Saudi Arabia. *email: ivan.science@gmail.com
Scientific Reports | (2021) 11:5594 | https://doi.org/10.1038/s41598-021-84952-w 1
Vol.:(0123456789)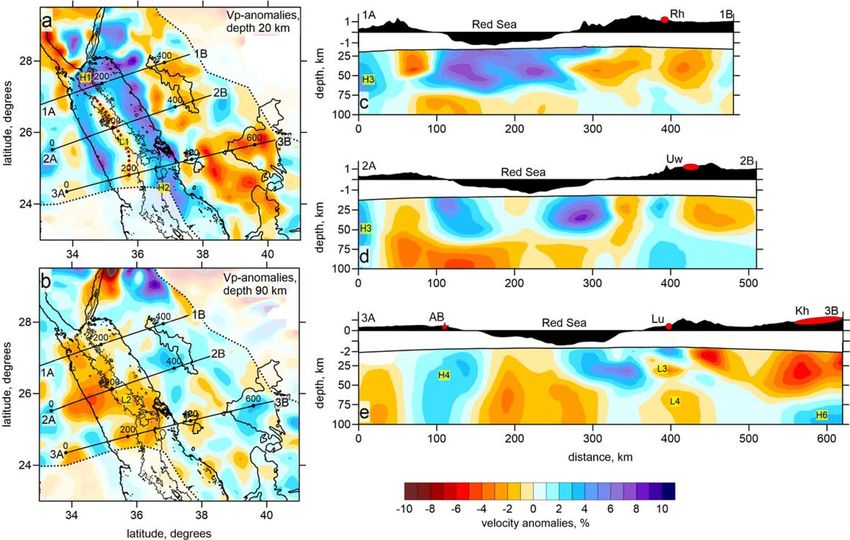
www.nature.com/scientificreports/
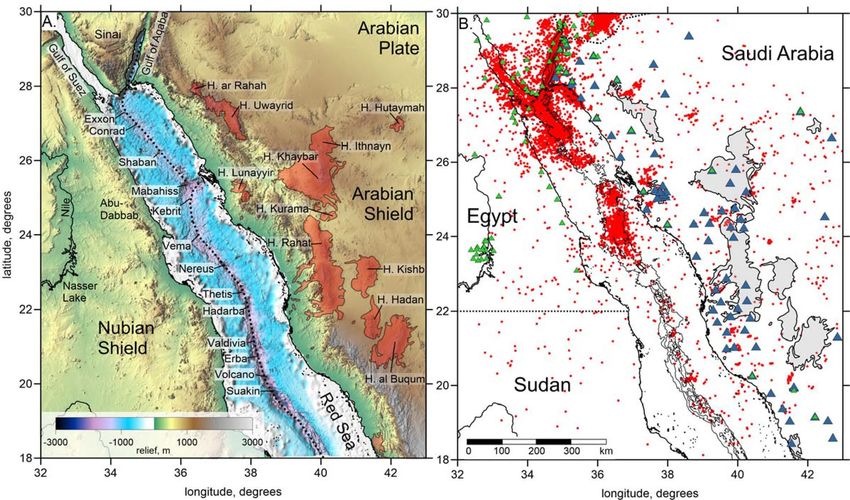
Figure 1. (A) Topography in the study area (http://www.marine-geo.org). Red areas highlight the Harrats
(Cenozoic basaltic fields); the dotted line indicates the axis of the Red Sea spreading/rifting. The names of the
major deeps (depression points) in the Red Sea are shown. (B) Distribution of data used in this study: red points
are events, blue triangles are Saudi Arabian stations, and green triangles are Egyptian stations and stations
reporting to the ISC that were used in the previous tomographic s tudies21,22. Dotted lines indicate political
boundaries. The images have been produced using the Surfer Golden Software 13 (https://www.goldensoftware.
com/products/surfer).
as it is in the southern part6 and it forms a series of discrete depressions termed “deeps,” some of which are shown
in Fig. 1A. No clear linear magnetic anomalies can be identified in the northern Red Sea to the north of 22°N
6,8,16
, which can be interpreted as evidence of continental extension. On the other hand, the crust in this part of
the basin appears to be composed of a complex alternation of gabbroic and basaltic dikes, some of which have
deep mantle origin and no continental crust contamination17. Furthermore, the estimated volume of the crustal
material forming the Red Sea depression appears to be larger than the value following from the reconstruction
based on correlating geological structures on the African and Arabian s ides18. This means that some new crust
needs to appear in some manner to satisfy this balance. Thus, both mechanisms of continental crust extension
(i.e., stretching and faulting) and magmatic additions may occur in the northern Red Sea; therefore, it represents
a unique case of a transition from rifting to spreading. The same conclusion follows from the analysis of detailed
bathymetry structures and gravity observations19,20.
In this study, we present a new higher-resolution seismic tomographic model that shows some key lithospheric
structures that were not observed in previous studies and that critically contribute to a better understanding of
the geodynamics of the Red Sea area and lithospheric evolution during the rift to ridge transition.
Data and tomographic inversion
Here, we jointly use the data of the Egyptian and Saudi Arabian networks containing the arrival times of the P
and S waves from regional seismicity, which were never used together in tomography studies. In this research,
we used a dataset with 15,899 regional and local events and correspondingly 111,981 P-wave and 20,157 S-wave
arrival times (Figures S1 to S3 of Supplementary Materials). These data were inverted using the LOTOS c ode21.
A detailed description of the data and the main algorithm workflow is presented in the Supplementary Materials.
The reliability of the model was carefully tested using a series of synthetic tests. We used both a checkerboard
and a model with realistic anomalies similar to those obtained after inversion of the experimental data. The results
of synthetic modeling and additional information can be found in the Supplementary Materials (Figures S4 to
S7). Note that because of lower number data, the resolution of the S-wave model is much poorer. Therefore, for
our interpretation, we mostly used the P-wave model.
The resulting distributions of the P-wave velocity anomalies of the experimental data inversion are shown
in Fig. 2 in two horizontal sections and three vertical profiles. More horizontal sections of this model, as well as
the results for the S-wave velocity model and absolute P-wave velocity in vertical sections, are presented in the
Scientific Reports | (2021) 11:5594 | https://doi.org/10.1038/s41598-021-84952-w 2
Vol:.(1234567890)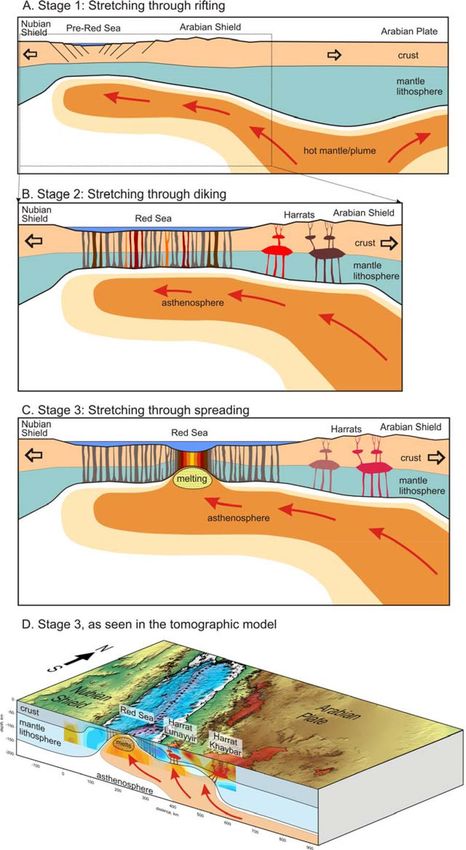
www.nature.com/scientificreports/
Figure 2. P-wave velocity anomalies obtained from tomographic inversion presented in two horizontal
(panels a, b) and three vertical (panels c–e) sections. In the maps, the contours of harrats are shown on the Saudi
Arabian side. Within the Red Sea, the bathymetry is shown with contour lines starting from 1000 m and at an
interval of 500 m. Above each of the vertical sections, the topography/bathymetry along the profile is shown.
The locations of the main harrats are shown in red ellipses as follows: Rh – ar Rahah, Uw – Uwayrid, Lu –
Lunayyir, Kh – Khaybar, and Rt – Rahat. AB is Abu-Dabbab. Dotted lines indicate political boundaries. Letters
in yellow indicate the structures discussed in the text. The images have been produced using the Surfer Golden
Software 13 (https://www.goldensoftware.com/products/surfer).
Supplementary Materials (Figures S8 to S10). The final distribution of the seismicity after five iterations of the
inversion is shown in Fig. 1B.
Discussion
In the tomographic model, beneath the northern Red Sea (to the north of 24°N), we see a prominent high-velocity
anomaly to 50–70 km depth whose shape approximately corresponds to the limits of the basin. A similar anomaly
for the northernmost part of the Red Sea has already been retrieved by other tomographic studies merely based
on the Egyptian n etworks22,23. The novel feature of the present result is an elongated low-velocity anomaly in
the central part of the Red Sea between 24ºN and 27ºN (red dotted line with the indication of L1 in Fig. 2a).
In the deeper sections, below 50 km depth, the negative anomaly beneath the Red Sea widens and is observed
below the entire basin (anomaly L2 in Fig. 2b). At these depths, the high-velocity anomalies are traced as several
distinct patterns mostly beneath onshore areas. In such regional-scale studies, areas of high seismic velocities are
commonly associated with rigid, highly consolidated massifs consisting of igneous or deeply metamorphosed
rocks, whereas the low-velocities are usually interpreted as sedimentary deposits or active magmatic systems
with high temperature and/or melt content.
It is interesting that in areas where the low-velocity anomaly is observed beneath the axial trough, the seis-
micity is relatively weak whereas the maximum seismic activity is observed beneath the northernmost part of
the Red Sea and at approximately 24ºN latitude at the vicinity of the high-velocity anomaly indicated H2. This
irregularity in the seismicity distribution along the Red Sea axis was earlier d iscussed24. It was shown that high
seismic activity corresponds to colder areas where the extending crust behaves in a brittle manner. This seems to
be supported by the results of this study: a seismic gap between 25.5 °N and 26 °N and highly dispersed seismicity
between 26 °N and 26.5 °N with earthquake magnitudes rarely exceeding 4 25 correspond to low-velocity areas
in the tomographic model along the rift axis (anomaly L1 in Fig. 2a), which may mark high-temperature zones
where the ductile extension of the hot crust occurs. Alternatively, the extension in this segment may occur by
dike intrusion rather than normal faulting, which could result in a net decrease in seismic moment release. Such
mechanism was earlier proposed in the context the Afar e xtension26–28.
Scientific Reports | (2021) 11:5594 | https://doi.org/10.1038/s41598-021-84952-w 3
Vol.:(0123456789)www.nature.com/scientificreports/
Figure 3. Schematic representation of three stages of extension of the transition from continental rifting to
oceanic spreading (panels A–C). The interpretation in panel (D) is based on the results of seismic tomography
obtained in this study. See details in the text. The images have been created in Corel Draw (coreldraw.com).
In another segment of the axial rift located in the southern part of our study area between the latitudes of
23ºN and 25ºN indicated with H2, the observed high velocity anomalies may characterize cold zones, where
brittle crust deformation produces considerable seismicity.
Based on the tomographic results, we propose that in the Red Sea area, we may observe gradual lithosphere
reworking due to extension and initiation of the spreading zone, as schematically shown in Fig. 3. Before the
opening of the Red Sea, between the divergent Arabian and Nubian plates, the lithosphere extension occurred
through continuous stretching of continental crust (Stage 1 in Fig. 3A). The extension primarily occurred in a
zone where the lithosphere was softened by the presence of hot asthenosphere that arrived either from the Afar
Plume29 or from an overheated area beneath the central part of the Arabian P late30. In this case, the continental
crust was gradually thinned by normal faulting, as observed in other continental rifts.
In a case of the presence of hot asthenospheric material beneath extended lithosphere, as has been presumed
beneath the western margin of the Arabian Plate, further extension of the continental lithosphere may trigger
intrusions of the mantle-originated magma into the c rust31 (Stage 2 in Fig. 3B). In this case, the lithosphere
stretching due faulting and dike intrusion can occur synchronously, as supported by an evidence that extension
was kick started by a phase of intrusions around ~ 25 Myrs ago13. Thick continental and thin transient lithosphere
in this case behave differently. In the thicker lithosphere, as beneath the western margin of the Arabian Plate, the
intrusions create a series of multi-level magma reservoirs that episodically lead to eruptions of massive basaltic
fields, i.e. Harrats. For the extended thinner lithosphere, as within the Red Sea basin, the asthenospheric mate-
rial creates a series of dikes propagating throughout the lithosphere that accommodate extension. Note that the
Scientific Reports | (2021) 11:5594 | https://doi.org/10.1038/s41598-021-84952-w 4
Vol:.(1234567890)www.nature.com/scientificreports/
emplacement of a dike releases local tensile crustal stresses making the respective crustal region not suitable for
further fracturing. Therefore, the further extension of the lithosphere is accommodated by dikes emplacement in
others more stressed parts of the l ithosphere32. This explains why the dikes in the transient lithosphere uniformly
affect the entire basin and are not localized in one narrow zone. After some time, these dikes composed of frozen
igneous rocks change the effective integral properties of the lithosphere, making it fundamentally different from
the stretched continental lithosphere. In the tomographic model of the current study (Fig. 2a), this transitional
lithosphere appears as a high-velocity anomaly observed at shallow sections. We see that the coastal line of the
Red Sea corresponds to a sharp transition from low velocity beneath the onshore areas to high velocity offshore
without any gradual transition. This is particularly clear for the northern Red Sea area ("Introduction" section
in Fig. 2) where the offshore lithosphere is uniformly high-velocity (anomaly H1 in Fig. 2a).
The third stage of the lithosphere stretching (Fig. 3C) presumes breaking of the lithosphere in a localized
area and then further development of oceanic spreading. Possible interpretation of the derived distributions
of the P-wave velocity anomalies in Sect. 3, which correspond to this extensional stage, is schematically shown
in Fig. 3D. Spreading in the Red Sea is evidenced by the presence of the elongated low-velocity anomalies L1
(Fig. 2a) coinciding with the line of “deeps” along the axial part of the Red Sea. This low-velocity zone along the
axial trough represents the hot partially molten asthenosphere that has ascended immediately below the spread-
ing center. Note that the southernmost part of the anomaly L1 deviates westward from the through axis. This may
indicate that the lithosphere fracturing in this zone avoids ductile high-temperature zones and primarily occurs
in colder brittle lithosphere associated with high-velocity anomaly H2 and high seismicity.
The high-velocity anomalies along the opposite sides of the Red Sea basin represent the oceanic–continental
transitional mantle lithosphere perturbed by a system of mafic dykes. These lithosphere segments appear to be
not symmetrical. As we see in the vertical sections in Fig. 2, the lithosphere in the eastern flank of the Red Sea
does not exceed 40 km in thickness, whereas beneath the Egyptian coast it appears much thicker. In the northern
part of the Red Sea basin, the mantle lithosphere may be up to 50–70 km thick.
Based on the new tomography model, we can conclude that within the study area, a transition between two
different mechanisms of rift basin opening exists: in the northern part, we propose an extension due to dispersed
diking throughout the entire basin of the Red Sea (Scheme 2 in Fig. 3B), whereas in the southern part, most of
extension is thought to be accommodated in a narrow zone of initiated spreading (Scheme 3 in Fig. 3C). This
transition might be associated with a variable extension rate along the Red Sea, which is caused by the fact that
the Arabian plate is rotating anticlockwise with an Euler pole somewhere in the Mediterranean Sea and this
results in a decreasing spreading rate from the south to north of the Red Sea.
To understand tectono-magmatic processes leading to the formation of the transitional lithosphere, we ana-
lyzed the results of previously published numerical models of the rifting to spreading transition3, in which
dynamics of magma addition to the lithosphere was simulated. The asymmetry of the lithospheric extension
in the northern Red Sea area suggests the existence of rheologically decoupled continental lithosphere with a
weak lower crust that greatly affects mantle melting and crustal growth d ynamics2,3 (Fig. 6 in Liao and G
erya3).
Compared to stronger and more symmetrical rheologically coupled models, decoupled lithosphere extension is
characterized by a distinct transient period of enhanced mantle melting and related magmatic crustal growth.
During this period, lithospheric extension can likely be dominated by magmatic (e.g., dike emplacement) rather
than tectonic processes (a high-M regime, where M is the proportion of magmatic vs. tectonic e xtension33. As
a result, a transitional, predominantly magmatic lithosphere can form as imaged in the high seismic velocity
anomaly of the northern Red Sea area. During a later stage, localization of lithospheric extension produced an
incipient oceanic ridge that disrupted the transitional lithosphere and formed a linear negative seismic velocity
anomaly via localized upwelling and decompression melting of the upper mantle (Fig. 3C and D).
Conclusions
We have constructed a 3D seismic model of the lithosphere and uppermost mantle beneath the Red Sea and
surrounding areas based on a merged dataset containing P- and S-wave arrival times from regional seismicity
provided by Egyptian and Saudi Arabian seismic networks. For the Red Sea basin, we have achieved a better reso-
lution compared to the cases when the data of these networks were separately used. The derived seismic model
resolves the lithospheric structure during the ongoing transition from continental breakup to oceanic spreading.
In the Red Sea basin, particularly in its northernmost part, we observed a pronounced high-velocity anomaly. A
sharp transition from low to high velocity along the Red Sea’s coastline may disprove the mechanism of gradual
stretching of the continental crust during passive rifting. The results of this study may show that the crust in the
northernmost Red Sea is principally different from the regular continental crust and represents a transient type
of lithosphere strongly affected by dike intrusions. The linear low-velocity anomaly along the axial trough of the
northern Red Sea shows a zone of spreading initiation causing asthenospheric ascent.
Data availability
The full directory with data and program codes to reproduce the results presented in this paper can be down-
loaded from Zenodo. http://doi.org/10.5281/zenodo.4482096. This compressed file includes a Read_Me.pdf file
with detailed guidelines on how to perform the calculations.
Received: 13 September 2020; Accepted: 8 February 2021
Scientific Reports | (2021) 11:5594 | https://doi.org/10.1038/s41598-021-84952-w 5
Vol.:(0123456789)www.nature.com/scientificreports/
References
1. Huismans, R. S. & Beaumont, C. Symmetric and asymmetric lithospheric extension: relative effects of frictional-plastic and viscous
strain softening. J. Geophys. Res. 108, 1–13 (2003).
2. Huismans, R. & Beaumont, C. Depth-dependent extension, two-stage breakup and cratonic underplating at rifted margins. Nature
473, 74–79 (2011).
3. Liao, J. & Gerya, T. From continental rifting to seafloor spreading: insight from 3D thermo-mechanical modeling. Gondwana Res.
28(4), 1329–1343 (2015).
4. Koptev, A., Gerya, T., Calais, E., Leroy, S. & Burov, E. Afar triple junction triggered by plume-assisted bi-directional continental
break-up. Sci. Rep. 8(1), 14742 (2018).
5. Brune, S. Evolution of stress and fault patterns in oblique rift systems: 3-D numerical lithospheric-scale experiments from rift to
breakup. Geochem. Geophys. Geosyst. 15, 3392–3415. https://doi.org/10.1002/2014GC005446 (2014).
6. Rasul, N.M., Stewart, I.C. & Nawab, Z.A. Introduction to the Red Sea: its origin, structure, and environment. In The Red Sea 1–28
(Springer, Berlin, Heidelberg, 2015).
7. Cochran, J. R. Northern Red Sea: nucleation of an oceanic spreading center within a continental rift. Geochem. Geophys. Geosyst.
(G3) 6(3) 34, Q03006. https://doi.org/10.1029/2004GC000826 (2005).
8. Almalki, K. A., Betts, P. G. & Ailleres, L. The Red Sea–50 years of geological and geophysical research. Earth Sci. Rev. 147, 109–140
(2015).
9. Khan, M. A. The Afro-Arabian rift system. Sci. Prog. 62(246), 207–236 (1975).
10. Stern, R. J. & Johnson, P. Continental lithosphere of the Arabian Plate: a geologic, petrologic, and geophysical synthesis. Earth-Sci.
Rev. 101(1), 29–67. https://doi.org/10.1016/j.earscirev.2010.01.002 (2010).
11. Fournier, M. et al. Arabia-Somalia plate kinematics, evolution of the Adel-Owen-Carlsberg triple junction, and opening of the
Gulf of Aden. J. Geophys. Res. 115, B04102. https://doi.org/10.1029/2008JB006257 (2010).
12. ArRajehi, A. et al. Geodetic constraints on present-day motion of the Arabian Plate: implications for Red Sea and Gulf of Aden
rifting. Tectonics 29, TC3011. https://doi.org/10.1029/2009TC002482 (2010).
13. Bosworth, W., Huchon, P. & McClay, K. The Red Sea and Gulf of Aden basins. J. Afr. Earth Sci. 43, 334–378 (2005).
14. Röser, H. A. A detailed magnetic survey of the southern Red Sea. Geol. Jahrbuch 13, 131–153 (1975).
15. Cochran, J. R. A model for development of Red Sea. AAPG Bull. 67(1), 41–69 (1983).
16. Almalki, K. A., Betts, P. G. & Ailleres, L. Incipient seafloor spreading segments: insights from the Red Sea. Geophys. Res. Lett. 43(6),
2709–2715 (2016).
17. Ligi, M. et al. Birth of an ocean in the Red Sea: oceanic-type basaltic melt intrusions precede continental rupture. Gondwana Res.
54, 150–160 (2018).
18. Sultan, M. et al. New constraints on Red Sea rifting from correlations of Arabian and Nubian Neoproterozoic outcrops. Tectonics
12, 1303–1319 (1993).
19. Augustin, N. et al. The transition from rifting to spreading in the Red Sea. Earth Planet. Sci. Lett. 395, 217–230 (2014).
20. Mitchell, N. C. & Park, Y. Nature of crust in the central Red Sea. Tectonophysics 628, 123–139 (2014).
21. Koulakov, I. LOTOS code for local earthquake tomographic inversion. Benchmarks for testing tomographic algorithms. Bull.
Seismol. Soc. Am. 99(1), 194–214. https://doi.org/10.1785/0120080013 (2009).
22. El Khrepy, S., Koulakov, I. & Al-Arifi, N. Crustal structure beneath the continental rifting area of Gulf of Suez from earthquakes
tomography. Tectonophysics 668–669, 92–104. https://doi.org/10.1016/j.tecto.2015.11.027 (2016).
23. El Khrepy, S., Koulakov, I., Al-Arifi, N. & Petrunin, A. Seismic structure beneath the Gulf of Aqaba and adjacent areas based on
the tomographic inversion of regional earthquake data. Solid Earth 7, 965–978. https://doi.org/10.5194/se-7-965-2016 (2016).
24. Roland, E., Behn, M. D. & Hirth, G. Thermal-mechanical behavior of oceanic transform faults: implications for the spatial distribu-
tion of seismicity. Geochem. Geophys. Geosyst. 11, 15. https://doi.org/10.1029/2010GC003034 (2010).
25. Kaban, M. K., El Khrepy, S. & Al-Arifi, N. Density structure and isostasy of the lithosphere in Egypt and their relation to seismicity.
Solid Earth 9(4), 833–846 (2018).
26. Wright, T. J. et al. Magma-maintained rift segmentation at continental rupture in the 2005 Afar dyking episode. Nature 442(7100),
291–294 (2006).
27. Ebinger, C. J., van Wijk, J. & Keir, D. The time scales of continental rifting: implications for global processes. Geol. Soc. Am. Special
Pap. 500, 371–396 (2013).
28. Hofstetter, A. & Beyth, M. The Afar depression: interpretation of the 1960–2000 earthquakes. Geophys. J. Int. 155(2), 715–732
(2003).
29. Debayle, E., Lévêque, J. J. & Cara, M. Seismic evidence for a deeply rooted low-velocity anomaly in the upper mantle beneath the
northeastern Afro/Arabian continent. Earth Planet. Sci. Lett. 193(3–4), 423–436 (2001).
30. Koulakov, I. et al. Evidence for anomalous mantle upwelling beneath the Arabian Platform from travel time tomography inversion.
Tectonophysics 667, 176–188 (2016).
31. Bastow, I. D. & Keir, D. The protracted development of the continent–ocean transition in Afar. Nat. Geosci. 4(4), 248–250 (2011).
32. Gerya, T. V., Stern, R. J., Baes, M., Sobolev, S. & Whattam, S. A. Plate tectonics on the Earth triggered by plume-induced subduc-
tion initiation. Nature 527, 221–225 (2015).
33. Buck, W. R., Lavier, L. L. & Poliakov, A. N. Modes of faulting at mid-ocean ridges. Nature 434(7034), 719 (2005).
Acknowledgements
The authors thank National Research Institute of Astronomy and Geophysics (NRIAG) for providing the Egyptian
seismic network data and King Abdulaziz City for Science and Technology (KACST) for providing Saudi Arabian
seismic network data. IK was supported by the RSF Project 20-17-00075. The authors are grateful to Deanship
of Scientific Research, King Saud University for funding through Vice Deanship of research chairs. The authors
thank the Deanship of Scientific Research and Researcher’s Services at King Saud University for editing service.
Derived products from this publication, including arrival times of P and S waves and the full folder of the LOTOS
code that allows reproducing all the results of this research are presented in the file repository: Ivan Koulakov.
(2021). LOTOS code for tomographic inversion in the Red Sea area [Data set]. Scientific Reports. Zenodo. http://
doi.org/10.5281/zenodo.4482096.
Author contributions
S.E.K. and N.A.A. initiated the research and provided the main ideas for interpretation. I.K. calculated the tomo-
graphic model and developed the algorithm for this study. T.G. was primarily responsible for the interpretation.
S.E.K., M.S.A., and A.N.Q. processed the raw seismic data. All authors contributed to discussions, interpretation,
and writing of the paper.
Scientific Reports | (2021) 11:5594 | https://doi.org/10.1038/s41598-021-84952-w 6
Vol:.(1234567890)www.nature.com/scientificreports/
Competing interests
The authors declare no competing interests.
Additional information
Supplementary Information The online version contains supplementary material available at https://doi.org/
10.1038/s41598-021-84952-w.
Correspondence and requests for materials should be addressed to I.K.
Reprints and permissions information is available at www.nature.com/reprints.
Publisher’s note Springer Nature remains neutral with regard to jurisdictional claims in published maps and
institutional affiliations.
Open Access This article is licensed under a Creative Commons Attribution 4.0 International
License, which permits use, sharing, adaptation, distribution and reproduction in any medium or
format, as long as you give appropriate credit to the original author(s) and the source, provide a link to the
Creative Commons licence, and indicate if changes were made. The images or other third party material in this
article are included in the article’s Creative Commons licence, unless indicated otherwise in a credit line to the
material. If material is not included in the article’s Creative Commons licence and your intended use is not
permitted by statutory regulation or exceeds the permitted use, you will need to obtain permission directly from
the copyright holder. To view a copy of this licence, visit http://creativecommons.org/licenses/by/4.0/.
© The Author(s) 2021, corrected publication 2021
Scientific Reports | (2021) 11:5594 | https://doi.org/10.1038/s41598-021-84952-w 7
Vol.:(0123456789)You can also read