Tracing local sources and long range transport of PM10 in central Taiwan by using chemical characteristics and Pb isotope ratios
←
→
Page content transcription
If your browser does not render page correctly, please read the page content below
www.nature.com/scientificreports
OPEN Tracing local sources
and long‑range transport of PM10
in central Taiwan by using chemical
characteristics and Pb isotope
ratios
Po‑Chao Wu1,2,3 & Kuo‑Fang Huang2*
Central Taiwan is among the most heavily polluted regions in Taiwan because of a complex mixing of
local emissions from intense anthropogenic activities with natural dust. Long-range transport (LRT) of
pollutants from outside Taiwan also contributes critically to the deterioration of air quality, especially
during the northeast monsoon season. To identify the sources of particulate matter < 10 μm (PM10) in
central Taiwan, this study performed several sampling campaigns, including three local events, one
LRT event, and one dust storm event, during the northeast monsoon season of 2018/2019. The PM10
samples were analyzed for water-soluble ion and trace metal concentrations as well as Pb isotope
ratios. Local sediments were also collected and analyzed to constrain chemical/isotopic signatures
of natural sources. The Pb isotope data were interpreted together with the enrichment factors and
elemental ratios of trace metals in PM10, and reanalysis data sets were used to delineate the sources
of PM10 in central Taiwan. Our results suggested that Pb in PM10 was predominantly contributed by
oil combustion and oil refineries during the local events (48–88%), whereas the lowest contributions
were from coal combustion (< 21%). During periods of high wind speed, the contribution from natural
sources increased significantly from 13 to 31%. Despite Pb represented only a small portion of PM10,
a strong correlation (r = 0.89, p < 0.001, multiple regression analysis) between PM10 mass and the
concentrations of Pb, V, and Al was observed in the study area, suggesting that the sources of PM10
in central Taiwan can be possibly tracked by using chemical characteristics and Pb isotopes in PM10.
Moreover, the Pb isotopic signals of PM10 collected during the LRT event confirmed the impact of LRT
from Mainland China, and the chemical characteristics of the PM10 significantly differed from those of
the PM10 collected during local events. This study demonstrates the robustness of using a combination
of Pb isotopic compositions and chemical characteristics in PM10 for source tracing in complex and
heavily polluted areas.
Atmospheric particulate matter (PM) is derived from both natural and anthropogenic sources. It affects the
atmospheric condition by reducing visibility and deteriorating air quality, and it even changes the Earth’s surface
albedo, which influences regional climate changes1,2. In addition, high concentrations of PM, the main carrier of
heavy metals, can cause lung function decline and increase the risk of respiratory and cardiovascular diseases3–5.
For example, chronic exposure to Pb can be harmful to the neural system, leading to lower memory capabilities
and even inducing c ancer6,7. Thus, studying the sources of PM is vital for strategically mitigating such pollution.
In the recent three decades, emissions of anthropogenic PM and heavy metals into the atmosphere have been
increasing in East Asia (e.g., P
M10 emission increased from 20 Tg in 1990 to 27 Tg in 2010) as a result of grow-
ing economies and the rapid development of c ities8. According to available global estimates, China is a major
contributor of global PM and heavy metal e missions8–10. Despite a recent declining trend, atmospheric emissions
are still the highest among Asian c ountries9,11,12. The influences of industrial aerosols from China through long-
range transport (LRT) have been recorded in many areas, such as South Korea13, Japan14,15, the North Pacific16,
1
Earth System Science Program, Taiwan International Graduate Program (TIGP), Academia Sinica, Taipei,
Taiwan. 2Institute of Earth Sciences, Academia Sinica, Taipei, Taiwan. 3College of Earth Sciences, National Central
University, Taoyuan, Taiwan. *email: kfhuang@earth.sinica.edu.tw
Scientific Reports | (2021) 11:7593 | https://doi.org/10.1038/s41598-021-87051-y 1
Vol.:(0123456789)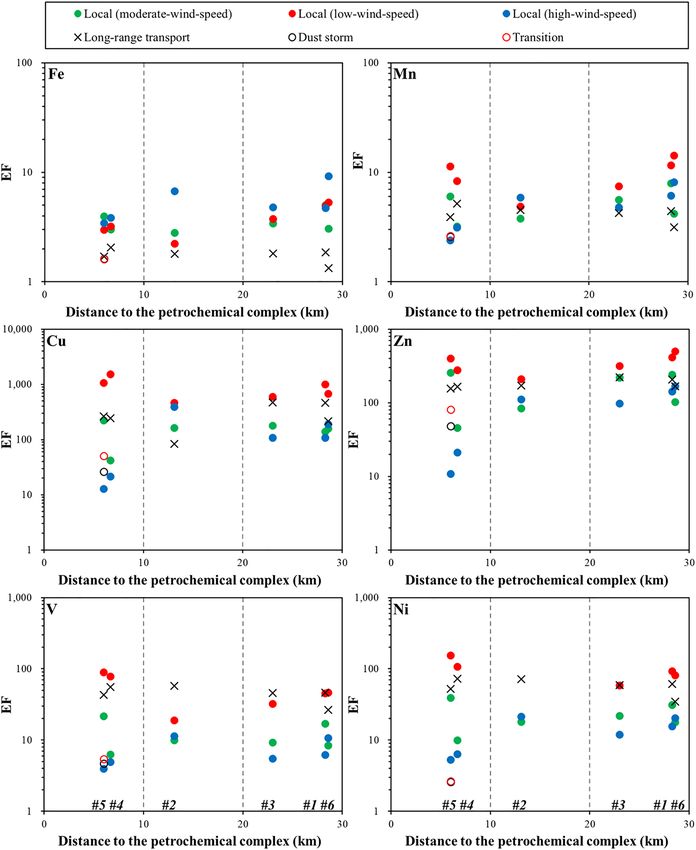
www.nature.com/scientificreports/
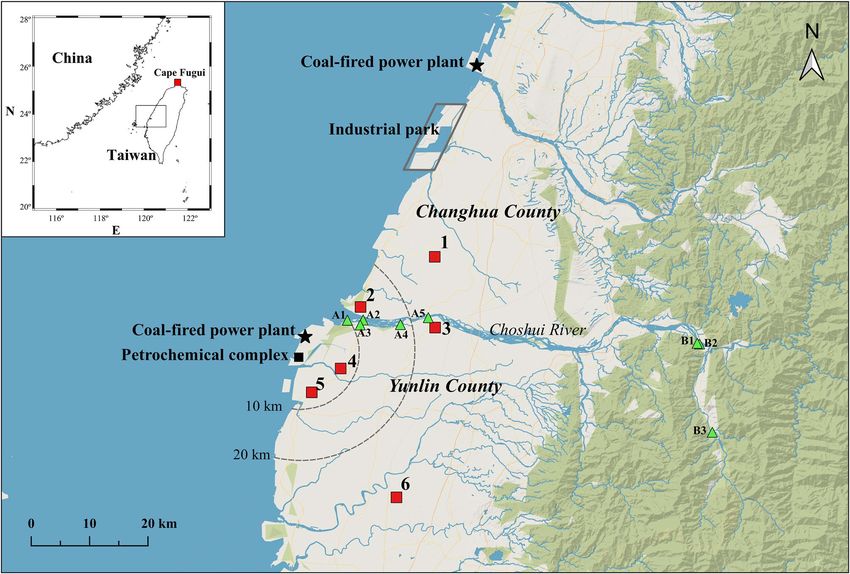
Figure 1. Map of the study area in Changhua and Yunlin Counties, central Taiwan. The red square represents
the PM10 sampling site, and the green triangle represents the sediment sampling site.
and even the United States17,18 and Canada19. Taiwan, as a neighboring country approximately 100 miles away,
has continued to receive airborne PM from China (including particles derived from anthropogenic activities
and dust storms), particularly during the northeastern monsoon s eason20–23.
In addition to LRT, the coastal area of central Taiwan is also impacted by intense local anthropogenic activ-
ities, such as emissions from industrial parks, coal-fired power plants, petrochemical complexes, and vehi-
cle exhaust. Studies have conducted detailed investigations into the chemical characteristics of PM < 2.5 μm
(PM2.5) and PM < 10 μm (PM10) in this region24–26. Hsu et al.25 found that average PM10 concentrations were high
(76.4 ± 22 μg m−3) during winter, with an annual P M10 concentration of 52.4 ± 27.2 μg m−3. Moreover, extremely
high PM10 episodes (> 125 μg m ) have also occurred occasionally during the northeast monsoon s eason24,27.
−3
The PM10 in central Taiwan was estimated using a receptor model derived from soil dust, crustal materials, coal
combustion, oil combustion, and traffic emissions25. Although several studies have investigated the characteristics
of PM and the contributions from local sources in central Taiwan, remarkably few have attempted to distinguish
the chemical characteristics and Pb isotope ratios of PM10 from local sources and LRT.
The Pb isotope ratio is an essential tool for tracking pollution sources in the atmosphere. Pb exists in both
natural and anthropogenic sources and has four naturally occurring isotopes: 204Pb is a non-radiogenic nucleus,
whereas 206Pb, 207Pb, and 208Pb are radiogenic end products from the decay series of 238U, 235U, and 232Th, respec-
tively. Pb is produced and released into the environment through human activities that use various ore minerals
(e.g., Pb ore) with distinct Pb isotope ratios formed under varying geological conditions. These isotope ratios do
not fractionate during industrial processes, making them a promising tool for identifying pollution sources28,29.
This technique has been deployed to study PM sources in the atmosphere14,18,30–33 as well as the sources of par-
ticles in ice c ores29,34,35.
Although some efforts have been made to study the Pb isotope ratios of PM in northern T aiwan20,23, the
information available on Pb isotopic variations in P M10 remains limited. For instance, the constraints on local
end-members and variations in isotopic signals over time and during different events have not been thoroughly
studied. In the present study, P M10 was collected in central Taiwan during events of different types, including
local events, an LRT event, and a dust storm (Fig. 1, and “Materials and methods” for the definition of each
event type). Details about the sampling sites and period, wind speed and direction, temperature, precipitation,
and relative humidity are summarized in Table 1. The main purposes of this study were, for the first time, (1) to
characterize the chemical properties and Pb isotope ratios of local pollutants under different wind conditions
(on daily basis) in central Taiwan, and (2) to identify the possible Pb source in PM10 during each event using the
chemical characteristics and Pb isotope ratios.
Scientific Reports | (2021) 11:7593 | https://doi.org/10.1038/s41598-021-87051-y 2
Vol:.(1234567890)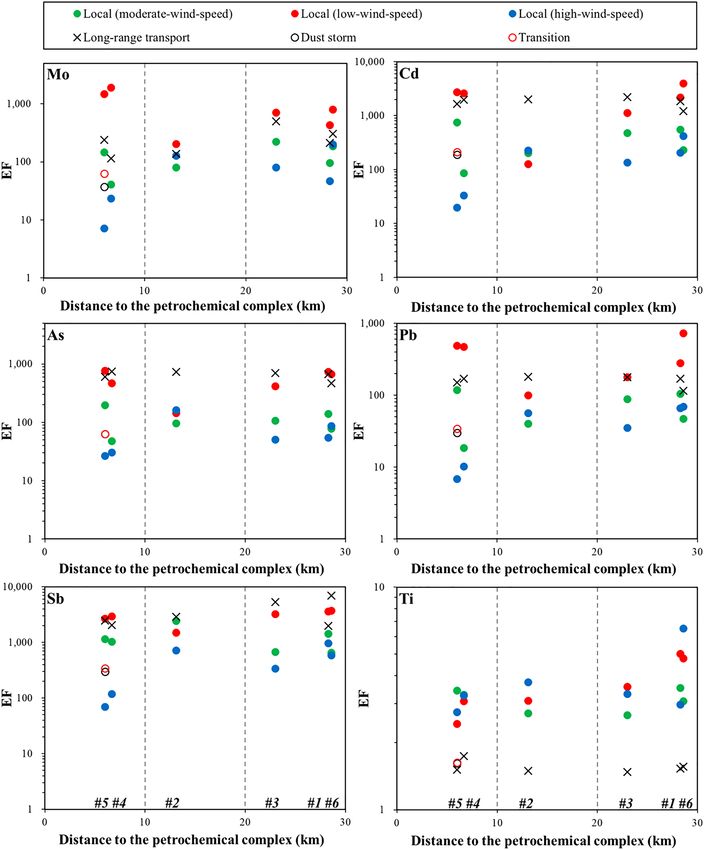
www.nature.com/scientificreports/
Event type Sampling periods Sites WD WS (m/s) T (ºC) RH (%) P (mm)
Local (moderate-wind-speed) 11/13–15 (2018) #1–#6 North-Northwest 2.7–6.8 23.9–25.5 67–81 0
Local (low-wind-speed) 11/25 (2018) #1–#6 Northwest, Southeast 0.95–3.0 17.9–22.5 75–98 1.5–8
Local (high-wind-speed) 12/7 (2018) #1–#6 North 3.9–11.7 21.0–22.6 68–88 0
10/4–5 (2019) #1–#6, Northeast-Northwest 0.93–1.2 26.2–27.4 82–90 0
Long-range transport
10/4–5 (2019) Cape Fugui East 4.0 25.8 79 0
Dust storm 10/30–31 (2019) #5 North 6.5 24.3 77 0
Transition 10/31–11/1 (2019) #5 North 5.4 25.1 80 0
Table 1. Table of sampling periods, sampling sites, and sampling parameters for each event. WD: wind
direction; WS: averaged wind speed; T: temperature; RH: relative humidity; P: precipitation. Meteorological
data at each site is available on the EPA environmental resource database and Central Weather Bureau in
Taiwan.
Results and discussion
PM10, ion, and metal concentrations. The variations of PM mass, metal and ion concentrations for
PM10 collected from each event are summarized in Supplementary Table S1. Supplementary Fig. S1 illustrates
variations in the daily average values of air quality parameters (including P M10, PM2.5, O3, and N
Ox/O3 ratio
provided by the Taiwan Environmental Protection Administration [TEPA]) covering this study’s sampling
periods (during the northeast monsoon in 2018 and 2019). All sampling campaigns were divided into local,
LRT, and dust storm events based on the air mass back trajectory analysis, transport of nitric acid from outside
Taiwan (reanalysis data), NOx/O3 ratio, and Al concentration in PM10. The local events were subdivided into
low- (11/25, 2018), moderate- (11/13–15, 2018), and high-wind-speed (12/7, 2018) events based on wind speed
criteria (see Materials and Methods for the details). The PM10 concentrations during all events in central Taiwan
were high (Table 2), and most of them exceeded those stated in the Air Quality Guidelines provided by the World
Health Organization (20 μg m−3 and 50 μg m−3 for annual mean and daily mean, respectively)36. In general, the
PM10 concentration was relatively low (15.7–74.0 μg/m3) during the low-wind-speed event, while it reached the
highest values during the high-wind-speed event (57.1–121 μg/m3). A moderate correlation (r = 0.59, p = 0.01)
between PM10 and wind speed was found during the local events, suggesting that PM10 concentration in cen-
tral Taiwan is most likely affected by factors related to the wind speed. During the low-wind-speed local event,
elevated concentrations of water-soluble ionic species ([NO3−] = 8277–16,062 ng/m3, [NH4+] = 4258–8354 ng/
m3, and [SO42−] = 4794–9091 ng/m3) indicated that the atmospheric condition became stagnant as the wind
weakened, and pollutants accumulated. Substantially lower concentrations of crustal elements (Al, Fe, and
Ti) during this low-wind-speed event suggested a relatively small contribution from crustal materials. Dur-
ing the high-wind-speed local event, concentrations of ionic species decreased ([NO3−] = 2563–3127 ng/m3,
[NH4+] = 182–1091 ng/m3, and [SO42−] = 2661–4885 ng/m3) while concentrations of crustal elements increased
(see Supplementary Table S1). During the LRT event (10/4–5, 2019), high concentrations of both PM10 (66.0–
92.2 μg/m3) and water-soluble ionic species ([NO3−] = 10,665–24,430 ng/m3, [NH4+] = 9754–15,472 ng/m3, and
[SO42−] = 16,445–23,725 ng/m3) and heavy metals (V, Ni, As, Cd, and Pb) indicated worsening air quality caused
by anthropogenic activities. By contrast, elevated PM10 (78.1 μg/m3) and Al concentration during the dust storm
event (10/30–31, 2019) reflected greater contributions from crustal materials. To trace the source of PM10 in
central Taiwan, we further applied enrichment factors (EFs), elemental ratios, and the Pb isotope data in P M10;
this is discussed in the following sections.
Enrichment factors and elemental ratios in PM10. Elements, such as V and Ni, have been widely used
as indicator elements of oil combustion9,37, and Mo is often regarded as a tracer for heavy oil combustion38,39.
By investigating metal compositions of filterable stack total suspended particles emitted from industrial areas
in Taiwan, Lin et al.40 reported that Mn, Zn, and Pb are critical marker elements for electric arc furnace steel
plants, and that As, Cd, Sb, and Pb are potential indicator elements for coal-fired power plants. The EFs of these
elements, therefore, can be further used to discuss anthropogenic sources. The EFs in PM10 at each study site
were plotted against distance to a petrochemical complex to illustrate the distribution patterns of trace metals in
this region. As depicted in Fig. 2, the EFs were high in the low-wind-speed local event, with the highest EFs of V
(> 78), Ni (> 108), Cu (> 1056), and Mo (> 1478) at sites #4 and #5, the nearest sites to the petrochemical complex.
Relative to the low-wind-speed event, the EFs decreased during the moderate-wind-speed event and reached the
lowest values during the high-wind-speed local event. The EFs also varied significantly at sites, especially during
the high-wind-speed local event, indicating that contributions from local sources changed at sites. During the
LRT event, EFs of Fe and Ti had lower values than those observed during the local events, while high values were
observed for most heavy metals. During the dust storm event, low EFs might have resulted from the dilution
effect due to relatively higher contributions of crustal materials (Fig. 2).
To better assess the emission sources, elemental ratios such as Fe/Al, V/Ni, and Cd/Pb are often used as
indicators of dust sources41,42, source of oil c ombustion43–45, and source of industrial a ctivities9,46, respectively.
The selected elemental ratios for PM10 collected in this study are summarized in Table 2. High Fe/Al ratios
(1.03–2.66) were found during the local events, while low Fe/Al ratios (0.58–0.90) were found during the LRT
event. The higher Fe/Al during the local events indicated Fe emission from steel plant or oil c ombustion40,47,48;
the lower Fe/Al suggested PM might originate from different sources. Fe/Al ratio of 0.71 was observed during
Scientific Reports | (2021) 11:7593 | https://doi.org/10.1038/s41598-021-87051-y 3
Vol.:(0123456789)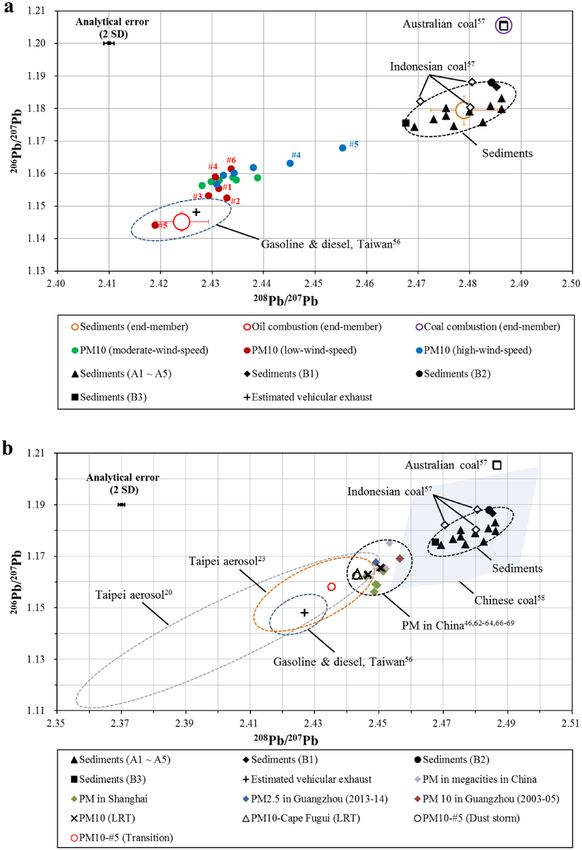
www.nature.com/scientificreports/
Site PM10 (μg/m3) Sampling duration (h) Volume (m3) Fe/Al V/Ni Cd/Pb
Local (moderate-wind-speed)
#1 108 10 689 2.18 1.62 0.026
#2 52.0 12 792 1.22 1.64 0.025
#3 62.0 28 1730 1.49 1.27 0.027
#4 116 12 781 1.31 1.91 0.023
#5 46.5 23 1457 1.72 1.65 0.031
#6 67.1 12 774 1.33 1.41 0.024
Local (low-wind-speed)
#1 61.2 18 1241 2.16 1.47 0.038
#2 15.7 2 118 – – –
#3 78.1 18 1017 1.62 1.65 0.031
#4 59.5 18 1153 1.39 2.19 0.027
#5 53.1 18 1070 1.29 1.75 0.027
#6 48.4 18 1188 2.30 1.72 0.026
Local (high-wind-speed)
#1 57.1 12 838 1.65 1.19 0.015
#2 42.2 12 792 1.81 1.59 0.020
#3 80.2 12 763 1.54 1.39 0.019
#4 116 12 829 1.22 2.33 0.016
#5 121 12 784 1.03 2.25 0.014
#6 66.1 12 792 2.66 1.58 0.030
Long-range transport
#1 82.6 17 1132 0.81 2.28 0.053
#2 83.0 17 1130 0.78 2.42 0.054
#3 83.3 17 1122 0.79 2.31 0.061
#4 82.8 17 1193 0.90 2.29 0.057
#5 66.0 17 1122 0.74 2.48 0.054
#6 92.2 17 1122 0.58 2.29 0.051
Cape Fugui 17.9 17 1235 0.87 2.38 0.037
Dust storm 78.1 24 1584 0.71 2.02 0.031
Transition 59.0 24 1584 0.70 1.92 0.030
Sediments (A) 042–0.53 1.85–2.94 0.007–0.089
Sediments (B) 0.40–0.43 1.87–2.55 0.0009–0.0018
UCC61 0.44 3.00 0.005
Table 2. PM10 mass, sampling duration, filtered air volume, and selected elemental ratios for P
M10 samples
collected in this study.
the dust storm event. This ratio is similar to those observed in a major Asian dust storm event49 and dust from
Northern China41, indicating that PMs during the dust storm event were transported from Northern China.
A high correlation between V and Ni (r = 0.88, p < 0.001) was obtained for P M10 collected during the local
events, suggesting the presence of one major V–Ni source. V/Ni ratio showed a narrow range between 1.19 and
2.33 during the local events, and slightly higher V/Ni ratios (2.28–2.48) were observed during the LRT event.
According to previous studies, higher V/Ni ratios were reported in heavy oil combustion (V/Ni = 3–4)43 and
ship emissions (V/Ni = 2.5–5)44,45, whereas lower V/Ni ratios might indicate additional Ni from other sources
(especially oil combustion)50. Cd/Pb ratios varied between 0.014 and 0.038 during the local events. Chen et al.24
found a similar Cd/Pb ratio (0.033) for local emissions in central Taiwan, and a lower Cd/Pb ratio (0.024) was
observed during high PM loading episodes. Hsu et al.51 also reported a Cd/Pb ratio of 0.030 for P
M10 during sum-
mer in Taipei, and Cd/Pb decreased to 0.024 and 0.018 during the northeast monsoon and Asian dust periods,
respectively. The Cd/Pb ratios found during the local events were similar to those obtained from anthropogenic
activities in Europe (0.022)52. By contrast, high Cd/Pb ratios (0.051–0.061) were found during the LRT event,
and these values were not observed in Taiwan before, indicating PM originated from non-local pollutants. The
high Cd/Pb ratios were reported for PM in megacities in China53, these high ratios possibly indicated the origins
of PM from non-ferrous metal p roduction52.
As mentioned above, Al, V, and Pb are marker elements for different sources; V/Al was plotted against Pb/
Al in PM10 collected during the local events to illustrate sources contributed to these metals in central Taiwan.
As shown in Fig. 3, at least three primary sources contributed to these metals in PM10 during the local events.
Besides, an additional source was identified in this region during the LRT event. Multiple regression analysis was
performed between P M10 and elemental Al, V, and Pb concentrations for P M10 collected during the local events.
Scientific Reports | (2021) 11:7593 | https://doi.org/10.1038/s41598-021-87051-y 4
Vol:.(1234567890)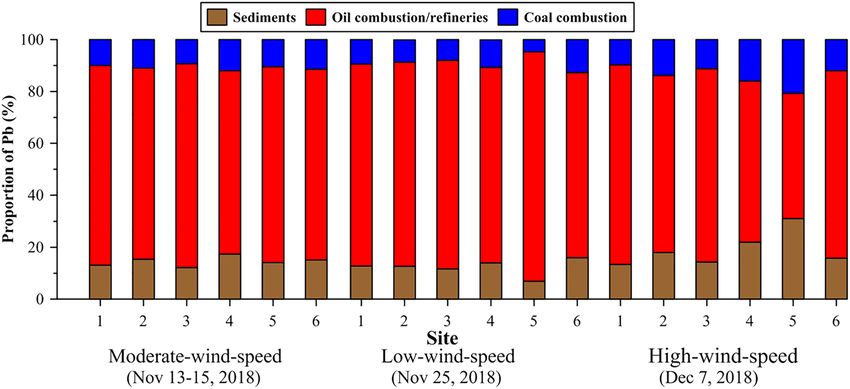
www.nature.com/scientificreports/

                                  Figure 2.  Enrichment factors (EFs) of elements (Fe, Mn, Cu, Zn, V, Ni, Mo, Cd, As, Pb, Sb, and Ti) versus
                                  distance to the petrochemical complex for all events collected in this study.

Scientific Reports |   (2021) 11:7593 |               https://doi.org/10.1038/s41598-021-87051-y                                                5

                                                                                                                                           Vol.:(0123456789)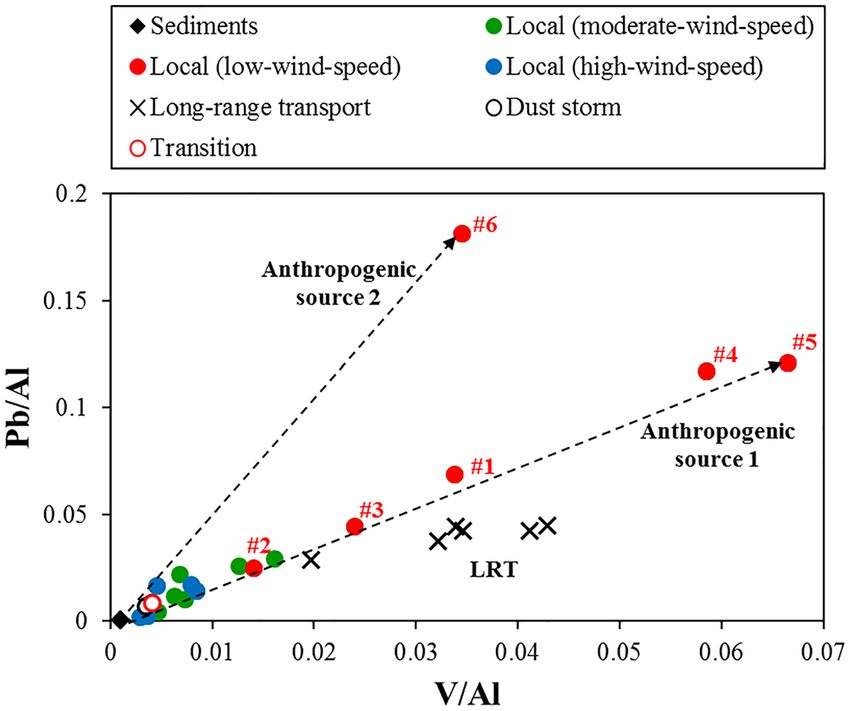
www.nature.com/scientificreports/
Figure 2. (continued)
A high correlation (r = 0.89, p < 0.001) was obtained in this study, suggesting that the sources of P M10 in central
Taiwan are possibly tracked by these chemical characteristics (including Pb) of P M10. We, therefore, further
evaluate the potential of utilizing Pb isotope ratios of P
M10 for tracing sources of Pb in PM10 in central Taiwan.
Pb isotope compositions of potential PM10 sources in Taiwan. Anthropogenic sources. The major
anthropogenic sources of Pb are emissions from oil combustion (including oil boilers, vehicle exhaust, and oil
refineries), coal combustion, and high-temperature industrial processes (e.g., steel plants)54. Taiwan is an island
with limited energy resources and mainly relies on imported resources from other countries (up to 98%). Ac-
cording to Taiwan’s Bureau of Energy, oil, coal, and natural gas accounted for 48%, 29%, and 15%, respectively,
of Taiwan’s total primary energy consumption in 201855. Since 2012, Taiwan has been importing crude oil from
Saudi Arabia (31%), Kuwait (21%), and others in similar proportions. Taiwan has been imported coal mainly
from Australia (35–50%) and Indonesia (26–40%) since 2012. The unique Pb isotopic signatures of these sources
facilitate the distinguishing of Pb sources. Yao et al.56 investigated the Pb isotope compositions of commercial
Scientific Reports | (2021) 11:7593 | https://doi.org/10.1038/s41598-021-87051-y 6
Vol:.(1234567890)www.nature.com/scientificreports/
oils from two main oil product suppliers in Taiwan, with a 206Pb/207Pb ratio of 1.141 to 1.151 and a 208Pb/207Pb
ratio of 2.417 to 2.429 for unleaded gasoline, and a 206Pb/207Pb ratio of 1.148 to 1.149 and a 208Pb/207Pb ratio
of 2.431 to 2.433 for diesel; they also estimated the Pb isotope ratios of vehicular emissions in Taiwan to be
1.148 for 206Pb/207Pb and 2.427 for 208Pb/207Pb based on the sales and market share of gasoline and diesel in
Taiwan (Fig. 4). Díaz-Somoano et al.57 reported that Australian coal and Indonesian coal have high Pb iso-
tope ratios (with 206Pb/207Pb = 1.205 to 1.211 and 208Pb/207Pb = 2.487, and with 206Pb/207Pb = 1.180 to 1.188 and
208
Pb/207Pb = 2.470 to 2.481, respectively); Bi et al.58 also reported high value of Pb isotopic ratios for Chinese
coals in different regions (206Pb/207Pb = 1.161 to 1.223, with an average value of 1.188, and 208Pb/207Pb = 2.453
to 2.511, with an average value of 2.482), as illustrated in Fig. 4. Regarding Pb emissions in high-temperature
industries, no Pb isotope data are available for Taiwan; therefore, constraining Pb isotope ratios for these emis-
sions in the future is needed.
Natural source. Studies have demonstrated that, under high wind speeds, windblown dust influences the
air quality in the downstream segment of the Choshui River, particularly during the northeast monsoon
season27,59,60. However, these studies have not provided a quantitative estimation of the contribution of local
M10 in central Taiwan. Recently, Hsu et al.25 attempted to estimate this contribution by using a receptor-
dust to P
based source apportionment model. Herein, we provide an alternative method for calculating the contribution
based on the Pb isotope ratios of P M10 and potential end-members. To constrain the isotopic signals of natu-
ral materials and further estimate their contribution to Pb in PM10, we analyzed sediments from the Choshui
River catchment (Fig. 1) for their metal concentrations and Pb isotope ratios. Because sediments in down-
stream areas could be influenced by human activities, sampling was conducted in both the downstream (group
A) and upstream (group B) segments of the Choshui River catchment (Fig. 1). The EFs of these sediments
were calculated relative to the upper continental crust61, and the results are presented in Supplementary Fig. S2.
Although the EFs of Cd were higher (EFCd = 9.9 ± 8.6) downstream than upstream (EFCd = 0.5 ± 0.2), most EF
values were close to unity for sediments collected from the upstream and downstream segments of the Choshui
River catchment. This indicates that the element contents of this river’s sediments are similar to the average
composition in the upper continental crust. All the sediments analyzed in this study exhibited higher Pb isotopic
ratios (206Pb/207Pb = 1.174–1.188; 208Pb/207Pb = 2.468–2.486, Supplementary Table S3) compared with aerosols
collected in central Taiwan during this study (Fig. 4).
Pb source of PM10 in central Taiwan: local events. As shown in the triple Pb isotope plot (Fig. 4a),
PM10 during the low-wind-speed event (11/25, 2018) had the lowest Pb isotope ratios, with a 206Pb/207Pb ratio
of 1.144–1.161 and a 208Pb/207Pb ratio of 2.419–2.434 (Table 3). These ratios were close to or within the range
of those reported for gasoline and diesel in Taiwan, suggesting that oil combustion/refineries are the main
sources of Pb during the low-wind-speed conditions. Under this low-wind-speed condition, P M10 at sites #4
and #6 exhibited slightly elevated Pb isotope ratios, indicating the presence of Pb sources other than oil combus-
tion (Fig. 4a). For instance, site #6, the southernmost site in the study region, exhibited high Pb isotope ratios
(206Pb/207Pb = 1.161 and 208Pb/207Pb = 2.434) and a high ratio of Pb/Al (Figs. 3 and 4a). From a combination of
geochemical constraints (i.e. higher Pb/Al and Pb isotope ratios), we inferred that the elevated Pb isotope ratios
at sites #4 and #6 were the result of elevated contributions from coal-fired power plants and steel plants. Pb iso-
tope emission signals from steel plants, however, are still required to further assess the contribution from such
plants.
During the moderate- (11/13–15, 2018) and high-wind-speed (12/7, 2018) events, PM10 had higher Pb isotope
ratios compared with P M10 observed during the low-wind-speed event, with a 206Pb/207Pb ratio of 1.157–1.168
208 207
and a Pb/ Pb ratio of 2.431–2.455 (Table 3, Fig. 4a). The higher Pb isotope ratios suggested that Pb originated
from either sediments or coal combustion because of the overlap of ratios between Indonesian coal and local sedi-
ments. This overlap of isotopic signals may hamper the explanation of the source. However, these two potential
sources can be differentiated using EF values. As illustrated in Figs. 2 and 4a, PM10 at sites #4 and #5 during the
high-wind-speed event had the highest Pb isotope ratios and the lowest EF of Pb (< 10), indicating that these
high ratios were mainly contributed by sediments rather than by other sources. The high concentrations of Al
(3107 and 3656 ng/m3, respectively) in P M10 at these two sites also support the increased contribution of crustal
materials during the high-wind-speed event, confirming that natural dust is the dominant source of PM10 in
central Taiwan during the northeast monsoon season.
In summary, P M10 in central Taiwan was predominantly attributed to oil combustion processes (i.e., industrial
activities from the petrochemical complex and vehicular emissions), whereas the signals from coal-fired power
and steel plants varied between sites. When the wind speed increased, another crucial PM10 source in central
Taiwan was local sediments.
Pb source of PM10 in central Taiwan: LRT and dust storm events. During October 2–4, 2019, Tai-
wan’s main island suffered severe air pollution because of LRT of pollutants from China and poor diffusion
conditions. The air mass back trajectory revealed that the air parcels possibly originated from Southeast China,
passing the Pearl River Delta (PRD) region, a major industrial and economic center (Supplementary Fig. S4).
The European Centre for Medium-Range Weather Forecasts (ECMWF) Atmospheric Composition Reanalysis
4 (EAC4) reanalysis dataset reveals that a nitric acid plume formed in Southeast China and gradually moved
northeastward to Taiwan (Supplementary Fig. S5). In this study, P M10 samples were collected on October 4,
2019. As discussed previously, the high concentrations of ionic species (sulfate, nitrate, and ammonium) and
heavy metals (V, Ni, As, Cd, and Pb) indicated that the air quality became increasingly polluted (Supplementary
Scientific Reports | (2021) 11:7593 | https://doi.org/10.1038/s41598-021-87051-y 7
Vol.:(0123456789)www.nature.com/scientificreports/
Figure 3. Plot of Pb/Al versus V/Al for P
M10 and sediments collected in central Taiwan.
Figure 4. (a) Triple isotope plot of the Pb in P
M10 during the local events. Pb isotope ratios of potential end-
members (e.g., Oil combustion/refineries, coal combustion, and sediments) are also shown as red, purple, and
orange open circles, respectively. (b) Triple isotope plot of the Pb in P M10 during the long-range transport and
the dust storm events. Pb isotope ratios of PMs collected in T aipei20,23, China46,62–64,66–69, are also plotted for
comparison.
Scientific Reports | (2021) 11:7593 | https://doi.org/10.1038/s41598-021-87051-y 8
Vol:.(1234567890)www.nature.com/scientificreports/
Site Pb/204Pb
206
2 se Pb/207Pb
206
2se Pb/207Pb
208
2 se Pb conc. (ng/m3)
Local (moderate-wind-speed)
#1 18.0368 0.0018 1.1576 0.00018 2.4298 0.00041 22.9
#2 18.0577 0.0019 1.1580 0.00019 2.4347 0.00044 5.63
#3 18.0154 0.0021 1.1564 0.00021 2.4281 0.00052 18.2
#4 18.0757 0.0016 1.1586 0.00015 2.4388 0.00033 7.80
#5 18.0399 0.0024 1.1579 0.00023 2.4314 0.00053 10.8
#6 18.066 0.0021 1.1588 0.00021 2.4340 0.00050 8.97
Local (low-wind-speed)
#1 17.9996 0.0021 1.1554 0.00020 2.4313 0.00047 11.2
#2 17.9858 0.0016 1.1525 0.00015 2.4329 0.00032 1.33
#3 17.9705 0.0021 1.1531 0.00021 2.4293 0.00048 15.6
#4 18.0487 0.0028 1.1589 0.00028 2.4307 0.00065 25.7
#5 17.7884 0.0029 1.1441 0.00027 2.4189 0.00063 18.7
#6 18.1116 0.0018 1.1614 0.00018 2.4337 0.00046 30.5
Local (high-wind-speed)
#1 18.0192 0.0028 1.1568 0.00026 2.4309 0.00058 18.2
#2 18.1095 0.0018 1.1618 0.00017 2.4380 0.00040 5.45
#3 18.0704 0.0017 1.1594 0.00016 2.4322 0.00034 15.6
#4 18.1417 0.0014 1.1631 0.00013 2.4452 0.00031 7.89
#5 18.2533 0.0016 1.1679 0.00015 2.4554 0.00032 6.19
#6 18.0924 0.0024 1.1601 0.00024 2.4343 0.00051 12.7
Long-range transport
#1 18.2004 0.0012 1.1631 0.00011 2.4468 0.00025 27.4
#2 18.2451 0.0014 1.1653 0.00013 2.4508 0.00029 28.1
#3 18.1876 0.0014 1.1626 0.00012 2.4464 0.00027 23.3
#4 18.2438 0.0011 1.1656 0.00010 2.4504 0.00022 26.4
#5 18.2442 0.0012 1.1655 0.00011 2.4503 0.00025 24.4
#6 18.1864 0.0014 1.1629 0.00014 2.4465 0.00034 30.3
Cape Fugui 18.1982 0.0011 1.1632 0.00011 2.4433 0.00024 4.91
Dust storm 18.1658 0.0011 1.1625 0.00010 2.4429 0.00025 17.3
Transition 18.0900 0.0012 1.1582 0.00011 2.4352 0.00024 12.4
Table 3. Pb concentration and Pb isotope ratios of PM10 samples collected during each event type in central
Taiwan.
Table S1). PM10 collected during this period provided more radiogenic results compared with those during local
events, with a 206Pb/207Pb ratio of 1.163–1.166 and a 208Pb/207Pb ratio of 2.446–2.451 (Table 3; Fig. 4b).
High Pb isotope ratios indicated that contaminants may have originated from China because such ratios
in aerosol samples have commonly been observed there. An earlier study investigated the Pb isotope ratios in
airborne particles in urban and suburban areas of G uangzhou62, revealing average Pb isotope ratios during win-
ter of 1.1631 ± 0.0058 and 2.4579 ± 0.0081 for Pb/207Pb and 208Pb/207Pb, respectively (Fig. 4b). More recently,
206
similar Pb isotope ratios (206Pb/207Pb = 1.1675 ± 0.0040 and 208Pb/207Pb = 2.4491 ± 0.0066) were observed in PM2.5
in Guangzhou, suggesting that such ratios in PM have remained high in the PRD63. According to relevant stud-
ies, coal combustion became the major source of Pb in the atmosphere after the phasing-out of leaded gasoline,
leading to more radiogenic isotope ratios being observed for particles in the atmosphere in C hina64,65. High Pb
isotopic ratios were also reported for aerosols in areas with high levels of industrial emissions46,66–69 (Fig. 4b).
Thus, the high Pb isotope ratios in our P M10 samples collected during the LRT event along with low Fe/Al and
high Cd/Pb ratios suggested that the pollutants were most likely transported from China to Taiwan; furthermore,
these signals were not observed during the local events. During the LRT event, P M10 collected at Cape Fugui (a
regional background site for monitoring LRT from outside Taiwan located at the northern tip of Taiwan) also
exhibited similar Pb isotope ratios (206Pb/207Pb = 1.163 and 208Pb/207Pb = 2.443, Fig. 4b).
During the dust storm event (10/30–31, 2019), the air mass back trajectory revealed that the air parcels pri-
marily originated from Northern China and passed through Shanghai, a megacity and economic center in East
China, before reaching Taiwan (Supplementary Fig. S4). The dust-mixing ratio estimated by the EAC4 reanalysis
indicated that the dust storm was mainly derived from Northern China, with the dust plume gradually being
transported to East China (Supplementary Fig. S6). When the dust storm passed through Shanghai, a nitric
acid plume derived from East China gradually moved southward to the Taiwan Strait (Supplementary Fig. S7).
During this dust event, PM10 samples were collected for 2 days consecutively at site #5. The results indicated that
PM10 had higher Pb isotope ratios on the first day of sampling, with 206Pb/207Pb = 1.163 and 208Pb/207Pb = 2.443,
whereas the Pb isotope ratios rapidly changed to lower values on the second day, with 206Pb/207Pb = 1.158 and
Scientific Reports | (2021) 11:7593 | https://doi.org/10.1038/s41598-021-87051-y 9
Vol.:(0123456789)www.nature.com/scientificreports/
Figure 5. MixSIAR model outputs of the relative contributions (mean value, with the upper and lower bounds
being the 2.5% and 97.5% credible intervals, see Supplementary Table S2) from each end-member to Pb in P M10
at each site during the local events.
208
Pb/207Pb = 2.435 (Fig. 4b). The EFs of most metals in the P M10 collected during the dust storm event were low
(< 343, Fig. 2), indicating that the P M10 was a mixture of pollutants and natural dust. This was further supported
by the elevated Al concentrations (2324 ng/m3) in the collected samples. The Pb isotope ratios of P M10 on the
first day reflected that this dust storm collected pollutants in East China and then transported them to Taiwan, as
depicted by the reanalysis dataset and the higher Pb isotope ratios found in PM from East China. On the second
day of sampling during the dust event (defined as Transition), the Pb isotope ratios of PM10 decreased toward
those detected during the local events, suggesting that the contribution from local emissions (oil combustion/
refineries) became dominant. This again confirmed that oil combustion and oil refineries (characterized by low
Pb isotopic compositions) are the major sources of Pb in P M10 in central Taiwan.
Estimating the relative contribution to Pb in PM10. Because distinctive Pb isotope ratios were found
for each end-member, we were able to estimate their relative contributions to Pb in P M10. We adopted a ternary
mixing model to calculate the relative contributions to Pb in P
M10 using the following equations:
3
RPM10 = fi Ri (1)
i=1
3
fi = 1 (2)
i=1
where RPM10 is the observed 206Pb/207Pb (or 208Pb/207Pb) ratio of PM10, Ri is the assumed 206Pb/207Pb (or
208
Pb/207Pb) ratio for each end-member, and fi is the fraction of the contribution of each end-member.
The end-members discussed in this study (i.e., oil combustion/refineries, coal combustion, and sediments)
were assigned accordingly, as shown in Fig. 4a. We assumed that the end-member oil combustion/refineries were
the average isotopic signatures of the oil products (gasoline and diesel, 206Pb/207Pb = 1.146 and 208Pb/207Pb = 2.425)
investigated in Taiwan and assumed that the end-member coal combustion was the average isotopic signature
of Australian coal (206Pb/207Pb = 1.206 and 208Pb/207Pb = 2.487) since Australian coal occupied half of the coal
imported into Taiwan. The Pb isotope ratios for the mixture of Australian coal and Indonesian coal (by import
proportion) are also very close to those of Australian coal; therefore, we simplified the calculation by using Aus-
tralian coal as the end-member. We also assumed that the end-member natural material was the average isotopic
signature of sediments (206Pb/207Pb = 1.179 and 208Pb/207Pb = 2.479) collected in this study.
A Bayesian mixing model, MixSIAR70,71, was employed to calculate each end-member contribution to Pb in
PM10. This model incorporates the uncertainties of the isotopic signatures for each source, and it was successfully
applied to assess Pb sources in isotopic mixtures q uantitatively72. The model results revealed the contribution
from oil combustion to be predominant (48–88%) during the local events, whereas coal combustion made a
minor contribution (< 21%) in central Taiwan (Supplementary Table S2, Fig. 5). On the other hand, contribu-
tions from sediments increased significantly from 13 to 31% during the high-wind-speed event and were highly
variable among sites. The high proportions of oil combustion suggested an approach for mitigating emissions
in the future.
During the LRT and dust storm events, the Pb isotope ratios of PM10 might have been overprinted by pol-
lutants derived from China (as shown in Fig. 4b), and further complicated the contribution estimations. In such
cases, Pb in P M10 was assumed to be dominated by the LRT of pollutants, and the approach presented here should
be able to delineate the PM10 sources if the primary sources of Pb can be better constrained.
Scientific Reports | (2021) 11:7593 | https://doi.org/10.1038/s41598-021-87051-y 10
Vol:.(1234567890)www.nature.com/scientificreports/
Concluding remarks
This study investigated the chemical characteristics and sources of P M10 during various events of the 2018/2019
northeast monsoon season in central Taiwan. High concentrations of ionic species were found during the low-
wind-speed local event, suggesting that local pollutants accumulated when the atmospheric condition stagnated.
By contrast, high concentrations of crustal elements (e.g., Al, Fe, and Ti) were found during the high-wind-
speed local event, suggesting the enhanced influence of local sediments. By employing EFs, elemental ratios,
and Pb isotope ratios, we revealed an evident variation in the contributions from local sources. For instance,
oil combustion was enriched in V and Ni and had the lowest Pb isotope ratios. Coal combustion was enriched
in As, Sb, and Pb and had the highest Pb isotope ratios. Sediments were characterized by the unity of EFs and
moderate Pb isotope ratios.
This study also included a ternary mixing model of Pb isotopes for the source apportionment of Pb in PM10 in
central Taiwan. The contribution of Pb was dominated by oil combustion/refineries during local events (48–88%),
whereas the contributions from coal combustion were lower (< 21%). The contributions from sediments were
increased from 13 to 31% when the wind speed became high. All of the results were supported by the chemical
characteristics of PM10 and the reanalysis dataset. Furthermore, a strong correlation (r = 0.89, p < 0.001, multiple
regression analysis) between P M10 mass and the concentrations of Pb, V, and Al was observed in the study area,
suggesting that the sources of PM10 in central Taiwan can be possibly tracked by using these chemical charac-
teristics of P
M10. By combining Pb isotope ratios, elemental ratios, EFs, and the reanalysis dataset, this study
improved the constraints of PM10 sources during different events. Moreover, we demonstrated a multi-tracer
approach to understand transport and the contributions of Pb in P M10 from various sources, which serves as a
powerful tool for delineating complex atmospheres impacted by complex emission sources.
Materials and methods
Sampling site and PM10 collection. PM10 sampling was conducted at six sites located in the rural-fringe
areas of Changhua, Yunlin, and Chiayi Counties in central Taiwan (Fig. 1), where the air quality is reported to
be among the worst in T aiwan73. Several obvious anthropogenic sources of PM exist, such as a coal-fired power
plant (one of the largest in the world) in Taichung City, Changhua coastal industrial park in Changhua County,
and a petrochemical complex (including a coal-fired power plant) in Yunlin County. Moreover, sediments in the
Choshui River catchment are the major source of PM derived from natural materials. Details about the sampling
sites, sampling period, wind speed, wind direction, temperature, precipitation, and relative humidity are sum-
marized in Table 1. A total of five sampling campaigns were conducted during the northeast monsoon season
to collect PM10 samples under different types of events, including three local events in 2018, one LRT event,
and one dust storm event in 2019. Each event type was defined based on meteorological data, announcements
provided by the TEPA, air mass back trajectory analysis (Hybrid Single Particle Lagrangian Integrated Trajec-
tory [HYSPLIT]), the global reanalysis dataset (EAC4), N Ox/O3 ratio, and Al concentration in P M10. The LRT
event was defined as having air masses originating from potential high emission regions outside Taiwan (e.g.,
megacities in the coastal regions of China, see Supplementary Figs. S3 and S4), apparent transport of nitric acid
to Taiwan (Supplementary Fig. S5), and a low ratio of NOx/O3 (see Supplementary Fig. S1). The low NOx/O3
ratio reflected that the air mass could have been transported from long distances, as NOx has a shorter lifetime
than O3 in the atmosphere74, and NOx gets reacted faster than O3 during long-range transport. In contrast to
the LRT event, a local event did not have the conditions mentioned above. A dust storm event was defined as air
masses originating from Northern China (Supplementary Fig. S4), southeastward transportation of dust (Sup-
plementary Fig. S6), and Al concentration > 1400 ng/m3 in PM1075. The local events were further divided into
low-, moderate-, and high-wind-speed events based on the Beaufort wind s cale76 of < 3.3 m/s (calm, light air, and
light breeze), 3.3–8 m/s (gentle breeze, moderate breeze), and > 8 m/s (fresh breeze, strong breeze), respectively.
Note that the PM10 samples were only collected at site #5 during the dust storm event because only one sampler
was available.
PM10 samples were collected following the TEPA PM10 sampling protocol (NIEA A208). In brief, PM10 sam-
ples were collected at a flow rate of 66 ± 3 m3 h−1 on a polytetrafluoroethylene (PTFE) filter using a high-volume
sampler (Tisch Environmental., Cleves, OH, USA) with a size-selective inlet (10 μm) attached on the rooftop
(approximately 10 m above ground level). The sampling was conducted for 8–28 h, except for site #2 (2 h) on
Nov 25, 2018. After collection, the filter was transferred into a plastic envelope and delivered to the conditioning
room within a few hours. Furthermore, a total of 13 sediment samples were collected from eight sites (Fig. 1) to
constrain the chemical and isotope signals of the natural source. The sediment samples were collected in both
upstream and downstream segments of the Choshui River catchment with plastic bags, dried at 45 °C in an oven,
ground and sieved through a 75 μm sieve, and stored in a desiccator.
Chemical analysis. The PTFE filter was weighted for particle mass concentration with a microbalance after
equilibration at 25 ± 1.5 °C under a relative humidity of 40% ± 5% for 24 h. Next, 1/9 of the filter was cut using
a ceramic cutter, and the aliquot was then digested with an acid mixture of 9 mL of concentrated HNO3, 3 mL
of concentrated HCl, and 3 mL of concentrated HF using a microwave (CEM Corp., Matthews, NC, USA). A
two-stage heating procedure was employed; first, the mixture was heated to 170 °C over 20 min and maintained
at this temperature for 10 min, followed by another round of heating to 200 °C over 7 min and maintaining for
10 min. After cooling, the solution was transferred into a PFA beaker and evaporated. The dried sample was re-
dissolved with an acid mixture of 2 mL of concentrated HNO3 and 1 mL of concentrated HCl, and finally diluted
to 50 mL with Milli-Q water. Ultrapure concentrated acids and Milli-Q water were used for sample preparation
in this study. For sediment samples, 100 mg of sediment was weighed and digested following the aforementioned
procedure. A total of 23 elements, including major and trace metal concentrations, were analyzed by using
Scientific Reports | (2021) 11:7593 | https://doi.org/10.1038/s41598-021-87051-y 11
Vol.:(0123456789)www.nature.com/scientificreports/
Q-ICP-MS (Agilent 7700X) with internal standards (Sc, Y, Rh, Tb, Lu, and Bi) to monitor the instrumental drift
and matrix effect (NIEA M105); the analytical precision was better than 10% (RSD). The method detection limit
for each element was determined by field blanks, as presented in Supplementary Table S4. For each batch of the
sample digestion, the accuracy of metal analysis was examined according to two international standards, NIST
SRM 1648a (urban PM) and NIES No. 30 (Gobi Kosa dust). The results of metal concentrations and recoveries
for NIST SRM 1648a and NIES No. 30 are summarized in Supplementary Tables S5 and S6, respectively.
For the ion concentration, a sample aliquot of the filter was extracted with 50 mL of Milli-Q water in an ultra-
sonic bath for 30 min, followed by settling for 30 min. The solution was then filtered through a 0.45 μm PVDF
filter (Merck KGaA, Darmstadt, Germany). Ion concentrations ( SO42−, NO3−, NH4+, and C l−) were measured
using ion chromatography (Thermo-Fisher Scientific, Waltham, MA, USA) with analytical precision better than
10% (RSD).
Pb isotope analysis. An aliquot of the digested sample was transferred into an acid-cleaned PFA beaker.
This solution was evaporated and re-dissolved with 2 mL of 2 M HNO3 and 0.07 M HF. The Pb fraction was
extracted using Sr-spec ion exchange resin (Eichrom Technologies Inc., Lisle, IL, USA) following the steps modi-
fied from Pin et al.77. An international reference material (NIST 1648a) was also processed for each purification
batch to assess the column chemistry performance. Pb was purified under a Class-10 laminar flow bench in
a Class-10,000 clean room. The total procedural blanks for Pb were < 80 pg. Pb isotope ratios were measured
using HR-MC-ICP-MS (Neptune PLUS, Thermo-Fisher Scientific) at the Institute of Earth Sciences, Academia
Sinica (AS-IES). Standards and samples were doped with thallium (Tl) (NIST 997; 203Tl/205Tl ratio of 0.418673)
to correct for instrumental mass fractionation78. Two standard reference materials (NIST SRM 981 and NIST
SRM 1648a) were analyzed to assess the accuracy and long-term precision of the analytical protocol developed
at AS-IES. The measured Pb isotope ratios for these international reference materials were in good agreement
with the recommended values and are listed in Supplementary Table S7. The analytical uncertainties (2SD)
for 206Pb/207Pb and 208Pb/207Pb were ± 0.0002 (n = 69) and ± 0.0003 (n = 69), respectively. Pb isotope ratios were
reported as 206Pb/207Pb and 208Pb/207Pb in this study.
Enrichment factor. The EF has been widely used to examine the contributions from natural and anthropo-
genic sources in aerosols79–81. The EF of elements was calculated using Eq. (3):
(Xi /Al)PM
EF = (3)
(Xi /Al)Crust
where (Xi/Al)PM is the concentration ratio of element Xi to Al in PM, and (Xi/Al)Crust is the concentration ratio of
element Xi to Al in the upper continental c rust61. In general, EF values close to unity indicate the predominance
of crustal sources; EF values ≥ 5 indicate a significant contribution from noncrustal sources; and EF values higher
than 10 indicate essentially anthropogenic o rigins24,80,82.
Reanalysis datasets. The EAC4 global reanalysis dataset provided by the Copernicus Atmosphere Moni-
toring Service (CAMS) was applied to provide additional constraints on the sources and transportation of pol-
lutants in this study. EAC4 reanalysis combines model data with global observations into a globally complete and
consistent dataset; the dataset used in this study was generated using CAMS information (2020)83. The spatial
resolution of the dataset was 0.75° latitude by 0.75° longitude, with a temporal resolution of 3 h.
In addition, air mass back trajectory analysis was used to track the origins of the air parcels transported
to the study sites. Back trajectories were calculated using the HYSPLIT model maintained by the US National
Oceanographic and Atmospheric Administration with a spatial resolution of 1° latitude by 1° longitude in the
meteorological dataset84.
Received: 17 January 2021; Accepted: 23 March 2021
References
1. Lohmann, U. & Feichter, J. Global indirect aerosol effects: A review. Atmos. Chem. Phys. 5, 715–737 (2005).
2. Zhang, X. Y. et al. Atmospheric aerosol compositions in China: Spatial/temporal variability, chemical signature, regional haze
distribution and comparisons with global aerosols. Atmos. Chem. Phys. 12, 779–799 (2012).
3. Peters, A., Dockery Douglas, W., Muller James, E. & Mittleman Murray, A. Increased particulate air pollution and the triggering
of myocardial infarction. Circulation 103, 2810–2815 (2001).
4. Pope, C. A. et al. Lung cancer, cardiopulmonary mortality, and long-term exposure to fine particulate air pollution. JAMA 287,
1132–1141 (2002).
5. Kim, K.-H., Kabir, E. & Kabir, S. A review on the human health impact of airborne particulate matter. Environ. Int. 74, 136–143
(2015).
6. Järup, L. Hazards of heavy metal contamination. Br. Med. Bull. 68, 167–182 (2003).
7. Jaishankar, M., Tseten, T., Anbalagan, N., Mathew, B. B. & Beeregowda, K. N. Toxicity, mechanism and health effects of some heavy
metals. Interdiscip. Toxicol. 7, 60–72 (2014).
8. Klimont, Z. et al. Global anthropogenic emissions of particulate matter including black carbon. Atmos. Chem. Phys. 17, 8681–8723
(2017).
9. Pacyna, J. M. & Pacyna, E. G. An assessment of global and regional emissions of trace metals to the atmosphere from anthropogenic
sources worldwide. Environ. Rev. 9, 269–298 (2001).
10. Klimont, Z., Smith, S. J. & Cofala, J. The last decade of global anthropogenic sulfur dioxide: 2000–2011 emissions. Environ. Res.
Lett. 8, 014003 (2013).
Scientific Reports | (2021) 11:7593 | https://doi.org/10.1038/s41598-021-87051-y 12
Vol:.(1234567890)www.nature.com/scientificreports/
11. Tian, H. Z. et al. Quantitative assessment of atmospheric emissions of toxic heavy metals from anthropogenic sources in China:
Historical trend, spatial distribution, uncertainties, and control policies. Atmos. Chem. Phys. 15, 10127–10147 (2015).
12. Zhu, C., Tian, H. & Hao, J. Global anthropogenic atmospheric emission inventory of twelve typical hazardous trace elements,
1995–2012. Atmos. Environ. 220, 117061 (2020).
13. Lee, S. et al. Characteristic concentrations and isotopic composition of airborne lead at urban, rural and remote sites in western
Korea. Environ. Pollut. 254, 113050 (2019).
14. Mukai, H., Tanaka, A., Fujii, T. & Nakao, M. Lead isotope ratios of airborne particulate matter as tracers of long-range transport
of air pollutants around Japan. J. Geophys. Res. Atmos. 99, 3717–3726 (1994).
15. Shimamura, T., Iijima, S., Iwashita, M., Hattori, M. & Takaku, Y. Lead isotopes in rainfall collected by a sequential sampler in
suburban Tokyo. Atmos. Environ. 41, 3797–3805 (2007).
16. Gallon, C. et al. Asian industrial lead inputs to the north pacific evidenced by lead concentrations and isotopic compositions in
surface waters and aerosols. Environ. Sci. Technol. 45, 9874–9882 (2011).
17. Ewing, S. A. et al. Pb isotopes as an indicator of the Asian contribution to particulate air pollution in urban California. Environ.
Sci. Technol. 44, 8911–8916 (2010).
18. Bollhöfer, A. & Rosman, K. J. R. Isotopic source signatures for atmospheric lead: The Northern Hemisphere. Geochim. Cosmochim.
Acta 65, 1727–1740 (2001).
19. Zdanowicz, C. et al. Asian dustfall in the St. Elias Mountains, Yukon, Canada. Geochim. Cosmochim. Acta 70, 3493–3507 (2006).
20. Hsu, S.-C. et al. Lead isotope ratios in ambient aerosols from Taipei, Taiwan: Identifying long-range transport of airborne Pb from
the Yangtze Delta. Atmos. Environ. 40, 5393–5404 (2006).
21. Lin, C.-Y. et al. Long-range transport of aerosols and their impact on the air quality of Taiwan. Atmos. Environ. 39, 6066–6076
(2005).
22. Liu, T.-H. et al. Southeastward transport of Asian dust: Source, transport and its contributions to Taiwan. Atmos. Environ. 43,
458–467 (2009).
23. Jung, C.-C. et al. C-Sr-Pb isotopic characteristics of P M2.5 transported on the East-Asian continental outflows. Atmos. Res. 223,
88–97 (2019).
24. Chen, Y.-C. et al. Characteristics of concentrations and metal compositions for P M2.5 and PM2.5_10 in Yunlin county, Taiwan during
air quality deterioration. Aerosol Air Qual. Res. 15, 2571–2583 (2015).
25. Hsu, C.-Y. et al. Elemental characterization and source apportionment of PM10 and PM2.5 in the western coastal area of central
Taiwan. Sci. Total Environ. 541, 1139–1150 (2016).
26. Hsu, C.-Y. et al. Ambient PM2.5 in the residential area near industrial complexes: Spatiotemporal variation, source apportionment,
and health impact. Sci. Total Environ. 590–591, 204–214 (2017).
27. Kuo, C.-Y. et al. Spatial variations of the aerosols in river-dust episodes in central Taiwan. J. Hazard. Mater. 179, 1022–1030 (2010).
28. Flegal, A. R. & Smith, D. R. In Reviews of Environmental Contamination and Toxicology: Continuation of Residue Reviews (ed Ware
G. W.) 1–45 (Springer New York, 1995).
29. Gross, B. H. et al. Constraining recent lead pollution sources in the North Pacific using ice core stable lead isotopes. J. Geophys.
Res. Atmos. 117, D16307 (2012).
30. Lahd Geagea, M., Stille, P., Gauthier-Lafaye, F. & Millet, M. Tracing of industrial aerosol sources in an urban environment using
Pb, Sr, and Nd isotopes. Environ. Sci. Technol. 42, 692–698 (2008).
31. Widory, D., Liu, X. & Dong, S. Isotopes as tracers of sources of lead and strontium in aerosols (TSP & P M2.5) in Beijing. Atmos.
Environ. 44, 3679–3687 (2010).
32. Chifflet, S. et al. Origins and discrimination between local and regional atmospheric pollution in Haiphong (Vietnam), based on
metal(loid) concentrations and lead isotopic ratios in P M10. Environ. Sci. Pollut. Res. 25, 26653–26668 (2018).
33. Das, R., Bin Mohamed Mohtar, A. T., Rakshit, D., Shome, D. & Wang, X. Sources of atmospheric lead (Pb) in and around an Indian
megacity. Atmos. Environ. 193, 57–65 (2018).
34. Rosman, K. J. R., Chisholm, W., Boutron, C. F., Candelone, J. P. & Görlach, U. Isotopic evidence for the source of lead in Greenland
snows since the late 1960s. Nature 362, 333–335 (1993).
35. Han, C. et al. High-resolution isotopic evidence for a potential Saharan provenance of Greenland glacial dust. Sci. Rep. 8, 15582
(2018).
36. World Health Organization. Regional Office for, E. Air quality guidelines global update 2005: particulate matter, ozone, nitrogen
dioxide and sulfur dioxide https://apps.who.int/iris/handle/10665/107823 (WHO Regional Office for Europe, 2006).
37. Chow, J. C. Measurement methods to determine compliance with ambient air quality standards for suspended particles. J. Air
Waste Manag. Assoc. 45, 320–382 (1995).
38. Weckwerth, G. Verification of traffic emitted aerosol components in the ambient air of Cologne (Germany). Atmos. Environ. 35,
5525–5536 (2001).
39. Kuo, C.-Y., Wang, J.-Y., Chang, S.-H. & Chen, M.-C. Study of metal concentrations in the environment near diesel transport routes.
Atmos. Environ. 43, 3070–3076 (2009).
40. Lin, Y.-C., Hsu, S.-C., Lin, S.-H. & Huang, Y.-T. Metallic elements emitted from industrial sources in Taiwan: Implications for
source identification using airborne PM. Atmos. Pollut. Res. 11, 766–775 (2020).
41. Zhang, X. Y., Arimoto, R. & An, Z. S. Dust emission from Chinese desert sources linked to variations in atmospheric circulation.
J. Geophys. Res. Atmos. 102, 28041–28047 (1997).
42. Zhang, R. et al. Elemental profiles and signatures of fugitive dusts from Chinese deserts. Sci. Total Environ. 472, 1121–1129 (2014).
43. Mazzei, F. et al. Characterization of particulate matter sources in an urban environment. Sci. Total Environ. 401, 81–89 (2008).
44. Viana, M. et al. Chemical tracers of particulate emissions from commercial shipping. Environ. Sci. Technol. 43, 7472–7477 (2009).
45. Salameh, D. et al. PM2.5 chemical composition in five European Mediterranean cities: A 1-year study. Atmos. Res. 155, 102–117
(2015).
46. Xu, H. M. et al. Metallic elements and Pb isotopes in P M2.5 in three Chinese typical megacities: Spatial distribution and source
apportionment. Environ. Sci. Process. Impacts 22, 1718–1730 (2020).
47. Desboeufs, K. V., Sofikitis, A., Losno, R., Colin, J. L. & Ausset, P. Dissolution and solubility of trace metals from natural and
anthropogenic aerosol particulate matter. Chemosphere 58, 195–203 (2005).
48. Dwivedi, D., Agarwal, A. K. & Sharma, M. Particulate emission characterization of a biodiesel vs diesel-fuelled compression igni-
tion transport engine: A comparative study. Atmos. Environ. 40, 5586–5595 (2006).
49. Hsu, S.-C. et al. A super Asian dust storm over the East and South China Seas: Disproportionate dust deposition. J. Geophys. Res.
Atmos. 118, 7169–7181 (2013).
50. Peltier, R. E., Hsu, S.-I., Lall, R. & Lippmann, M. Residual oil combustion: A major source of airborne nickel in New York City. J.
Eposure Sci. Environ. Epidemiol. 19, 603–612 (2009).
51. Hsu, S.-C. et al. Variations of Cd/Pb and Zn/Pb ratios in Taipei aerosols reflecting long-range transport or local pollution emis-
sions. Sci. Total Environ. 347, 111–121 (2005).
52. Bressi, M. et al. Sources and geographical origins of fine aerosols in Paris (France). Atmos. Chem. Phys. 14, 8813–8839 (2014).
53. Yang, F. et al. Characteristics of PM2.5 speciation in representative megacities and across China. Atmos. Chem. Phys. 11, 5207–5219
(2011).
Scientific Reports | (2021) 11:7593 | https://doi.org/10.1038/s41598-021-87051-y 13
Vol.:(0123456789)www.nature.com/scientificreports/
54. Pacyna, J. M., Pacyna, E. G. & Aas, W. Changes of emissions and atmospheric deposition of mercury, lead, and cadmium. Atmos.
Environ. 43, 117–127 (2009).
55. Taiwan, B. O. E. Energy Statistics Handbook (Bureau of Energy, Ministry of Economic Affairs., 2019).
56. Yao, P.-H. et al. Lead isotope characterization of petroleum fuels in Taipei, Taiwan. Int. J. Environ. Res. Public Health 12, 4602–4616
(2015).
57. Díaz-Somoano, M. et al. Stable lead isotope compositions in selected coals from around the world and implications for present
day aerosol source tracing. Environ. Sci. Technol. 43, 1078–1085 (2009).
58. Bi, X.-Y. et al. Lead isotopic compositions of selected coals, Pb/Zn ores and fuels in china and the application for source tracing.
Environ. Sci. Technol. 51, 13502–13508 (2017).
59. Lin, C.-W. & Yeh, J.-F. Estimating dust emission from a sandbank on the downstream Jhuoshuei River under strong wind condi-
tions. Atmos. Environ. 41, 7553–7561 (2007).
60. Lin, C.-Y. et al. Impact of river-dust events on air quality of western Taiwan during winter monsoon: Observed evidence and model
simulation. Atmos. Environ. 192, 160–172 (2018).
61. Taylor, S. R. & McLennan, S. M. The geochemical evolution of the continental crust. Rev. Geophys. 33, 241–265 (1995).
62. Lee, C. S. L. et al. Heavy metals and Pb isotopic composition of aerosols in urban and suburban areas of Hong Kong and Guangzhou,
South China—Evidence of the long-range transport of air contaminants. Atmos. Environ. 41, 432–447 (2007).
63. Ming, L. L. Fine Atmospheric Particles (PM2.5) in Large City Clusters, China: Chemical Compositions, Temporal-Spatial Variations
and Regional Transport (The Hong Kong Polytechnic University, 2016).
64. Chen, J. et al. A lead isotope record of Shanghai atmospheric lead emissions in total suspended particles during the period of
phasing out of leaded gasoline. Atmos. Environ. 39, 1245–1253 (2005).
65. Cheng, H. & Hu, Y. Lead (Pb) isotopic fingerprinting and its applications in lead pollution studies in China: A review. Environ.
Pollut. 158, 1134–1146 (2010).
66. Zheng, J. et al. Characteristics of lead isotope ratios and elemental concentrations in PM10 fraction of airborne particulate matter
in Shanghai after the phase-out of leaded gasoline. Atmos. Environ. 38, 1191–1200 (2004).
67. Tan, M. G. et al. Comprehensive study of lead pollution in Shanghai by multiple techniques. Anal. Chem. 78, 8044–8050 (2006).
68. Chen, J. et al. Characteristics of trace elements and lead isotope ratios in PM2.5 from four sites in Shanghai. J. Hazard. Mater. 156,
36–43 (2008).
69. Hu, X. et al. Lead contamination and transfer in urban environmental compartments analyzed by lead levels and isotopic composi-
tions. Environ. Pollut. 187, 42–48 (2014).
70. Brian C. Stock, B. X. S. MixSIAR GUI User Manual. Version 3.1.https://doi.org/10.5281/zenodo.1209993
71. Stock, B. C. et al. Analyzing mixing systems using a new generation of Bayesian tracer mixing models. PeerJ 6, e5096 (2018).
72. Longman, J. et al. Quantitative assessment of Pb sources in isotopic mixtures using a Bayesian mixing model. Sci. Rep. 8, 6154
(2018).
73. Taiwan EPA. Air Quality Annual Report of R.O.C. (Taiwan) https://w ww.e pa.g ov.t w/D
ispla yFile.a spx?F
ileID=6 DF52F
28D8A
44EC3
(2019).
74. Seinfeld, J. H. & Pandis, S. N. Atmospheric Chemistry and Physics: From Air Pollution to Climate Change (1998).
75. Hsu, S.-C. et al. A criterion for identifying Asian dust events based on Al concentration data collected from northern Taiwan
between 2002 and early 2007. J. Geophys. Res. Atmos. 113, D18306 (2008).
76. Barua, D. K. In Encyclopedia of Coastal Science (ed Schwartz, M. L.) 186–186 (Springer Netherlands, 2005).
77. Pin, C. & Gannoun, A. Integrated extraction chromatographic separation of the lithophile elements involved in long-lived radio-
genic isotope systems (Rb–Sr, U-Th–Pb, Sm–Nd, La–Ce, and Lu–Hf) useful in geochemical and environmental sciences. Anal.
Chem. 89, 2411–2417 (2017).
78. Weiss, D. J. et al. Accurate and precise Pb isotope ratio measurements in environmental samples by MC-ICP-MS. Int. J. Mass
Spectrom. 232, 205–215 (2004).
79. Simonetti, A., Gariépy, C. & Carignan, J. Pb and Sr isotopic evidence for sources of atmospheric heavy metals and their deposition
budgets in northeastern North America. Geochim. Cosmochim. Acta 64, 3439–3452 (2000).
80. Gao, Y. et al. Characterization of atmospheric trace elements on PM2.5 particulate matter over the New York-New Jersey harbor
estuary. Atmos. Environ. 36, 1077–1086 (2002).
81. Chester, R., Nimmo, M., Fones, G. R., Keyse, S. & Zhang, Z. Trace metal chemistry of particulate aerosols from the UK mainland
coastal rim of the NE Irish sea. Atmos. Environ. 34, 949–958 (2000).
82. Merešová, J. et al. Evaluation of elemental content in air-borne particulate matter in low-level atmosphere of Bratislava. Atmos.
Environ. 42, 8079–8085 (2008).
83. Inness, A. et al. The CAMS reanalysis of atmospheric composition. Atmos. Chem. Phys. 19, 3515–3556 (2019).
84. Stein, A. F. et al. NOAA’s HYSPLIT atmospheric transport and dispersion modeling system. Bull. Am. Meteor. Soc. 96, 2059–2077
(2016).
Acknowledgements
Drs. Mao-Chang Liang and Der-Chuen Lee are thanked for helpful discussion during manuscript preparation.
We thank the Editor and two anonymous reviewers for constructive comments which improved the manuscript.
This study was supported by Taiwan Environmental Protection Administration (EPA-106-E3S3-02-01), Min-
istry of Science and Technology (MOST 104-2628-M-001-007-MY3), and Academia Sinica to K.-F.H. P.-C.W.
acknowledges supports by a graduate scholarship from TIGP, Academia Sinica.
Author contributions
K.-F.H. and P.-C.W. designed the study. P.-C.W. performed the analyses with help from K.-F. H. P.-C.W. wrote
the manuscript with input from K.-F.H. All authors read and commented on the manuscript.
Competing interests
The authors declare no competing interests.
Additional information
Supplementary Information The online version contains supplementary material available at https://doi.org/
10.1038/s41598-021-87051-y.
Correspondence and requests for materials should be addressed to K.-F.H.
Reprints and permissions information is available at www.nature.com/reprints.
Scientific Reports | (2021) 11:7593 | https://doi.org/10.1038/s41598-021-87051-y 14
Vol:.(1234567890)www.nature.com/scientificreports/
Publisher’s note Springer Nature remains neutral with regard to jurisdictional claims in published maps and
institutional affiliations.
Open Access This article is licensed under a Creative Commons Attribution 4.0 International
License, which permits use, sharing, adaptation, distribution and reproduction in any medium or
format, as long as you give appropriate credit to the original author(s) and the source, provide a link to the
Creative Commons licence, and indicate if changes were made. The images or other third party material in this
article are included in the article’s Creative Commons licence, unless indicated otherwise in a credit line to the
material. If material is not included in the article’s Creative Commons licence and your intended use is not
permitted by statutory regulation or exceeds the permitted use, you will need to obtain permission directly from
the copyright holder. To view a copy of this licence, visit http://creativecommons.org/licenses/by/4.0/.
© The Author(s) 2021
Scientific Reports | (2021) 11:7593 | https://doi.org/10.1038/s41598-021-87051-y 15
Vol.:(0123456789)You can also read