Wisdom of crowds detects COVID 19 severity ahead of officially available data - Nature
←
→
Page content transcription
If your browser does not render page correctly, please read the page content below
www.nature.com/scientificreports
OPEN Wisdom of crowds detects
COVID‑19 severity ahead
of officially available data
Jeremy Turiel, Delmiro Fernandez‑Reyes *
& Tomaso Aste*
During the unfolding of a crisis, it is crucial to forecast its severity at an early stage , yet access to
reliable data is often challenging early on. The wisdom of crowds has been effective at forecasting in
similar scenarios. We investigated whether the initial regional social media reaction to the emerging
COVID-19 pandemic in three critically affected countries has significant relations with their observed
mortality a month later. We obtained COVID-19 related regionally geolocated tweets from Italian,
Spanish, and United States regions. We quantified the predictive power of the wisdom of the crowds
using correlations and regressions of geolocated Tweet Intensity (TI) during the initial social media
attention peak versus the cumulative number of deaths a month ahead. We found that the intensity
of initial COVID-19 related tweet attention at the beginning of the pandemic across Italian, Spanish,
and United States regions is significantly related (p < 0.001) to the extent to which these regions had
been affected by the pandemic a month later. This association is most striking in Italy as when at its
peak of TI in late February 2020 only two of its regions had reported mortality. The collective wisdom
of the crowds at early stages of the pandemic, when information on the number of infections was
not broadly available, strikingly predicted the extent of mortality reflecting the regional severity of
the pandemic almost a month later. Our findings could underpin the creation of real-time novelty
detection systems aimed at early reporting of the severity of crises impacting a territory leading to
early activation of control measures at a stage when available data is extremely limited.
Since its outbreak in early 2020, the novel coronavirus pneumonia COVID-191, has infected an estimated total
of 172 million individuals across virtually all the world’s countries with over 3.5 million related deaths recorded
globally2.
Predicting the spread and forecasting the severity of the COVID- pandemic has become the focus of many
research teams across the g lobe3–6. There is a shared agreement that forecasting the spread, growth and severity
of the COVID-19 pandemic is a challenging task especially in our globally interconnected world. In this context,
reliable prediction of contagion, growth and fatalities within countries and the regions in each country, before
data is available and widely openly distributed, is essentially impossible. Despite this challenge, it is recognized
that this knowledge is extremely useful in order to establish targeted confinement areas to contain virus spread
more effectively while reducing the economic and social disruptions due to lockdown and social distancing
strategies which in turn would also allow to allocate resources efficiently across regions.
Although forecasting a country’s regional spread of COVID-19 severity and its associated mortality is critical
to implement operational healthcare changes and epidemiological control measures, this was nearly impossible
to achieve given the lack of readily available data at the beginning of the emerging SARS-CoV-2 pandemic. To
address the challenge of gaining these insights at the onset of a pandemic, when there is a lack of widely accessible
regional-level official data, in the present work we analysed openly available data from Twitter activity across
different Italian, Spanish and United States regions to estimate crowd perception of the severity of the event. The
collective knowledge of a crowd has been used successfully in similar challenging forecasting scenarios across
social and data sciences where it has been established that collective opinions formed by a group of individu-
als can sometimes be more accurate than individual expert opinions. This phenomenon has been named “the
wisdom of crowds”. As opposed to the common practice of using web-search engine queries that only indicate
seeking knowledge patterns, we focused on assessing the wisdom of crowds as represented in the social media
Twitter platform. We therefore aggregated social media reaction, expressed by geolocated tweet intensity of
COVID-19 related activity, from Italian, Spanish and United States geopolitical regions at the beginning of the
pandemic and we investigated relations with their regional mortality data after one month.
Department of Computer Science, Faculty of Engineering Sciences, University College London, Gower Street,
London WC1E 6BT, UK. *email: delmiro.fernandez-reyes@ucl.ac.uk; t.aste@ucl.ac.uk
Scientific Reports | (2021) 11:13678 | https://doi.org/10.1038/s41598-021-93042-w 1
Vol.:(0123456789)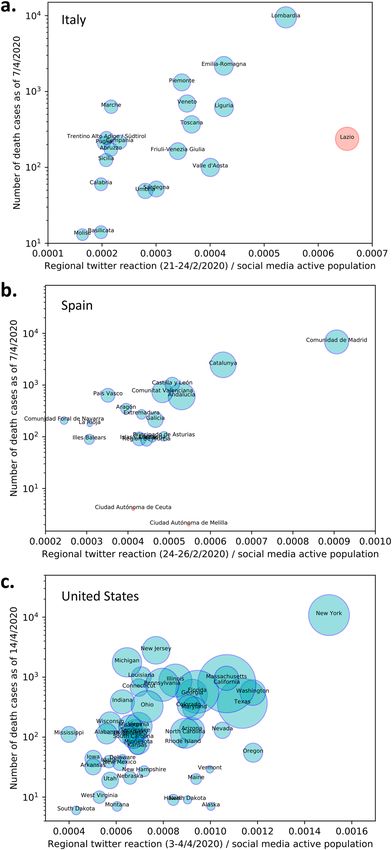
www.nature.com/scientificreports/
In social sciences it has been e stablished7,8 that the collective aggregate opinion of a large number of non-
experts can, in some contexts, outperform individual experts when the variable to be determined is not random
and their individuals have some partial information and the ability to process it7. Social psychology studies have
described crowd wisdom, opinion dynamics and collective knowledge by studying in which scenarios and in
what ways crowds are w ise8. Several studies have shown that social media wisdom of crowds, where user inter-
actions are more frequent and opinion dynamics are heightened, are able to solve challenging forecasting tasks.
Successful examples include improving Wikipedia a rticles9; predicting publicly traded securities stock p rices10;
the study of collective innovation in modern technological social n etworks11 and; election results f orecasting12
among many others showing that crowd wisdom, opinion pooling and social media opinion dynamics constitute
a powerful tool in forecasting tasks, even beyond experts’ abilities. These methods work well especially when
groups are large and connected opinion dynamics and communication allow crowds to process information13.
Social media debate is the result of a complex process of information filtering where individuals gauge official
information with local knowledge and confront their opinions openly. This process can degenerate in conspiracy
theories and foster fake news, but it has been observed that on average the crowds can process information and
weight reality in a rather accurate w ay14. While there are some examples of the use of the wisdom of crowds to
estimate relevant variables that are otherwise hard to measure, there is no literature reporting the use of this
collective knowledge gathered from social media tweets for assessing the spreading and resulting mortality
during an emerging pandemic. No previous study has shown that the collective wisdom of crowds during the
initial attention COVID-19 social media peak, when there were not readily available mortality data sources, can
predict the regional cumulative mortality a month ahead.
Here we show that such “wisdom of crowds” has been able to predict, ahead of officially available data,
COVID-19 infection severity across countries most affected by the pandemic. Our findings could underpin the
creation of real-time novelty detection systems aimed at early reporting of SARS-like mortality and thus early
activation of control measures in future pandemics. The wisdom of crowds could also be used to feed infection
diseases explicit models with reliable data sourced locally from the exposed population when, at the early stages
of a pandemic, there are no other sources of data available. The strength of the predictive association could be
used to inform fast-response policy making. As such, it provides a scalable tool to increase preparedness and
resilience in similar pandemic scenarios. Furthermore, the wisdom of crowds’ capability to infer the value of
some variables otherwise unmeasurable can be used to refine explicit models.
Materials and methods
COVID‑19 and population data sources. We obtained COVID-19 spreading and casualties time series
data aggregated by region from the official department of health website or repository for Italy15 and Spain16. For
the United States we used the readily available New York Times d ataset17 which contains regional level data as
well as an interactive package for live monitoring.
For Italy we obtained both population data per region18 and social media usage statistics per region19, both
updated as of 2019, from Istituto Nazionale di Statistica (ISTAT). We obtained regional population data for
Spain from Istituto Nacional de Estadística (INE) as of 2 01920 and for the United States from the United States
Census Bureau21.
Social media data crawling and processing. We obtained all Twitter data from an early COVID-19
Twitter data repository22 available before Twitter started providing access to its own COVID-19 dataset. Tweets
were collected from the 21st of January 2020 using Twitter’s Application Programming Interface (API)23. The
Twitter repository is updated as new meaningful COVID-19 related words e merge23. Using tweet unique iden-
tifiers (IDs), we retrieved all their corresponding information (text, date, user and user data) from the reposi-
tory via the “twarc” package (https://github.com/DocNow/twarc). This process is commonly referred to as tweet
hydration. To measure the number of unique active users per day in each of the regions of Italy, Spain and
the United States, we geolocated tweets with the HERE Geocoder service24 and obtained country and region
categorization for over 50% of the tweets. In order to facilitate dataset reading and tabulation we used Google’s
OpenRefine API25 that efficiently groups hourly tweet data by day and converts nested dictionary type files in
JavaScript Object Notation (JSON) to simple tabular comma separated values.
We defined tweet volume as the number of unique users active in a region per day, discussing COVID-19
related topics. This criterion is applied, rather than merely counting tweets, in order to measure the population’s
attention and news spreading in the crowd, while correcting for overrepresented Twitter activity from certain
users. To account for different sizes of regions’ populations we calculate tweet intensity by normalizing the tweet
volume by region population in the case of Spain and the United States or by social media active population in
the case of Italy. Indeed, Italy was the only country for which we were able to obtain specific social media usage
data per region.
Identification of tweet intensity peaks. In order to identify the beginning of the social media reaction
to the epidemic in each country we computed the z-score on the tweet activity time series on a two weeks rolling
window. We used Z > 3 as the identifier of the social media reaction peak.
Regression analyses. Weighted and non-weighted linear regressions models were carried out using the
python package “statsmodels.api”26 (python version 3.7). The Weighted Least Squares (WLS) function was used
for weighted linear regression (with intercept) and the Ordinary Least Squares (OLS) function was used for
unweighted linear regression (with intercept). The weighted regressions account for variability in the data by
weighting the error proportionally to the square root of region population. This adjustment accounts for error
Scientific Reports | (2021) 11:13678 | https://doi.org/10.1038/s41598-021-93042-w 2
Vol:.(1234567890)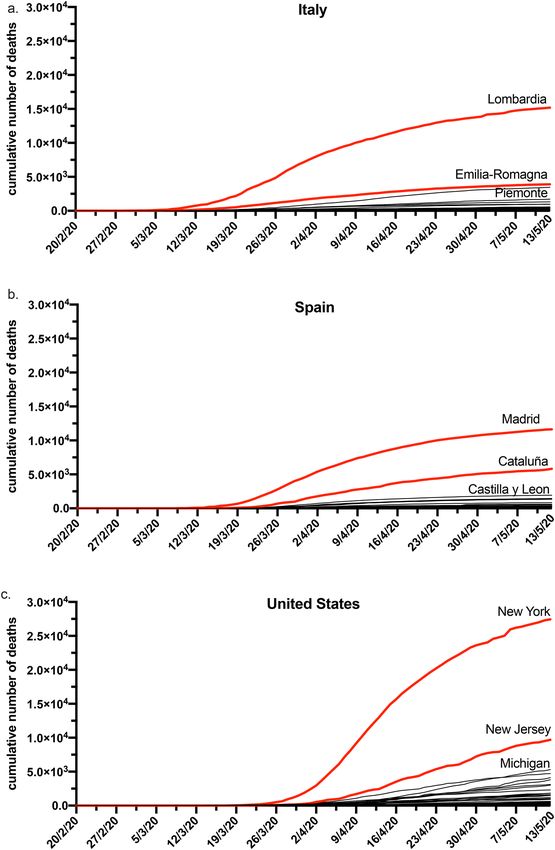
www.nature.com/scientificreports/
measurements both in number of deaths and Twitter volume. Regression p values are calculated by the “.sum-
mary()” function of the “.fit()” method for the OLS and WLS functions. This derives from Chi Squared survival
function of “scipy.stats”27 (scipy.stats.chi2.sf()) applied to the test statistics, which is assumed to be Chi Square
distributed.
Correlation analyses. Spearman’s rank correlation coefficient was calculated using the “spearmanr” func-
tion of “scipy.stats”27. In order to assess the strength of this correlation we compare it with null-hypothesis cor-
relation values for random shuffling of the data and obtain quantile confidence intervals. We hence obtain con-
fidence levels for comparison with the random null model.
Results
Twitter activity as a proxy for crowd perception of the severity of COVID19. We have used read-
ily accessible data from Twitter activity across different Italian, Spanish and United States regions to estimate
crowd perception of the severity of the event while it is unfolding in its early stages. We then related the intensity
of social media reaction with the severity of the infection in the same region in terms of the cumulative number
of deaths reported the following month. Our study focuses on Italy and Spain as these countries have been the
most affected at the start of the pandemic followed more recently by the United States.
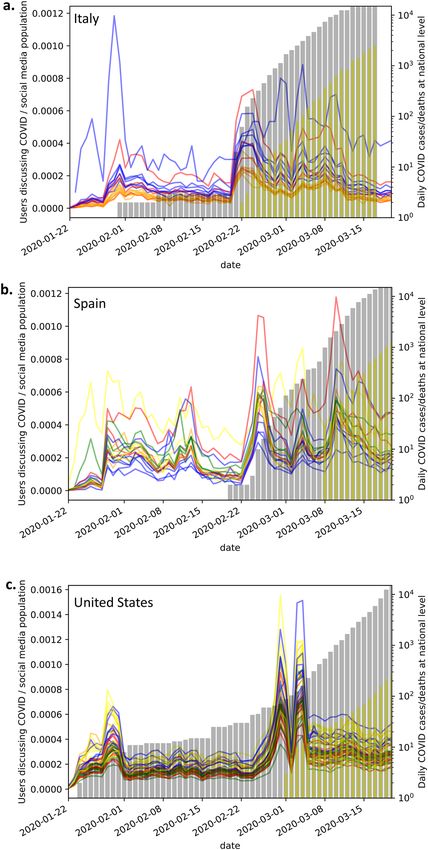
The number of active tweet users posting on COVID-19 per day22,25, geolocated24 and aggregated by the
regions of Italy, Spain and the United States is shown in Fig. 1a–c respectively. Country regions are coloured
according to each country’s geo-political areas. Figure 1 also shows the growth of positive SARS-CoV-2 cases
nationwide as well as the cumulative number of deaths nationwide caused by COVID-1915–17. The cumulative
mortality per geopolitical region of Italy, Spain and the United States is shown in Fig. 2a–c respectively.
Using the Z-score method we identified for tweet intensity peaks the period 2 1st to 24th February 2020 for Italy,
24th to 2 6th February 2020 for Spain and 3 rd to 4 th March for the United States (Fig. 1a–c). For the United States
we observed a first peak in tweet intensity with Z > 3 around the 25th of February with no apparent endogenous
cause such as change in confirmed cases or deaths (Fig. 1c), it is then followed by a second peak that corresponds
to an endogenous spike when the United States death toll starts to rise. This second United States tweet intensity
peak (Fig. 1c) was used for our analysis.
Note that Italian regional official data for the p andemic15 was first available on the 2 4th February 2020 which
is after the social media reaction (Figs. 1a,2a). Moreover, at that time most Italian regions still reported no cases
hindering the possibility of forecasting from official data (Fig. 2a). The crowds therefore reacted on national (or
even global) news at a time when no official regional public data was available for the number of infections by
gathering local information and elaborating it through opinion dynamics in social media (Fig. 1a). The accurate
regional forecasts were hence a result of the “wisdom of crowds” phenomenon. We observe an initial peak in
late January (Fig. 1a), perhaps due to the start of the epidemic in China, but with little differentiation between
Italian regions. We then observe a second peak of interest from social media in late February (Fig. 1a), this peak
was heterogeneous across regions and it appears to be sparked by the endogenous growth of the infection in Italy
being measured and reported. At the time (21st to 24th February 2020) only Italian nationwide epidemic data were
available and regional or province breakdowns were only scattered across the news, but there were no deaths
and many regions still had no tested infection cases and there was no official regional data release (Figs. 1a,2a).
In order to show whether tweet intensity is related to the severity of COVID19 we plotted in log scale the
cumulative number of deaths for each Italian (Fig. 3a) and Spanish (Fig. 3b) regions on the 7 th of April 2020
and for the United States regions (Fig. 3c) on the 1 4th of April 2020 against the mean tweet intensities at the
beginning of the epidemic perception. We used the number of deaths, instead of population confirmed cases,
as these are less dependent on the number of samples taken for SARS-CoV-2 testing in the wider population.
Using population confirmed cases would have been highly dependent on the country testing strategies which
would require a non-trivial rescaling. Nonetheless, we would like to emphasize that our results also hold when
regressing over the number of cases one month forward. Therefore, the tweet intensity is consistently forecasting
the severity of spreading, despite no regional infection data being available at the time of Twitter reaction meas-
urement. Figure 3 shows the proportionality between the mean tweet intensity at the beginning of the epidemic’s
perception, per region, and the number of deaths approximately one month forward. This figure demonstrates
how the reaction on social media can correctly detect and rank the epidemic’s impact on different regions one
month ahead, when no official data was available in Italy and the data was insufficient for forecasting in other
countries. This association is least noisy for Italy (Fig. 3a) and Spain (Fig. 3b) as these countries were severely
affected very early on before the WHO declared the global pandemic. We note that the regions of Lombardy in
Italy, Madrid in Spain and New York in the United States have the largest initial tweets intensity reactions and
correspond to the most severely affected regions one month later. Note that the Lazio Italian region (Fig. 3a)
is an outlier due to politicians and central bodies tweeting from it as well as national geolocation defaulting to
the capital. For Spain (Fig. 3b), the region of “Castilla-La Mancha” was merged with Madrid as a large section
of their population commute between the two and they are geographically nested. For the US the “District of
Columbia”, is over-represented with tweets from Washington D.C. (Fig. 3c).
To assess the strength of the observed association shown in Fig. 3 and to verify that the values of the epidemic
are not trivially related to the size of the population in each region we compared three regression models: model-
1, adjusted tweet intensity versus log death cases; model-2, log population versus log death cases and; model-3,
adjusted tweet intensity and log population versus log death cases.
We log-scaled the population to allow for a fair comparison as we notice a sub-linear relation to the number of deaths.
Table 1 shows coefficients’ significance as well as R2 for the three weighted and non-weighted regression models for the
three countries analyzed in this study. From the data reported in Table 1, we observe that model-1 weighted regression
Scientific Reports | (2021) 11:13678 | https://doi.org/10.1038/s41598-021-93042-w 3
Vol.:(0123456789)www.nature.com/scientificreports/
Figure 1. Plots of COVID-19 related Twitter activity superimposed to number of confirmed COVID-19 cases
and cumulative number of deaths nationwide. Twitters are geolocated and aggregated by geopolitical regions
for (a) Italy; (b) Spain and (c) United States. For each country we group and color code regions by geolocation
in the following way: (a) Italy: Northern regions (blue), Central regions (red) and Southern regions (orange),
(b) Spain: Northeastern regions (blue), Northwestern regions (green), Central regions (red), Southern regions
(orange), Autonomous cities (yellow), (c) United States: Northeastern states (blue), Southeastern states (green),
Midwestern states (red), Southwestern states (orange), Western states (yellow). The growth of confirmed
COVID-19 cases nationwide (cumulative) is represented by grey bars while the cumulative number of COVID-
19 deaths nationwide is represented by yellow bars.
Scientific Reports | (2021) 11:13678 | https://doi.org/10.1038/s41598-021-93042-w 4
Vol:.(1234567890)www.nature.com/scientificreports/
Figure 2. Plots of the cumulative number of deaths per geopolitical region for: (a) Italy; (b) Spain; (c) United
States.
is the most significant with the lowest p values and the largest overall R 2 values for the Italy and Spain data. It has also a
significant p value and sizable R2 for the United States. This indicates that tweet intensity is the most significant variable
for the prediction of the number of deaths for Italy and Spain. For the United States we still observe that tweet intensity
is a significant predictor for the number of deaths but results from unweighted regression with model-2 and model-3
reveal that the population of the regions is a better predictor.
Scientific Reports | (2021) 11:13678 | https://doi.org/10.1038/s41598-021-93042-w 5
Vol.:(0123456789)www.nature.com/scientificreports/
Figure 3. Demonstration that the reaction on social media can correctly detect and rank the epidemic’s impact
on different regions one month ahead. The y-axis reports the cumulative number of deaths one month forward
and the x-axis reports mean tweet intensity at the initial attention peak per geopolitical region of: (a) Italy; (b)
Spain and (c) United States. The diameters of the circles are proportional to the population of the region.
Scientific Reports | (2021) 11:13678 | https://doi.org/10.1038/s41598-021-93042-w 6
Vol:.(1234567890)www.nature.com/scientificreports/
Weighted Non-weighted
p
p p Adjusted p
Regression model Country Adjusted Tweets log (Population) R2 Tweets log (Population) R2
–7 –4
Italy 2 × 10 – 0.798 5 × 10 – 0.489
Model-1
Adjusted tweets versus log (Death Spain 1 × 10⁻⁵ – 0.684 4 × 10⁻² – 0.402
Cases)
US 5 × 10⁻⁶ – 0.340 3 × 10⁻² – 0.073
Italy – 9 × 10⁻⁴ 0.456 – 9 × 10⁻³ 0.431
Model-2
log (Population) versus log (Death Spain – 8 × 10⁻⁴ 0.482 – 2 × 10⁻³ 0.475
Cases)
US – 9 × 10⁻⁴ 0.189 – 1 × 10–13 0.680
Italy 3 × 10⁻⁶ 1 × 10⁻² 0.857 3 × 10⁻⁴ 8 × 10⁻⁴ 0.737
Model-3
Adjusted tweets and log (Popula- Spain 7 × 10⁻⁴ 4 × 10⁻² 0.748 3 × 10⁻¹ 1 × 10⁻¹ 0.477
tion) versus log (Death Cases)
US 1 × 10⁻³ 3 × 10⁻¹ 0.343 3 × 10⁻¹ 1 × 10–12 0.681
Table 1. Per country coefficient significance and R2 values for weighted and unweighted regression models.
Regression models explored: tweets intensity versus log death cases; log population versus log death cases and;
tweets intensity and log population versus log death cases.
Null hypothesis
correlation
quantiles
Country Empirical correlation value 90% 95% 99%
Adjusted tweets versus log (Death Cases)
Italy 0.66 0.31 0.39 0.53
Spain 0.51 0.34 0.42 0.58
US 0.31 0.18 0.24 0.33
Table 2. Spearman’s rank correlation coefficient values for empirical values of each country and
corresponding null-models significance levels.
We further assessed the strength and significance of the relation between the tweet intensity and the number
of deaths by quantifying non-linear monotonic dependency with Spearman’s Rho correlation (Table 2). We
observe that the significance level for Spearman’s Rho correlation for Italy is at 99% and both the United States
and Spain are significant to 95% significance level (Table 2). This confirms that there is a significant relation
between regional early tweet intensities and the number of deaths in the respective regions for all three countries.
Discussion
The wisdom of crowds has been used successfully to estimate relevant variables that are otherwise hard to meas-
ure in several domains including the medical o ne28. Despite this, there is no literature reporting the use of the
wisdom of crowds gathered from social media tweets for assessing the spreading of severity within an emerging
pandemic where there is no readily accessible mortality data.
Our study shows statistically significant evidence that COVID-19 related mean tweet intensity per region,
at the first endogenous attention spike, is able to significantly forecast the spreading of COVID-19 severity, as
measured by number of deaths, one month forward. In the case of Italy, the crowd’s reaction with predictive
power was recorded before any official regional contagion data was available. For Spain and the United States,
the crowd still reacted when little data was available to make any forecast.
As the pandemic progressed, Italy, then rapidly followed by Spain, were the first countries affected with
extremely high COVID-19 associated mortality. At such an early stage, Italy and Spain were therefore less influ-
enced by discussions about the general global status of the pandemic in their measured social media activity, as
less attention was present at the time. This allowed us to analyze the reaction from social media crowds with less
biases. Moreover, Italy is made up of a good number of regions of comparable size with good social media usage
as well as good official data for social media usage.
We show that the intensity of COVID-19 related Twitter activity is able to correctly identify the localities most
affected by the pandemic in each of the considered countries. These localities are Lombardy, Madrid and New
York, for Italy, Spain and the United States respectively (Fig. 3). These geo-political and administrative localities
have a striking social media reaction (Figs. 1,3). This suggests that the initial reaction of users on social media had
efficiently processed data scattered throughout news channels, merged it with local information and performed
an accurate risk assessment which is observable in the social media intensity reaction. We highlight in particular
for Italy that Emilia Romagna and Veneto did not seem to be less affected than Lombardy at the beginning of the
epidemic spread, however, nonetheless, crowd wisdom seems to have combined different information sources
to highlight the perception of a greater danger in Lombardy (Figs. 2a,3a). In Italian and Spanish regions, the
crowds demonstrated a remarkable ability to predict the severity of COVID-19 impact at regional levels before
Scientific Reports | (2021) 11:13678 | https://doi.org/10.1038/s41598-021-93042-w 7
Vol.:(0123456789)www.nature.com/scientificreports/
the availability of official data. The regression results demonstrate that the intensity of COVID-19 related tweeds
is a better predictor than the population size obtaining goodness of fit R 2 values that are almost twice. For the
United States we also demonstrated a significant predictability power of the tweet intensity, however in this case
the regional population size is a better regressor. We might note that spreading of the pandemic in the United
States started later when an amount of exogenous information was already circulating in the social media, fur-
thermore the United States have a much wider variety of climate, culture, political guidance, population density,
and total population throughout states that leads to a more difficult detection of the phenomenon (Fig. 3c).
The crowd’s reaction to COVID-19 spreading measured through tweet intensity on a regional basis is a
complex quantity rich of information. People react to both official information and to local knowledge gathered
at personal level. Tweets are a process involving both sharing and comparing such information which includes
a level of collective processing and assessing of the reliability of the source. It has been already recognized in
the literature that such a process can be on average very accurate. It should not be therefore surprising that the
crowd interest measured through COVID-19 related tweet intensity can result in an appropriate estimate of the
local severity of the epidemics.
The confounding factor of different social media usage throughout regions is a potential limitation. We have
adjusted for this in the case of Italy, as we were able to obtain the data, and our analysis was actually made more
significant when correcting for this. Further work should seek this additional regional data for other countries
as well, in order to more accurately adjust the Twitter intensity. Another potential limitation could be found in
the use of linear regressions. These are a simplification of more complex dependency relations. Here we used
simple methods, as little data was available, to show the validity of the phenomenon as per Fig. 1. More data and
sophisticated models can be investigated for practical monitoring and forecasting tools in the future. Despite
the limitations of our methodology, we expect that wisdom of crowd information will be most effective in early
stages of an emerging pandemic, when official testing data is not yet available and especially in regions where
official information is hard to obtain for a variety of operational reasons.
The practical relevance of our results consists in the demonstration that tweet intensity can be used for fore-
casting. At the beginning of an epidemic when it is extremely difficult to have precise information and therefore
modelers and public officials are obliged to use general statistical quantities to produce forecasts and consequently
implement decisions. Our work shows that the information locally available to the population permeates through
Twitter and social media and can be made available to modelers’ and policymakers at the early stages of a crisis
when it is most needed.
Data availability
During manuscript assessment and review the data can be accessed at: https://figshare.com/s/b344e72688e047d
2d65d. Data openly available upon publication in Turiel, Jeremy; Fernandez-Reyes, Delmiro; Aste, Tomaso
(2020): The Wisdom of the Crowd in Assessing the Spread of COVID-19 Associated Mortality. University Col-
lege London. Dataset. https://doi.org/10.5522/04/12317339.
Received: 18 February 2021; Accepted: 17 June 2021
References
1. Li, Q. et al. Early transmission dynamics in Wuhan, China, of novel coronavirus-infected pneumonia. N. Engl. J. Med. https://doi.
org/10.1056/NEJMoa2001316 (2020).
2. WHO Health Emergencies Program. WHO Coronavirus Disease (COVID-19) Dashboard. World Heal. Organ. 2020. https://c ovid
19.who.int. Accessed 5 June 2021.
3. Zhang, J. et al. Evolving epidemiology and transmission dynamics of coronavirus disease 2019 outside Hubei province, China: a
descriptive and modelling study. Lancet Infect Dis. 20, 793–802 (2020).
4. Chinazzi M, Davis JT, Gioannini C, et al. Preliminary assessment of the International Spreading Risk Associated with the 2019
novel Coronavirus (2019-nCoV) outbreak in Wuhan City. Lab Model Biol Soc--Techn Syst (2020).
5. Roosa, K. et al. Real-time forecasts of the COVID-19 epidemic in China from February 5th to February 24th, 2020. Infect Dis.
Model. 5, 256–263 (2020).
6. Grasselli, G., Pesenti, A. & Cecconi, M. Critical care utilization for the COVID-19 outbreak in Lombardy, Italy: early experience
and forecast during an emergency response. JAMA 323, 1545–1546 (2020).
7. Wagner, C. & Vinaimont, T. Evaluating the wisdom of crowds. Proc Issues Inf Syst 11, 724–732 (2010).
8. Mannes AE, Larrick RP, Soll JB. The social psychology of the wisdom of crowds. 2012.
9. Golub, B. & Jackson, M. O. Naive learning in social networks and the wisdom of crowds. Am Econ J Microecono 2, 112–149 (2010).
10. Azar, P. D. & Lo, A. W. The wisdom of Twitter crowds: predicting stock market reactions to FOMC meetings via Twitter feeds. J.
Portf. Manag. 42, 123–134 (2016).
11. Kozinets, R. V., Hemetsberger, A. & Schau, H. J. The wisdom of consumer crowds: collective innovation in the age of networked
marketing. J. Macromark. 28, 339–354 (2008).
12. Olsson H, de Bruin WB, Galesic M, Prelec D. Harvesting the wisdom of crowds for election predictions using the Bayesian Truth
Serum. 2019.
13. Bassamboo A, Cui R, Moreno A. Wisdom of Crowds in Operations: Forecasting Using Prediction Markets (2015). Available SSRN
2679663.
14. Pennycook, G. & Rand, D. G. Fighting misinformation on social media using crowdsourced judgments of news source quality.
Proc. Natl. Acad. Sci USA https://doi.org/10.1073/pnas.1806781116 (2019).
15. del Consiglio dei Ministri - Dipartimento della Protezione Civile P. Dati COVID-19 Italia. GitHub Repos (2020).
16. de Sanidad Im. Situación de COVID-19 en España (2020).
17. The New York Times. Data from The New York Times based on reports from state and local health agencies (2020).
18. ISTAT IN di S. Popolazione residente al 1° gennaio (2020).
19. ISTAT IN di S. Internet: accesso e tipo di utilizzo: Attività svolte su internet - reg. e tipo di comune (2020).
20. de Estadística IN. Cifras oficiales de población resultantes de la revisión del Padrón municipal a 1 de enero - Resumen por comu-
nidades autónomas. 2019.
Scientific Reports | (2021) 11:13678 | https://doi.org/10.1038/s41598-021-93042-w 8
Vol:.(1234567890)www.nature.com/scientificreports/
21. U.S. Census Bureau PD. Table 1. Annual Estimates of the Resident Population for the United States, Regions, States, and Puerto
Rico: April 1, 2010 to July 1, 2019 (NST-EST2019-01). 2019.
22. Chen E, Lerman K, Ferrara E. COVID-19: the first public coronavirus Twitter dataset (2020). arXiv:200307372.
23. Twitter I. Twitter Developer API. https://developer.twitter.com/en/docs. Accessed 8 May 2020.
24. HERE Developer. HERE Geocoder API. https://developer.here.com/documentation/geocoder/dev_guide/topics/what-is.html.
Accessed 15 April 2020.
25. Huynh D. OpenRefine. https://github.com/OpenRefine/OpenRefine.
26. Seabold S, Perktold J. statsmodels: Econometric and statistical modeling with python. In: 9th Python in science conference. 2010.
27. Virtanen, P. et al. SciPy 1.0: fundamental algorithms for scientific computing in python. Nat. Methods 17, 261–272 (2020).
28. Beyrer, C. et al. Global epidemiology of HIV infection in men who have sex with men. Lancet https://doi.org/10.1016/S0140-
6736(12)60821-6 (2012).
Acknowledgements
The authors acknowledge Fabio Caccioli, Licia Capra, Giacomo Livan and Simone Righi for useful feedback
and discussions.
Author contributions
J.T., D.F.R., T.A. conceived the study. J.T. carried out data crawling, processing and implemented the analyses. J.T.,
D.F.R., T.A. carried out analysis of results and wrote the manuscript. All authors have approved the manuscript.
Funding
TA and JT acknowledge support from the EC Horizon 2020 FIN-Tech and EPSRC (EP/L015129/1). TA acknowl-
edges support from ESRC (ES/K002309/1); EPSRC (EP/P031730/1) and; EC (H2020-ICT-2018-2 825215). DFR
acknowledges support from EPSRC (EP/P028608/1). The funders had no role in the writing of the manuscript
nor in the decision to submit it for publication. We have not been paid to write this article by a pharmaceutical
company or any other agency. All authors including the corresponding senior authors have had full access to all
the data and had the final responsibility for the decision to submit for publication.
Competing interests
The authors declare no competing interests.
Additional information
Correspondence and requests for materials should be addressed to D.F.-R. or T.A.
Reprints and permissions information is available at www.nature.com/reprints.
Publisher’s note Springer Nature remains neutral with regard to jurisdictional claims in published maps and
institutional affiliations.
Open Access This article is licensed under a Creative Commons Attribution 4.0 International
License, which permits use, sharing, adaptation, distribution and reproduction in any medium or
format, as long as you give appropriate credit to the original author(s) and the source, provide a link to the
Creative Commons licence, and indicate if changes were made. The images or other third party material in this
article are included in the article’s Creative Commons licence, unless indicated otherwise in a credit line to the
material. If material is not included in the article’s Creative Commons licence and your intended use is not
permitted by statutory regulation or exceeds the permitted use, you will need to obtain permission directly from
the copyright holder. To view a copy of this licence, visit http://creativecommons.org/licenses/by/4.0/.
© The Author(s) 2021
Scientific Reports | (2021) 11:13678 | https://doi.org/10.1038/s41598-021-93042-w 9
Vol.:(0123456789)You can also read