INNER CITY VITALITY REPORT 2019 - The Committee ...
←
→
Page content transcription
If your browser does not render page correctly, please read the page content below
INNER CITY
  VITALITY
  REPORT 2019
Proudly brought to you by
02    INNER CITY VITALITY REPORT 2019 | The Committee for Brisbane

 October 2019

 PREPARED BY

 Urban Economics
 Kerrianne Meulman, Director
 Level 10, 87 Wickham Tce
 Spring Hill QLD 4000
 (ph) 07 3839 1400
 mail@urbaneconomics.com.au
 www.urbaneconomics.com.au

 WARRANTY

 This report has been based upon the most up to date readily
 available information at this point in time, as documented in this
 report. Urban Economics has applied due professional care and
 diligence in accordance with generally accepted standards of
 professional practice in undertaking the analysis contained in this
 report from these information sources. Urban Economics shall not
 be liable for damages arising from any errors or omissions which
 may be contained within these information sources.

 As this report involves future market projections which can be
 affected by a number of unforeseen variables, they represent our
 best possible estimates at this point in time and no warranty is
 given that this particular set of projections will in fact eventuate.
The Committee for Brisbane | INNER CITY VITALITY REPORT 2019   03

01.
Introduction

02.
Brisbane City
2.1   The Commercial Office Market
2.2   The Residential Market
2.3   The Tourist Sector
2.4   The Retail Market
2.5   The Education Sector
2.6   Population & Mobility
2.7   The Future of the CBD

03.
South Brisbane &
Fortitude Valley
3.1   The Commercial Office Market
3.2   The Residential Market
3.3   The Tourist Sector
3.4   The Retail Market
3.5   The Education Sector
3.6   Population and Mobility Dashboard
3.7   The Future of Fortitude Valley & South Brisbane
04     INNER CITY VITALITY REPORT 2019 | The Committee for Brisbane

01.           Introduction
A central business district is generally defined as the               We have applied the Statistical Area 2 (SA2s) of Brisbane
business heart or centre of a city, often synonymous                  City, Fortitude Valley and South Brisbane as the geographic
with financial and administrative functions. By their very            collectors from which the analyses and benchmarking
name, CBDs connote a business orientation, facilitated and            data have been explored as illustrated in Figure 1.1 on the
recognised through measures of vitality such office vacancy           opposite page.
rates. This analysis measures the level of success or vitality
                                                                      These areas have allowed for a focused analysis on the key
of the Brisbane CBD as well as SA2s surrounding it including
                                                                      precincts, which can be consistently measured against ABS
South Brisbane and Fortitude Valley; through the exploration
                                                                      data; succinct from broader boundaries such as the ‘Urban
of three themes: human activity, economic activity and
                                                                      Renewal’ or ‘Fringe’ areas of Brisbane.
city image, meshing together a range of published and
unpublished data sets, measuring their changes over time
and calibrating an Index of their Vitality.
A range of themes and data sources for the Inner-City
precincts have been explored including:                                                     VISIT
                                                                           LEARN
•    office market measures;
                                                                                                         LIVE
•    retail performance measures;
                                                                                    HUMAN
•    housing performance measures;                                                 ACTIVITY
•    tourism and hospitality performance measures;
•    active and public transport patronage measures; and
•    cultural performance measures.                                         RECREATE

                                                        CITY
                                                       IMAGE                                            PRODUCE
                                                                         ACCESS                                         WORK

                                       OFFER
                                     HOSPITALITY
                                                                                      INNOVATE           ECONOMIC
                                                                                                          ACTIVITY

                                                                                                                     INVEST

                                             ADMINISTRATIVE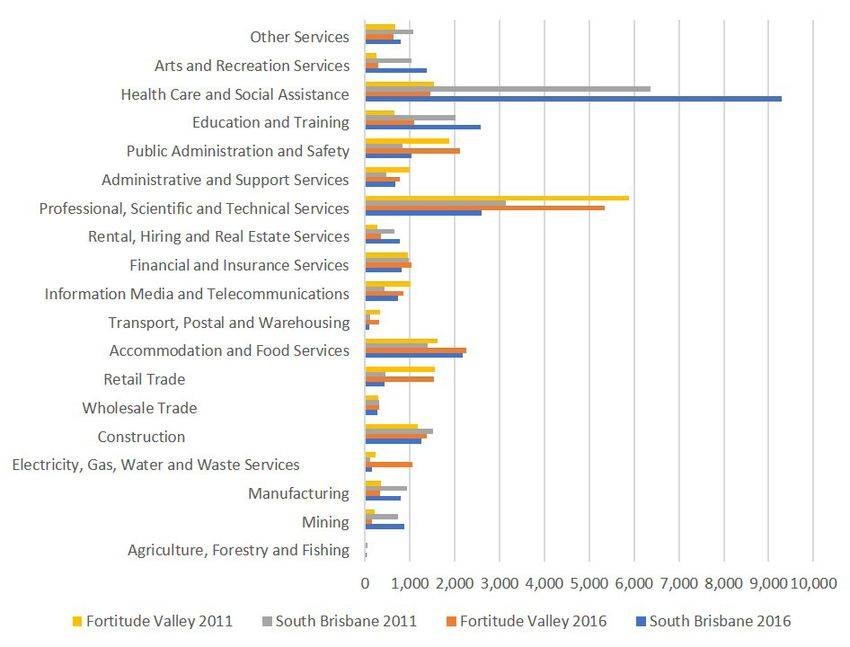
The Committee for Brisbane | INNER CITY VITALITY REPORT 2019 05
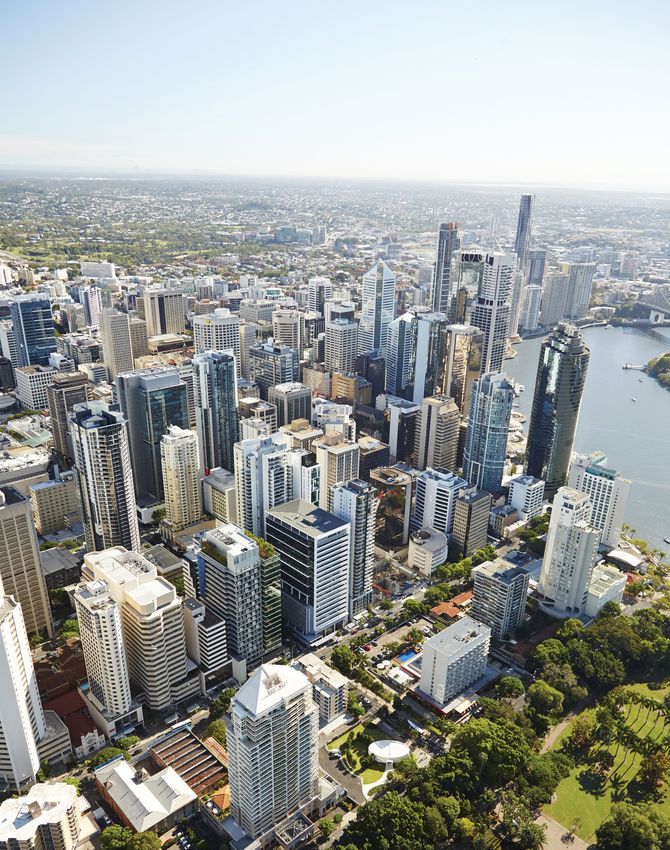
Figure 1.1: The SA2s
FORTITUDE
VALLEY
BRISBANE
CITY
SOUTH
BRISBANE
An empirical rating has been applied to each of the key sectors
within the CBD, Fortitude Valley and South Brisbane based
on employment and day time populations, occupancy rates,
business growth and level of activity in 2018/2019, and total
employment levels, as summarised below on a scale of 1 to 10,
with 1 being the lowest or underperforming and 10 the highest.
1 2 3 4 5 6 7 8 9 10
Brisbane Brisbane Fortitude South
Dashboard City City Valley Brisbane
2018 2019 2019 2019
Office Market 6 6 6 7
Residential Market 5 6 6 7
Tourism Industry 6 7 8 8
Retail Market 6 7 6 5
Education Industry 8 8 6 8
Overall Rating 6.2 6.8 6.4 7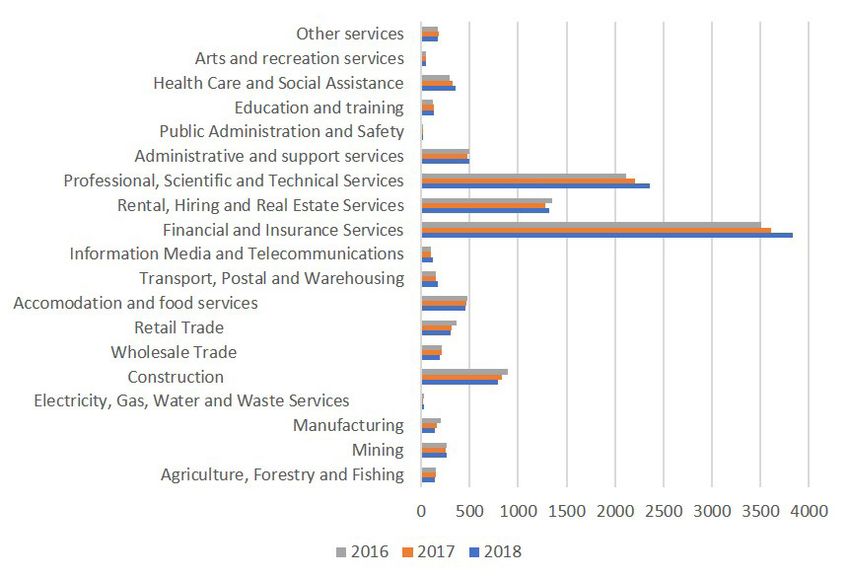
06           INNER CITY VITALITY REPORT 2019 | The Committee for Brisbane

02.
Brisbane City
This chapter measures the level of success or vitality of the               •   Financial and insurance services and professional
Brisbane CBD by exploring the relative performance of the                       scientific and technical services clearly dominate the
key sectors in the CBD benchmarked against the outcomes                         industry landscape within the CBD, together comprising
and key performance measures identified in 2018.                                54% of all businesses registered within the CBD in
                                                                                2018. Ongoing growth in professional occupations will
2.1 The Commercial Office Market                                                continue to drive demand for additional commercial
                                                                                office space in the CBD. Significantly, the professional
                             Previous (Jul ‘18)      Latest (Jul ‘19)           and scientific industry employs 20% of the CBD labour
                                                                                force, public administration and safety workers 20%, and
    Floor Space m   2
                               2,243,323m2               2,211,600m2
                                                                                finance and insurance services 12%, however all three
    Vacancy %                     14.60%                   11.9%                sectors demonstrated declining numbers of workers
    Net FaceRents/m     2
                                                                                between 2011 and 2016, placing downward pressure on
                                 $550/m2                  $550/m2
    (A-Grade)                                                                   the space requirements of commercial office tenants.
                              Brisbane Quarter                              •   Between 2016 and 2041, the key growth sectors in
                            (under construction)
                                                                                jobs in the CBD by industry are anticipated within the
    New Supply               + number mooted             162,800 m2
                                 & awaiting
                                                                                public administration and safety workers, professional,
                              precommitments                                    scientific and technical workers, generating ongoing
                                                                                demand for commercial office space to accommodate
    Rating                    5/10 Improving        6/10 Signs of Life
                                                                                these workers. (Brisbane City Council Employment
Sources: PCA Office Market Report, various agents, ABS                          Projection Model). Other key growth sectors include
                                                                                computer system design workers doubling in real
CBDs are traditionally recognised as the heart and principal                    numbers between 2016 and 2041.
administrative and commercial office market; the business
                                                                            •   Brisbane City Council projects that more than 90,000
district if you will. With more than 2.2million square metres
                                                                                additional workers will be employed within the Brisbane
of floorspace, the commercial office market in the Brisbane
                                                                                CBD by 2041; increasing from some 122,480 workers in
CBD continues to dominate the employment profile of the
                                                                                2016 to more than 218,000 workers by 2041.
CBD, but the composition and nature of the office market is
changing.
                                                                            New office supply underway includes:
•      The Property Council of Australia’s July 2019 Office
       Market Report demonstrated declining vacancy rates                   •   Mirvac’s 32-storey commercial tower is under
       within the Brisbane CBD office market and the lowest                     construction at 62-80 Ann Street, comprising some
       rates since July 2013. Declining vacancy rates signal the                75,339 m2 of commercial office space and is the most
       return of employment and business activities to the CBD                  significant committed commercial office development
       coupled with above average withdrawals during 2018/19.                   currently within the CBD. Suncorp has committed to
       Much of the take-up of space has been attributed to large                over 39,500m2 of the space for its new HQ.
       requirements from the co-working sector.                             •   As part of the ongoing redevelopment at 163 Charlotte
•       There were 11,505 businesses registered within the                      Street, an additional 6,214 m2 of office space will be
       CBD during 2018; slightly higher than the 2017 levels                    added across 6 levels.
       (11,121). During both 2017 and 2018, the number                      •   Of note are two ongoing commercial office towers under
       of business entries to the CBD outnumbered exits,                        construction at 300 George Street and 12 Creek Street
       reversing 2015 trends where the CBD experienced a net                    (The Annex). They will deliver 58,209m2 and 8,000m2 of
       loss of businesses.                                                      office space, respectively.
The Committee for Brisbane | INNER CITY VITALITY REPORT 2019   07

Figure 2.1: CBD Number of Businesses by Industry
Source: ABS

2.2 The Residential Market                                                •    The CBD residential market reflects both premium
                                                                               apartment stock and smaller, studio and student housing
                            Previous (Jun ‘18)         Latest (Jun ‘19)        stock targeted at investors, compressing median sales
 Residents                         11,809                    12,110            prices. Median sales prices for residential units have
                                                                               been relatively flat since 2014/15 and increased 1.2%
 Total # units                     5,210                     5,906
                                                                               from $510,900 for the 2017/18 financial year to $516,250
 # under                              -                      +2,246            for the 2018/19 financial year. 533-unit sales were
 construction
                                                                               recorded in the 2017/18 financial year, compared with
 Median Price                    $506,900                  $516,250
                                                                               158 in the 2018/19 financial year.
 Median Rental                     $530                       $545
                                                                          •    As a result of the two residential markets in the Brisbane
 Vacancy                           5.50%                     3.60%             CBD, there is also considerable diversity in price points,
 Rating                 6/10 Surprising Stability      6/10 Absorbing          the highest sale price recorded in the CBD during 2019
Sources: RTA, Pricefinder, ABS, SQM Research, REIQ, various agents
                                                                               to date was $2.5million, with a median unit price of
                                                                               $516,250, influenced by a number of sales of student
                                                                               apartments and studio units.
The residential market of the CBD has the advantage of
appealing to a range of market sectors including premium
buyers, students and investors and has continued to
demonstrate signs of improvement with growth in median
prices, declining vacancy rates and increasing median rental
rates.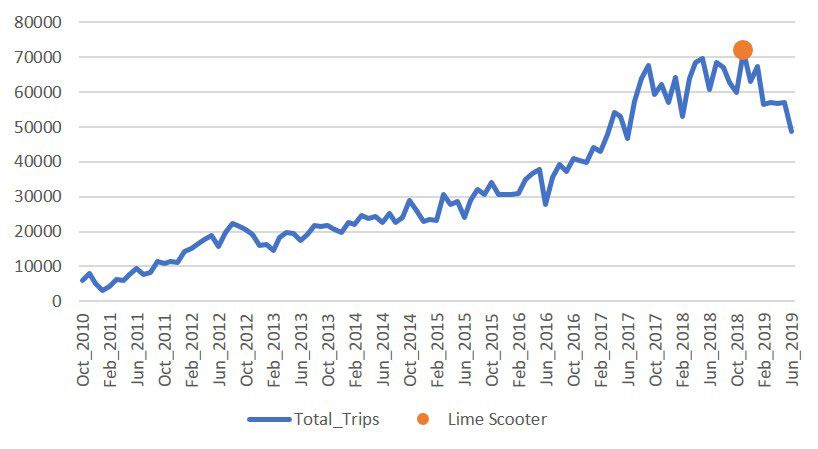
08       INNER CITY VITALITY REPORT 2019 | The Committee for Brisbane

Figure 2.2: CBD Unit Sales Activity
Source: Pricefinder

•    According to the Australia Bureau of Statistics (ABS),
     only 3 residential approvals were granted in 2017/18 in
     the CBD, while in 2018/19, 13 dwelling units worth over
     $1billion were approved, suggesting limited new supply
     of stock coming to market in the medium term.
•    The rental market in the Brisbane CBD is strengthening
     with declining vacancy rates, gross yields holding
     firm, only a modest decline in the number of rental
     commitments and an increasing median rental rate with
     median rental rates having remained flat throughout                Figure 2.3: CBD New Bonds
     2018. SQM Research reported a decrease in vacancy                  Source: RTA
     rates from 5.3% in July 2018 to 3.6% in July 2019, whilst
     the number of new rental bonds recorded by the RTA
     for the June Quarter has been increasing since 2016 but
     experienced an insignificant 0.6% decline in 2019.
•    The One residential tower is under construction at 300
     George Street, which will ultimately comprise 428 units,
     whilst some 2,000 additional residential units will be
     delivered within the Queen’s Wharf development.
•    Cbus Property is currently building a residential
     development at 443 Queen Street comprising 264
     apartments, 1,330m2 of office space and 355m2 retail
     space. Over 65% of the apartments have been sold;                  Figure 2.4: CBD Median Rents
     with two penthouses in the luxurious development sold              Source: RTA
     off the plan for over $6 million, making it one of the
     most expensive apartment developments ever sold in
     Brisbane.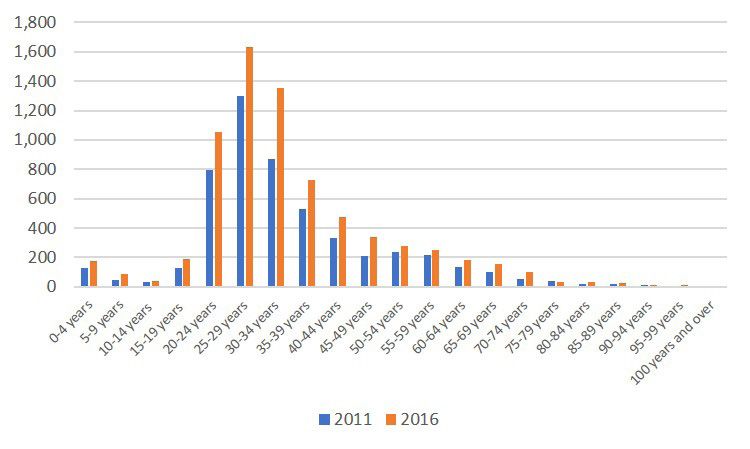
The Committee for Brisbane | INNER CITY VITALITY REPORT 2019         09

2.3 Tourist Sector                                                  •      Revenue per Available Room rate (RevPAR) for short
                                                                           term accommodation across the CBD has demonstrated
                     Previous (Jul ‘18)       Latest (Jul ‘19)             a decline from 2013 to 2019 with the exception of 2017,
                                                                           even in light of the entry of new premium and five-star
    Total # rooms           7,391                  7,585
                                                                           stock in 2017 and 2018, which reflects both increasing
    # under                  299                   1,100                   competitiveness as well as the increased diversity of
    construction
                                                                           room choices available within the CBD.
    REVPAR                  $169                   $164

    Occupancy               81.7%                  83.3%
                                                                    2.4 The Retail Market
    Rating          6/10 Consolidating      7/10 Business End of
                                                the Market                                             2018                   2019

Sources: STR, TRA, TEQld, Urban Economics                               Floor Space m2               178,000m2              181,000m2
                                                                        (major centres)
More than 1,580 new hotel rooms, including Brisbane’s first             Vacancy %                        8%                     5%
five-star hotel in almost 20 years, have been added to the              Gross Rents $/m2            $4,175/m   2

Brisbane CBD between 2016 and 2019, investing in much                   •   Well located Mall     $6,500-7,000m2            $4,250/m2
needed infrastructure for Brisbane’s tourist and visitor                •   Well located
                                                                            specialty             $3,000-4,000m2
markets, with 194 new rooms added since July 2018.
                                                                                                 Brisbane Quarter        Mirvac 1,098m2
•      According to Tourism Research Australia, there were              Under construction                               Queen’s Wharf
                                                                                                      4,209m2               40,000m2
       some 11,560,000 international overnight visitors
       staying in accommodation in Brisbane, whilst some                                          6/10 Absorbing              7/10
       7,106,000 domestic overnight visitors also stayed in             Rating                      Tale of Two           Strengthening
                                                                                                     Markets                 Vitality
       accommodation in Brisbane.
                                                                    Sources: ABS, various agents, centre owners, Urban Economics inspections
•      Some 3,907,000 domestic day-trippers visited Brisbane
       city in the year ending December 2018 or approximately
       an average of 10,700 day-trippers per day.                   •      There has been a measurable and clear takeup of
                                                                           vacancies in ground floor office buildings and in arcades
•      With the opening of the Westin Brisbane in November                 or older strip stock; vacancy rates less than 5% are now
       2018, there are now 7,585 short term accommodation                  estimated across the CBD.
       rooms within the CBD (July 2019), a growth of some 194
       rooms since July 2018.                                       •      There are 12 major shopping centres and arcades within
                                                                           the CBD, the largest of which, Vicinity’s Myer Centre,
•      Three more hotels are under construction as part of the             attracts some 30million shoppers annually, whilst the
       Queen’s Wharf redevelopment, which will deliver some                Queen Street Mall attracts 70,000 visitors daily. Together
       1,100 additional rooms including the six-star Ritz-Carlton          these centres accommodate some 181,000m2 of retail
       and five-star Rosewood and Dorsett Hotels                           space, with a September 2019 vacancy rate of less than 1%.
•      Occupancy rates for hotels within the CBD for the            •      The Mirvac commercial tower under construction will
       12months ending July 2019 tightened over the previous               add a further 1,098m2 of retail space, whilst some
       12 month period, even with the addition of new room                 40,000m2 of retail space is anticipated within the
       stock to the market, suggesting that demand for short               Queen’s Wharf precinct, together with 50 new bars, cafes
       term accommodation in the CBD continues to increase,                and restaurants throughout the precinct.
       particularly in light of the range of quality new stock
       available to the market.                                     •      A range of proposals has been lodged to refurbish
                                                                           existing commercial buildings into mixed-use towers
•      The Brisbane CBD dominates the Brisbane Tourism                     that include retail on the ground floor and offices
       Region in terms of the depth and mix of short-term                  in upper levels. E.g. A proposal has been lodged to
       accommodation available to visitors, currently housing              reposition 288 Edward St office building and to refurbish
       some 61% of all short-term accommodation rooms                      the ground floor level to include enhanced retail space.
       within the BTR and attracting 94% of all visitor nights
       spent in Brisbane City, Fortitude Valley and South           •      Some 4,800 workers are employed within the retail
       Brisbane.                                                           sector in the CBD, representing 10% of the growth in the
                                                                           total CBD workforce between 2011 and 2016.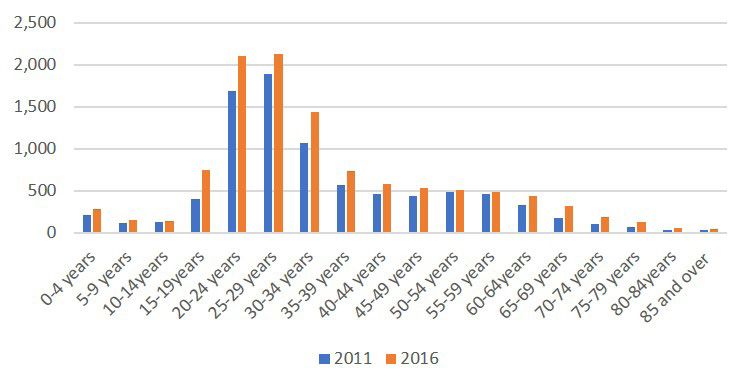
10           INNER CITY VITALITY REPORT 2019 | The Committee for Brisbane

•      The opening of more than 4,000m2 of retail and dining                           2,457 workers in the CBD and the single most significant
       space in the Brisbane Quarter, the redeveloped Brisbane                         growth sector for employment across the CBD. In
       Arcade and the future Queen’s Wharf precinct continues                          2016, there were 6,265 workers employed in the CBD’s
       to shift the retail focus north and beyond the traditional                      education and training sector.
       Queen Street Mall core of the CBD and will contribute to
                                                                                •       Brisbane CBD is home to Queensland University of
       the diversity of shopping experiences within the CBD.
                                                                                       Technology’s Garden point campus, with a student
•      More than 550 cafes and restaurants are in the CBD,                             enrolment of some 31,500 in 2018.
       from coffee kiosks to internationally recognised fine
                                                                                •      The University of Queensland opened its UQ Brisbane
       dining establishments. Iconic new dining venues that
                                                                                       City campus in Queen Street in December 2017, with
       entered Brisbane’s dining scene in 2019 included
                                                                                       other universities offering campuses and executive
       Phoenix, Polpetta, Jumbo Thai, Massimo Restaurant &
                                                                                       training in the CBD including James Cook University
       Bar, and Greca, whilst rooftop bars such as Fiume Bar,
                                                                                       Brisbane Campus, the CQUniversity Brisbane, Charles
       are embracing Brisbane’s skyline.
                                                                                       Sturt University Study Centres, ACU’s Leadership
•      Between 2011 and 2016, the number of workers                                    Centre, and the Federation University Brisbane.
       employed within the food and beverage sector increased
                                                                                •      We estimate an enrolment of some 34,000 students in
       by some 1,415 persons in the CBD, representing a
                                                                                       2018 across the QUT campus, James Cook campus and
       significant 22% of the total employment growth in the
                                                                                       CQUniversity Brisbane
       CBD during the intercensal period. In 2016, there were
       5,016 workers in the food and beverage sector working                    •      Between 2011 and 2016, the number of student residents
       in the CBD.                                                                     in the CBD studying at TAFE, University or other (non-
                                                                                       school) educational facility increased by 20%, with some
2.5 The Education Sector                                                               3,834 resident students in the CBD in 2016.
                                                                                •      Albert Park Flexible Learning centre located within the
                          Previous (2018)               Latest (2019)                  Brisbane City had some 104 students enrolled in 2018,
    # Counts*                   129                           129                      increasing from some 102 students in 2017.
    Workforce               6,265 (2016)                 6,265 (2016)           •      Six student accommodation residences providing some
    University                                                                         3,224 beds in the CBD are currently operating within the
    Students                  >34,000                      >34,000
                                                                                       CBD. 901 additional student accommodation beds were
    VET Students            5,400 (2017)                 4,730 (2018)                  opened in 2019.
    Primary and                                                                 •      There were 9 childcare centres within the CBD offering
    Secondary                102 (2017)                       104
    Students                                                                           some 807 licensed places for young children in 2018;
                                                                                       reducing to 8 childcare centres offering some licensed
    Student beds            2,309 (2018)                 3,244 (2019)
                                                                                       731 places in 2019.
    Rating              8/10 Unsung Hero             8/10 Unsung Hero
*Universities, English schools, Executive and workplace training institutions   2.6 Population & Mobility
Sources: ABS, QUT, Echild
                                                                                                               Previous                  Latest
The education sector is the CBD’s “Unsung Hero”,
accelerating employment growth in the CBD, propping                                 Workers                 116,132 (2011)          122,486 (2016)
up commercial office takeup rates, and creating a new                               Residents               11,809 (2018)            12,110 (2019)
market for residential development in the CBD. More than
                                                                                    Public transport %        45% (2011)              43% (2016)
9,000 students are in the CBD daily, attending the 129
educational and training institutions across undergraduate,                         Walking/cycle %          7.0% (2011)              7.8% (2016)
postgraduate, English language, executive and workplace                             City Cycle(total      747,300 (2017/18)        736,400 (2018/19)
training and learning courses. Between 2014 and 2018, the                           network trips)
number of educational and training institutions increased by                        Private Car              23.5% (2011)            24.5% (2016)
19 new businesses registered in the CBD, remaining stable in                                             7/10 Young Hip and       7/10 Steady as She
to 2019.                                                                            Rating                                              Goes
                                                                                                               Mobile
•      Significantly, 39% of the total growth in employment                     Sources: BCC, ABS, QGSO, QT, Urban Economics estimates, Small Area
       in the CBD between 2011 and 2016 was within the                          Labour Markets
       education and training sector, with a growth of some
The Committee for Brisbane | INNER CITY VITALITY REPORT 2019 11
There are more than 160,000 people interacting within the
CBD on a daily basis, 43% of whom access the CBD using
public transport. The CBD is the largest single employing
area within South East Queensland, it recorded the 10th
largest growth in population across the City of Brisbane
between 2006 and 2018 and is the 6th youngest area
in the City behind university suburbs such as St Lucia,
Indooroopilly and Kelvin Grove. “Young, hip and mobile!”
There are also more than 31,500 university students and
51,140 overnight visitors daily in the CBD, transitioning
activity in the CBD from day to night.
Figure 2.6: CBD Population Projection
• The Brisbane CBD is the largest single employing Source: QGSO
area within the Brisbane Metropolitan area, employing
122,486 workers in 2016, an increase of 6,354 workers or
5.5% from 116,132 in 2011. • The Brisbane CBD is one of the most ethnically diverse
communities in South East Queensland; only 35% of the
• Although comprising 1% of the total Brisbane City Local population of the CBD was born in Australia in 2016, and
Government Area (LGA) population in 2018, the share of a further 31% was born in Asian countries. A significant
the City’s population calling the CBD home has increased 25% of those born in Asian countries living in the CBD
by 27% since 2008, and by June 2019 it is estimated that were Chinese and a further 24% were Korean.
there were 12,110 persons living within the Brisbane
CBD, a growth of some 300 persons from June 2018. • With a median age of 29.8 years in 2016, the CBD is
also one of the youngest communities in South East
• The Brisbane CBD has experienced a continuous Queensland; the 6th youngest SA2 behind St Lucia,
increase in population over the last 10 years (FIGURE Kelvin Grove-Herston, Toowong, Indooroopilly and
2.5), with an additional 3,442 persons moving to the Taringa. In fact, “Twenty-somethings” love to call the
Brisbane CBD between 2008 and 2019. Significantly, CBD home, and their numbers continue to grow! A
between 2006 and 2018, the CBD recorded the 10th significant 38% of residents were aged 20-29 in 2016
largest increase in total population by SA2 throughout and the share of those 20-29 living within the CBD has
the City of Brisbane. increased from 32% in 2011.
Figure 2.5: CBD Population Trend
Source: ABS
Figure 2.7: Population by Age
Source: ABS
• The State projections anticipated that a further 8,720
additional residents will move to the Brisbane CBD • According to the Small Area Labour Market data,
between 2018 and 2041, requiring at least 3,900 the rate of unemployment for those living within
additional dwellings to accommodate them. the CBD increased from 4.1% in the March Quarter
2018 to 4.4% for the March Quarter 2019, remaining
well below the Brisbane City average of 6.2% for the
March Quarter 2019. The City also recorded a slight12 INNER CITY VITALITY REPORT 2019 | The Committee for Brisbane
increase in unemployment rates from 6.0% in the March 2.7 The Future of the CBD
Quarter 2018, whilst the State recorded a declining
unemployment rate during this period, indicative of Growth Areas Projected Growth
some employment growth in regional centres.
Population Growth + 8,720 to 2041
• Average household sizes are on the increase in the
Dwelling Units Needed + 3,900 to 2041
CBD from 1.98 persons per household in 2011 to 2.05
persons per household in 2018, in part a reflection of the Employment Growth + 90,000 to 2041
age profile and ethnicity of the community, with younger Office Space >500,000m2 to 2041
residents moving to the CBD. New Hotel Beds Under Construction +1,100
• Almost 64,000 people travelled to the CBD each day Rating Onwards & Upwards
using public transport in July 2018.
Sources: ABS, NIEIR, QGSO, RLB, Urban Economics
• Some 51,720 workers travelled to work in the CBD using
public transport in 2011 and by 2016, this had increased The Brisbane CBD is subject to significant investment and
to 52,527, a growth of only 1.6%. In comparison, those activity which will contribute to the continued diversity of the
working in the CBD increased 5.5% over this period. CBD as a vital, vibrant, 24-7 City Centre. Cranes are crossing
Significantly, approximately 45% of CBD workers used the City skyline, with some 15 cranes active on projects
public transport in 2011 but this had decreased to 43% within the Brisbane CBD, representing 25% of all cranes
by 2016. reported by RLB’s Crane Index within the Brisbane CBD and
Surrounds 1st Quarter 2019. More than $10 billion of major
• In comparison, 7% of workers walked or cycled to work project activity is currently underway in the CBD including:
in 2016. Interestingly, the number of trips undertaken
using the City Cycle system reduced 1% across the Major Committed projects in Brisbane CBD $
network, (the CBD and beyond) for the 2018/19 FY
compared with the 2017/18 FY due to the inclusion of Queen’s Wharf 3.6-4 billion
Lime Scooters to the transport network. More than Central Station redevelopment 67 million
736,400 City Cycle trips were recorded over the 2018/19 Queen’s Wharf pedestrian bridge 70 million
Financial Year.
Cross River Rail 5.4 billion
Significant future public and private sector investment in the
Brisbane Metro, Eagle Street Pier, Brisbane Live, proposed
new bridges, mooted major commercial office towers
awaiting pre-commitments, and residential apartments,
continues to signal ongoing commitment to the CBD, further
diversifying the role of the Brisbane CBD as much more than
a business district.
Brisbane City Council employment forecast for the CBD
anticipate more 14,800 additional public administrative and
safety workers and 19,870 professional and scientific workers
in the CBD between 2016 and 2041. At just 15m2 per worker,
these additional workers would support at least 520,000m2
Figure 2.8: City Cycle Trips of additional commercial office space in the CBD. Other key
Source: Brisbane City Council
employment growth sectors include computer systems and
data workers, food and beverage and retail workers.The Committee for Brisbane | INNER CITY VITALITY REPORT 2019 13
03.
South Brisbane &
Fortitude Valley
This chapter measures and compares the level of success or generating ongoing demand for commercial office space
vitality of Fortitude Valley and South Brisbane by exploring to accommodate these workers. (Brisbane City Council
the performance of their key sectors. Employment Projection Model).
• A total of 3,949 businesses were registered in Fortitude
3.1 The Commercial Office Market Valley and South Brisbane in 2018; with Fortitude Valley
accommodating approximately 61% of all businesses
Fortitude Valley South Brisbane registered within both SA2’s.
Number of Workers • In 2018, 51% of all businesses registered in South
22,088 27,493
(2016) Brisbane were in the professional scientific and technical
Registered Businesses
2,398 1,551
service industry, health care and social service industry
(2018) as well as the rental, hiring and real estate industry.
Employment • Professional scientific and technical services, rental,
+8,000 +12,000
Projections (2041)
hiring and real estate services also dominate the
Floor Space m2 270,000m2 200,000m2 industry landscape within Fortitude Valley, together
Vacancy % 12% 7.0% comprising 37% of all businesses registered within
Net Face Rents/m 2 Fortitude Valley in 2018.
$500/m2 $500/m2
(A-Grade)
New Supply (short
+60,000m2 +17,000m2
term)
Rating 6/10 Professional 7/10 Strength of
Services Homes the Fringe
Sources: PCA Office Market Report, various agents, ABS, JLL, Urban
Economics
• The health and social assistance sector clearly
dominates employment within South Brisbane, (34%)
of all workers, and represented a growth of some
2,930 workers between 2011 and 2016, reflective of
the opening of the Queensland Children’s Hospital in
November 2014.
• Almost one quarter of the workers in Fortitude Valley
were employed in the professional, scientific and
technical sector, although demonstrating a decline of
approximately 550 workers between 2011 and 2016.
Figure 3.1: Number of Employment by Industry
• Projected growth in professional and scientific industry Source: ABS
will continue to drive demand for additional commercial
office space in both SA2’s. Between 2016 and 2041,
a further 4,800 additional professional, scientific and
technical workers are projected to be working within
South Brisbane and 2,150 projected for Fortitude Valley;14 INNER CITY VITALITY REPORT 2019 | The Committee for Brisbane
• As at January 2019, the Knight Frank Brisbane Fringe • The highest sale price recorded in South Brisbane
overview portrayed high vacancy rates (14.2%) within during 2019 to date was $3million, with a median unit
the Urban Renewal Precinct (includes Fortitude Valley, price of $510,000, whilst in Fortitude Valley a $2million
Bowen Hills, Newstead, Teneriffe and New Farm) office was recorded, with a median unit price of $427,500.
market because of pre-committed new supply. After
• Median sales prices for residential units in Fortitude
being the focus of new supply during 2018, including
Valley have been declining since 2014/15 with an influx
some 33,400m2 of additions, the Urban Renewal precinct
of new stock, however, a 4.5% increase from $408,050 for
has had by far the strongest net absorption of the Fringe
the 2017/18 financial year to $427,500 for the 2018/19
precincts at 27,604m2 for 2018. This has continued into
financial year reflects some growth in the market. 258-
2019 with take-up in excess of 10,000m2 in H1 and this is
unit sales were recorded in the 2017/18 financial year,
expected to be consolidated with the mooted lease of two
compared with 121 in the 2018/19 financial year.
floors to WeWork in 25 King St.
• Median sales prices for residential units in South
• A vacancy rate for the Valley of 12% is therefore
Brisbane have been declining since 2016/17, reporting a
estimated, and a tighter 7% vacancy rate estimated
median sales price of $510,000 for the 2018/19 financial
within South Brisbane.
year. 453 sales were recorded in the 2017/18 financial
Office developments approved and under construction within year, compared with 165 in the 2018/19 financial year.
Fortitude Valley including:
• More than 110,200m2 has been approved within
Fortitude Valley; reflecting significant entry of new
supply in the medium term.
• An office tower consisting of 32,067m2 is under
construction as part of the Valley Metro redevelopment.
• Another office tower consisting of 4,564m2 is currently
under construction at 89-91 McLachlan Street.
Office supply underway in South Brisbane includes:
• The Mobo comprising 17,000m2 of commercial space
across 11 levels is currently underway at 74, 78 and 80
Tribune Street and 134 and 138 Merivale Street South Figure 3.2: Unit Sales
Brisbane. Sources: Pricefinder
3.2 The Residential Market • According to the Australian Bureau of Statistics,
both SA2s experienced a decrease in the number of
residential approvals between 2017/18 to 2018/19
Fortitude Valley South Brisbane
financial year as these markets continue to absorb
Residents (2019) 9,150 9,880 stock and development activity. Whilst Fortitude Valley
Total # units (2019) 4,920 4,576 reduced from 587 approvals in 2017/18 to 207 approvals
in 2018/19 worth $230,205,000; South Brisbane reduced
# Building Approvals
2018/19
207 366 from 658 approvals to 366 approvals worth about
$140,600,000 during the same period.
# under construction 767 216
• As reported by SQM Research, vacancy rates in both
Median Unit Price 2019 $427,500 $510,000
markets declined from 6.0% in July 2018 to 4.0% in July
# Number of Unit Sales 2019 in Fortitude Valley and from 5.3% to 3.3% over the
121 165
2018/19
same period in South Brisbane, indicative of tightening
Median Rental 2019 $480 $520 market conditions.
Vacancy 2019 4.0% 3.3%
• Median rents for both markets increased between the
6/10 Absorbing 7/10 June Quarter 2018 and June Quarter 2019 across both
Rating Supply Absorbingly
Active Market markets.
Sources: RTA, Pricefinder, ABS, SQM Research, REIQ, various agentsThe Committee for Brisbane | INNER CITY VITALITY REPORT 2019 15
• In South Brisbane, the number of new rental bonds two retail tenancies at Merivale Street, South Brisbane
recorded by the RTA for the June Quarter highlights
• Over the coming years, Kurilpa will emerge as a vibrant
a 5% decline in 2019 from 454 new bonds in 2018 to
new riverside community welcoming some 11,000
430 new bonds in 2019, whilst for Fortitude Valley, the
residents. The Kurilpa Master Plan has been released,
number of new rental bonds recorded by the RTA for
outlining the vision and strategies for the Kurilpa
the June Quarter highlights an 8.8% decline in 2019
precinct to be delivered through a range of projects
from 570 new bonds in 2018 to 524 new bonds in 2019.
commencing in the next 5 to 10 years.
We note that 2018 recorded the highest number of
new bonds seen in Fortitude Valley in the last decade, Residential supply underway in Fortitude Valley includes:
followed by 2019 which recorded 524 new bonds.
• A 27-floor residential tower called The Coterie is
currently under construction at 365 St Pauls Terrace,
Fortitude Valley. The tower will provide some 249
dwellings.
• As part of the Valley Metro redevelopment, a
residential tower consisting of 207 apartments is under
construction.
• A residential tower called Utopia consisting of 300
apartments is currently under construction at 275
Wickham Street
3.3 The Tourist Sector
Fortitude Valley is home to Brisbane’s music and late-
Figure 3.3: New Rental Bonds night entertainment scene, including the recently opened
Sources: RTA Fortitude Music Hall and supports Australia’s largest adult
entertainment precinct as well as Brisbane’s burgeoning
boutique hotel market. South Brisbane, in contrast, is
Brisbane’s cultural heart housing South Bank, the Convention
Centre, QPAC, GOMA, the Museum and State Library.
Fortitude Valley South Brisbane
Total # rooms 967 1,741
# under construction 140 -
Overnight Visitors 387,000 856,000
Rating 8/10 Boutique Hub 8/10 Event Heart
Source: STR, TRA, TEQld, Urban Economics
Figure 3.4: Median Rents (2 -bedroom unit)
Sources: RTA
Two hotels providing 197 new hotel rooms opened in South
Brisbane between 2018 and 2019 and two new hotels with
New Residential supply in South Brisbane: some 341 hotel rooms opened in the Fortitude Valley market
• A 33-level residential tower is underway consisting during the same period. Demand for hotel accommodation
of some 216 high density residential units and four is strengthening even considering the number of new rooms
commercial tenancies at 75, 77 and 79 Hope Street 7 added to the market, with more than 856,000 overnight
Lane street, South Brisbane. visitors staying in accommodation in South Brisbane during
the year ending December 2018 and 387,000 overnight visitors
• An application for 128 units was lodged in June 2019 staying in Fortitude Valley during the same period; increasing
together with retail at Hope Street, South Brisbane. from 565,000 and 328,000 overnight visitors respectively
• Another proposal by DBI design has been lodged for 189 during the year ending December 2017.
high density units within a residential tower containing16 INNER CITY VITALITY REPORT 2019 | The Committee for Brisbane
• With the opening of the upscale Callie Hotel in September more than 87,000 local, interstate and international
2018 and the 166 room Fantauzzo Art Series Hotel which visitors during the first half of its season.
opened in November 2018, there are now some 967 short
• The Queensland Performing Arts Centre (QPAC) 2017/18
term accommodation rooms within Fortitude Valley (July
annual report records more than 1,000 performances
2019), a growth from 626 rooms in 2018, representing
and 1.7million visitors; 35% of whom were from outside
an additional 341 rooms. The 103 room The Ovolo also
Brisbane.
opened as a repositioning and redevelopment of the
former Emporium Hotel, officially launched in November • To increase programming flexibility across venues, QPAC
2018. has announced the construction of a new 1,500 seat
theatre worth $150million by 2022, aimed to establish
• Similarly, the opening of upscale Atlas Apartments and
QPAC as the most significant performing arts complex in
luxury Emporium Hotel in September 2018 increased
Australia in terms of co-location of performance arts.
the total number of rooms in South Brisbane from 1,544
in July 2018 to some 1,741 short term accommodation
rooms in July 2019, representing a growth of more than 3.4 The Retail Market
190 rooms. There are some 14 hotels located within
South Brisbane including chains such as the Swiss- Valley Retail South Bank
Precincts Precinct
Belhotel, Mantra, Novotel and Rydges, as well as motels
proximate to the hospital precinct. Floor Space m2 4,760m2
(major precincts)
• The Intercontinental Hotel Group is delivering a 140-room • Emporium 13,810 m2 12,540m2
• James Street
boutique hotel Indigo in Fortitude Valley, anticipated by • Brunswick/Chinatown 8,000m 2
2020, with the Valley evolving as Brisbane’s boutique
# Restaurants & Cafes 190 110
hotel hub, including Limes, the Sage, The Calile, Alex
Perry, The Ovolo, the Fantauzzo, and Tryp. # Number of Workers 2,031 (2016) 1,821 (2016)
• Food & Beverage Sector
• Retail Sector 1,542 (2016) 428 (2016)
• Fortitude Valley is also home to Australia’s largest
concentration of adult entertainment venues, surpassing Vacancy % 12%
even Sydney’s famed Kings Cross with additional venues • Emporium
13% 8%
• James Street
also proposed. • Brunswick/ChinatownThe Committee for Brisbane | INNER CITY VITALITY REPORT 2019 17
• Between 2011 and 2016, the number of workers employed its SA2, while Fortitude Valley has around 5,300 students
within the food and beverage sector increased by some attending vocational and training institutions (VET), primary
760 persons in South Brisbane, representing a significant and secondary schools.
15% of the total employment growth in South Brisbane
• Significantly, 22% of the total growth in employment in
during the intercensal period. Within the same period,
Fortitude Valley between 2011 and 2016 was within the
the number of workers employed within the food and
education and training sector, with a growth of some 435
beverage sector increased by some 639 persons in
workers in Fortitude Valley.
Fortitude Valley, representing a significant 32% of the total
employment growth in Fortitude Valley. • Conversely, 12% of the total growth in employment in
South Brisbane between 2011 and 2016 was within the
• Some 1,542 workers were employed within the retail
education and training sector, with a growth of some 562
sector in Fortitude Valley, representing 7% of the
workers in South Brisbane. In 2016, there were 2,586
workforce in 2016 while some 428 workers are employed
workers employed in South Brisbane’s education and
within the retail sector in South Brisbane, representing
training sector.
1.5% of the workforce in 2016.
• Between 2011 and 2016, the number of student residents
New retail space underway in South Brisbane includes: in South Brisbane and Fortitude Valley studying at TAFE,
University or other (non-school) educational facility
• A total of 384m2 retail tenancy is under construction as
increased by 22% and 33% respectively, with some 3,063
one of the components of the residential tower being
resident students in South Brisbane in 2016 and some
developed on 75-79 Hope Street and Fish Lane South
2,414 students in Fortitude Valley in 2016.
Brisbane.
• South Brisbane is home to Griffith University’s South
New retail space underway in Fortitude Valley includes: Bank campus including the Conservatorium of Music and
the Griffith Film School, with other universities offering
• As part of the Valley Metro redevelopment, the
campuses and training in South Brisbane including the
residential tower has two levels of retail totalling 380m2
University of the Sunshine Coast campus. The Griffith
under construction while the commercial tower will
University campus reported a student of enrolment of
accommodate 1,560m2 of retail, food and drink.
3,195 students in 2018, whilst the Sunshine Coast Campus
• Ongoing construction of commercial space at 89-91 reported a 2018 enrolment base of 705 students. Student
McLachlan Street includes 390m2 retail space. Also, of enrolment numbers at Griffith’s South Bank campus have
note is the FV Fortitude currently under construction, remained relatively consistent over the last 5 years.
which will comprise some 3,600m2 of retail space.
• Between 2014 to 2018, the number of students enrolled
in the University of Sunshine Coast increased by some
3.5 The Education Sector 640 students from 65 in 2014 to 705 in 2018. We note that
a significant 35% of the growth occurred between 2017
Fortitude Valley South Brisbane and 2018; increasing from 483 students in 2017 to 705
# Establishments* 29 15 students in 2018.
Workforce 1,095 (2016) 2,586 (2016) • South Brisbane is also home to some VET establishments
University Students N/A 3,900 (2018)
including South Bank TAFE, with a total of 1,900 student
VET enrolments in 2018. A number of prominent
VET Students 3,750 1,900 secondary colleges are also located within South
Primary and Brisbane including the sought after Brisbane State High,
1,557 6,363
Secondary Students St Laurence’s College and Sommerville House. A total
Student beds 0 (2019) 2,382 (2019) enrolment of some 6,363 primary and secondary students
#Child Care Places 607 469 is estimated to be interacting in South Brisbane.
Rating 6/10 Watch this 8/10 Learning Hub
• Fortitude Valley is home to Torrens University’s Fortitude
Space Valley campus and it also includes the Australian Institute
*Universities, English schools, Executive and workplace training institutions of Creative Design (fashion design). All VETs within the
Sources: ABS, Griffith, Echild, NCVER SA2 accounted for some 3,750 students in 2018.
Whilst Fortitude Valley has more educational establishments • All Hallows within Fortitude Valley SA2 recorded some
(29) than South Brisbane (15), South Brisbane has more than 1,557 students in 2018.
12,000 students attending educational establishments within18 INNER CITY VITALITY REPORT 2019 | The Committee for Brisbane
Student Accommodation
• There are currently three main student accommodation
residences operating within South Brisbane providing
some 2,382 beds. UniLodge South Bank has also received
approval in March 2019 for the reconfiguration of the
double bedrooms within the building to two single beds
where required to meet student demands, increasing
potential capacity.
Child Care Centres
Figure 3.5: Population Growth
• There are 6 childcare centres within Fortitude Valley Sources: QGSO
offering some 607 licensed places for young children in
2019. • The State projections anticipate that a further 19,576
additional residents will move to South Brisbane between
• There are 3 childcare centres within South Brisbane
2018 and 2036, requiring at least 9,790 additional
offering some 469 licensed places.
dwellings to accommodate them, and supporting more
than 31,000 residents and triple the area’s current
New supply in Fortitude Valley
population base.
• The Inner-City North State Secondary College is currently
under construction and is anticipated to be open for
enrolments at the start of the 2020 school year.
• Whilst there are currently no student accommodation
residences operating within Fortitude Valley, a new $180
million international university and 30 storey tower
comprising student accommodation is mooted associated
with Torrens University.
3.6 Population & Mobility Dashboard
Fortitude Valley South Brisbane
Workers 22,088 (2016) 27,493 (2016) Figure 3.6: Population Projections
Sources: QGSO
Residents 9,150 (2019) 9,880 (2019)
Public transport % 31% (2016) 27% (2016)
• Average household sizes are on the increase in South
Walking/cycle % 11% (2016) 8% (2016)
Brisbane from 2.04 persons per household in 2011 to 2.15
Private Car 46% (2016) 46% (2016) persons per household in 2018, in part a reflection of the
Rail Passengers >5.4million (2018/19) 5 million (2018/19) mix of younger residents moving to South Brisbane, with
Rating 7/10 Busyness 7/10 Young at Heart a significant 2,404 residents aged 20-29 years in 2016.
• South Brisbane is an ethnically diverse community; only
Sources: BCC, ABS, QGSO, QT, Urban Economics estimates
41% of the population was born in Australia in 2016, and
a further 27% were born in Asian countries. A significant
South Brisbane Demographics 28% of those born in Asian countries living in South
• The share of the population calling South Brisbane home Brisbane were Chinese and a further 13% were Korean,
has increased by 45% between 2008 to 2018 and it is reflective of the important student population living within
estimated that in June 2019, there were 9,880 persons the area.
living within South Brisbane, with an additional 4,186
persons moving to South Brisbane between 2008 and
2018.The Committee for Brisbane | INNER CITY VITALITY REPORT 2019 19
Figure 3.7: Population by Age
Sources: ABS
• On average, approximately 13,700 people travelled to and
from South Brisbane daily using rail networks between
May 2018 and April 2019 increasing from almost 12,780
people using the rail network in South Brisbane between
May 2017 and April 2018. This reflects the upgrades and
improvements to the South Bank rail station.
• Some 6,362 workers travelled to work in South Brisbane
using public transport in 2011 and by 2016, this had
increased to 7,499 a growth of 15%. In comparison,
those working in South Brisbane increased 17% over Figure 3.8: Population Growth (Fortitude Valley)
this period. Significantly, approximately 28% of South Sources: ABS
Brisbane workers used public transport in 2011 and this
remained the same in 2016. • The State projections anticipate that a further 11,500
additional residents will move to Fortitude Valley between
• According to the Small Area Labour Market data, the 2018 and 2041, requiring at least 5,300 additional dwelling
rate of unemployment for those living within South units.
Brisbane increased from 5.8% in the March Quarter 2018
to 6.7% for the March Quarter 2019, remaining slightly
above the Brisbane average of 6.2% for the March
Quarter 2019. The City also recorded a slight increase
in unemployment rates from 6.0% in the March Quarter
2018, whilst the State similarly recorded a slight increase
in unemployment rate during this period.
Fortitude Valley Demographics
• An additional 3,497 persons moved to Fortitude Valley
between 2006 and 2018, representing a 4.5% increase. It
recorded the 17th largest growth in population across the
City of Brisbane between 2006 and 2018. By June 2019, Figure 3.9: Population Projection (Fortitude Valley)
it is projected that there were 9,150 persons living within Sources: QGSO
Fortitude Valley. Significant growth post 2011 reflects the
activity in new apartment construction within the area. • Only 47% of the population was born in Australia in
2016, and a further 17% was born in Asian countries. A
significant 12% of those born in Asian countries living in
Fortitude Valley were Chinese and a further 12% were
Korean.
• A significant 2,687 of residents were aged 20-29 in 2016
and the population of those 20-29 living within Fortitude
Valley has increased from 2,099 in 2011.20 INNER CITY VITALITY REPORT 2019 | The Committee for Brisbane
Figure 3.10: Population by Age (Fortitude Valley)
Sources: ABS
• Average household sizes remain one of the lowest of 3.7 The Future Of Fortitude Valley & South
all SA2s in SEQLD, although an increase in the average Brisbane
household sizes has been estimated from 1.76 persons
per household in 2011 to 1.86 persons per household in Growth Areas Projected Growth in Projected Growth in
Fortitude Valley South Brisbane
2018.
Population Growth + 11,500 to 2041 + 21,250 to 2041
• More than 14,800 people travelled to and from Fortitude
Dwellings Needed + 5,200 to 2041 + 9,500 to 2041
Valley daily by train between May 2018 and April 2019;
increasing from approximately 13,000 people using the Employment
+ 8,000 to 2041 + 12,000 to 2041
rail network in Fortitude Valley daily between May 2017 Growth
and April 2018. New Hotel Beds +280
Under Construction
• Some 6,271 workers travelled to work in the CBD using
Rating Happening Place Where the Action is
public transport in 2011 and by 2016, this had increased
to 6,866, a growth of 9%, comparable to the rate of growth
of those working in Fortitude Valley over this period. South Brisbane Future Growth
Significantly, approximately 31% of Valley workers
Moderate future public and private sector investment
utilised public transport in their journey to work in 2016,
in residential apartments, office towers, mooted major
demonstrating little to no change from 2011.
commercial space and residential apartments awaiting pre-
• According to the Small Area Labour Market data, the rate commitments, and continues to signal ongoing commitment to
of unemployment for those living within Fortitude Valley South Brisbane.
increased from 7.1% in the March Quarter 2018 to 7.9%
for the March Quarter 2019, remaining well above the
Brisbane average of 6.2% for the March Quarter 2019.The Committee for Brisbane | INNER CITY VITALITY REPORT 2019 21
Projects in South Brisbane Brisbane City Council employment forecasts for Fortitude
Valley anticipate around 8,190 additional professional and
35-39 Merivale Street Proposed Residential (189 units)
scientific workers in Fortitude Valley between 2016 and 2041.
66 Hope street Proposed Residential (128 units) Key employment growth sectors include the professional and
Fish Lane Town Square Proposed Park & Retail scientific industry, accommodation and food services workers.
75-79 Hope Street Approved Residential (216)
Office (17,000m2) Food &
Office Tower Underway
Drink (384m2)
Kurilpa Master Plan Proposed 11,000 new residents
Brisbane City Council employment forecasts for South
Brisbane anticipate around 12,860 additional workers in
South Brisbane between 2016 and 2041. Key employment
growth sectors include the professional and scientific industry,
education and training industry as well as health care and
social services.
Fortitude Valley Future Growth
A significant future public and private sector investment in
residential apartments, school, office towers, commercial
tower, mooted major commercial office towers, hotel and
residential apartments awaiting pre-commitments, and
continues to signal ongoing commitment to Fortitude Valley.
Major Projects in Fortitude Valley
New retail & office
space within China Approved Commercial
Town
Utopia Space 275 Underway Residential (300units)
Wickham Street
Redevelopment of PCYC Approved
Inner North State Underway Education
Secondary College
Torrens University Education
Campus and Student Mooted
Accommodation Residential
The Coterie – 365 St Underway Residential (249units)
Pauls Terrace
237 Barry Parade Underway Residential (267units)
167 Alfred Street Underway Residential & Commercial
527 Gregory Terrace Approved Residential (641units)
458 Brunswick Street Underway Hotel (140rooms)
40-400 Barry Parade Approved Residential (556) units
90-91 Bridge Street Approved Commercial
Residential (207units)
The Valley Metro Underway Office (32,067 m2)
Retail (1,940 m2)
Office (4,564 m2)
89 -91 McLachlan St Underway
Retail (390 m2)
Entertainment Space 52 Underway Adult Entertainment
Costin StProudly brought to you by
You can also read