UGANDA ECONOMIC OUTLOOK 2019 - PWC
←
→
Page content transcription
If your browser does not render page correctly, please read the page content below
Uganda Economic
Outlook - 2019

About PwC
At PwC, our purpose is to build trust in society and solve important problems. We’re a network of firms in 158
countries with more than 250,000 people who are committed to delivering quality in assurance, tax and advisory
services. Find out more and tell us what matters to you by visiting us at www.pwc.com
PwC Uganda
PwC Uganda helps both private and public organisations and individuals create the value they’re looking for. The
firm comprises of close to 200 professionals who are committed to delivering quality in assurance, tax and advisory
services. Our local expertise combined with collective geographic and functional knowledge of our global network,
will ensure you benefit from ideas that challenge conventional thinking and gain new perspectives. Find out more by
visiting us at www.pwc.com/ug
Our Leadership
Francis Kamulegeya Uthman Mayanja
Country Senior Partner Partner
francis.kamulegeya@pwc.com uthman.mayanja@pwc.com
Pamela N Bahumwire
Partner
pamela.natamba@pwc.com
Cedric Mpobusingye Dowson Kalemba
Partner Partner
cedric.mpobusingye@pwc.com dowson.kalemba@pwc.com
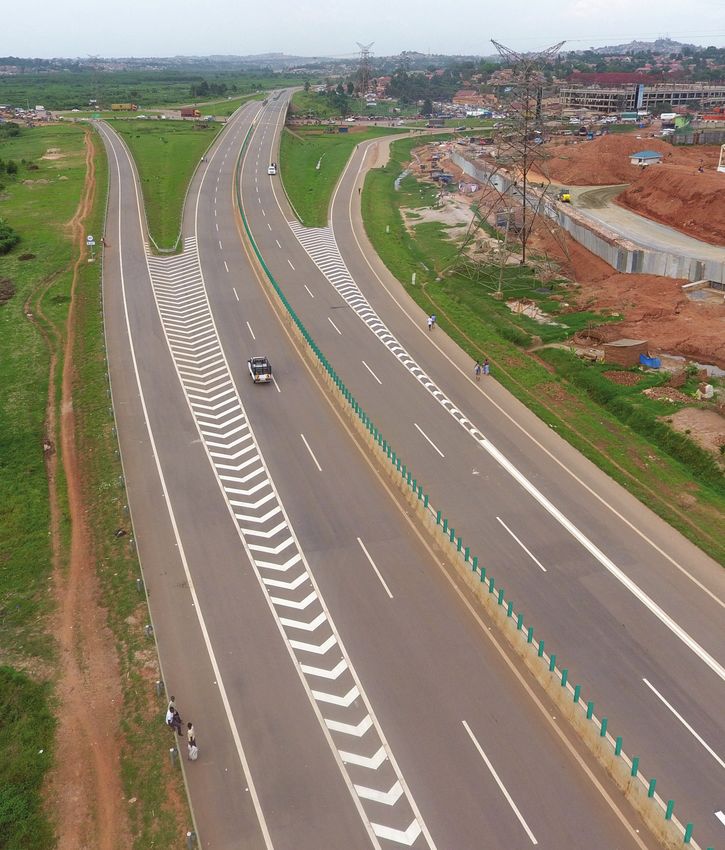
Cover page: Source UNRA. Exit to Mpigi-Busega access
2| PwC
Uganda’s economy is projected to grow by
6.2% this financial year 2018/19

The economic outlook for 2019 is very positive thanks to a recovery in the agriculture
sector, the sustained growth in services, and the continued huge investment by the
government into public infrastructure.

According to Uganda Bureau of Statistics’ (UBOS)                 The projected growth will be driven mainly by the
latest data, the economy grew by 6.4% year on year in            continued recovery in the agriculture sector.
the first quarter of FY18/19, continuing with the same
                                                                 The agriculture sector largely benefiting from favorable
momentum from the last quarter of FY17/18. This was
                                                                 weather conditions, is currently the major driver of
a major improvement from the 4.5% growth that was
                                                                 economic growth having recorded a 1.2% growth
realized in the first quarter of FY17/18.
                                                                 in the second quarter of FY18/19, up from the 0.6%
The Government is now projecting the economy to                  growth registered in the first quarter. This recovery in
grow by 6.2% in the FY2018/19. This prediction is                the agricultural sector and the associated exports has
contained in the National Budget Framework Paper                 given a major boost to the economy.
2019/20 (BFP) published by the Ministry of Finance in
December 20181.

Figure 1: Economic growth per sector over the last five years

10.0%
 9.0%
 8.0%
 7.0%                                                                                                  6.2%
                                                                                    5.8%
 6.0%             5.1%                5.2%
                                                       4.8%
 5.0%                                                              3.9%
 4.0%
 3.0%
 2.0%
 1.0%
 0.0%
                FY13/14             FY14/15          FY15/16      FY16/17          FY17/18            FY18/19
                                                                                                      (forecast)
                           Agriculture            Industry     Services        Annual GDP growth

Source: National Budget Framework Paper 2019/20

National Budget Framework Paper 2019/20
1

                                                                                    Uganda Economic Outlook • January 2019 | 3
...and the outlook for the future is even
           more positive

           The Medium term growth of the economy is also very positive. The government
           is projecting the economy to grow by 6.2% in the next financial year 2019/20,
           with agriculture, industry and services projected to grow at 3.8%, 5.6% and 7.8%
           respectively.

           Domestic demand supported by healthy private                                 Over the next two years, massive investments in
           sector credit (PSC), as well as investments in public                        infrastructure development related to the oil and gas
           infrastructure together with Foreign Direct Investment                       sector and the related expected increase in FDI inflows
           (FDI) inflows are also expected to drive growth of the                       have the potential to drive Uganda’s economic growth
           economy in FY19/20.                                                          to 7.0% or more.
           This positive outlook assumes continued good
           weather conditions, robust external demand, increase
           in FDI inflows as oil exports draw closer, and public
           infrastructure spending is properly executed as
           planned.
           At the moment, most macroeconomic fundamentals
           in the country remain positive. For example, foreign
           exchange reserves are adequate currently at 5.3
           months of import cover; consumer price inflation is
           comfortably below the BoU’s medium term target
           of 5.0%; and public debt though increasing, is still
           considered sustainable.

           Table 1: Macroeconomic and Fiscal projections and assumptions for the next three years

           Description                                                     Forecast for        Projection for   Projection for   Projection for
                                                                           FY 18/19            FY 19/20         FY 20/21         FY 21/22
           Real GDP growth                                                 6.2%                6.2%             6.2%             6.5%
           Headline inflation                                              5.1%                4.7%             4.9%             5.0%
           Expenditure as %age of GDP                                      22.7%               22.2%            19.9%            19.7%
           Domestic revenue as a %age of GDP                               14.7%               15.2%            15.7%            16.5%
           Fiscal deficit as %age of GDP (excluding grants)                6.6%                6.1%             3.7%             2.5%
           Total public debt as %age of GDP                                42.7%               44.3%            45.5%            47.8%

           Source: Ministry of Finance Planning and Economic Development and IMF Projections

4|   PwC
Although the economy is growing, it is not
creating enough jobs

The Ugandan economy is now on a path of rapid and sustained growth, however, the
number of new jobs arising from this growth has been disappointingly low. Sustained
growth of the economy was expected to create jobs, drive poverty reduction and
make growth more inclusive.

Uganda’s recent high economic growth rates have not                        This means that whereas the economy is growing,
been accompanied by high growth in jobs. This lack                         this growth has not been inclusive enough as it has
of growth in jobs has retarded poverty reduction in the                    not translated into job creation, poverty reduction and
country. For example, although the economy grew by                         significant wealth creation for Ugandans.
an average of 4.5% year on year between FY15/16
                                                                           One of the main reasons why the growth in the
and FY17/18, the number of people living in poverty
                                                                           economy has not translated in massive growth in
increased in the same period from 19.7% in FY15/16 to
                                                                           jobs is because, in the past ten years the growth has
21.4% in FY17/182.

Figure 2: GDP per capita in USD over the ten year NDPI and NDPII periods
                                                                                                                 Target for
                                                                                                                 middle income
1,200                                                                                                                            25.0%
                                                                                                                    1,039
1,000                                                                                                                            20.0%
                                                                                                         849
                                                                          767       774       799
    800      709         715         719         734         751
                                                                                                                                 15.0%
    600
                                                                                                                                 10.0%
    400

    200                                                                                                                          5.0%

      0                                                                                                                          0.0%
           FY10/11     FY11/12     FY12/13     FY13/14     FY14/15       FY15/16   FY16/17   FY17/18   FY18/19     FY19/20

Source: UBOS and Ministry of Finance Planning and Economic Development

During the last ten years the economy (measured at                         been originating mainly from investments in public
current market prices) has nearly trebled in size from                     infrastructure as well as the mining and oil and gas
UShs 35,065 billion in FY08/09 to UShs 100,531 billion                     capital intensive sectors, rather than in traditional labor
in FY17/18. However in that same period, average GDP                       intensive sectors such as agriculture, manufacturing
per capita at current prices has increased by only 23%                     and tourism.
from USD 650 in FY08/09 to USD 799 in FY2017/183.

UBOS National Household Survey Report
2

UBOS Annual GDP Publication Tables
3

                                                                                               Uganda Economic Outlook • January 2019 | 5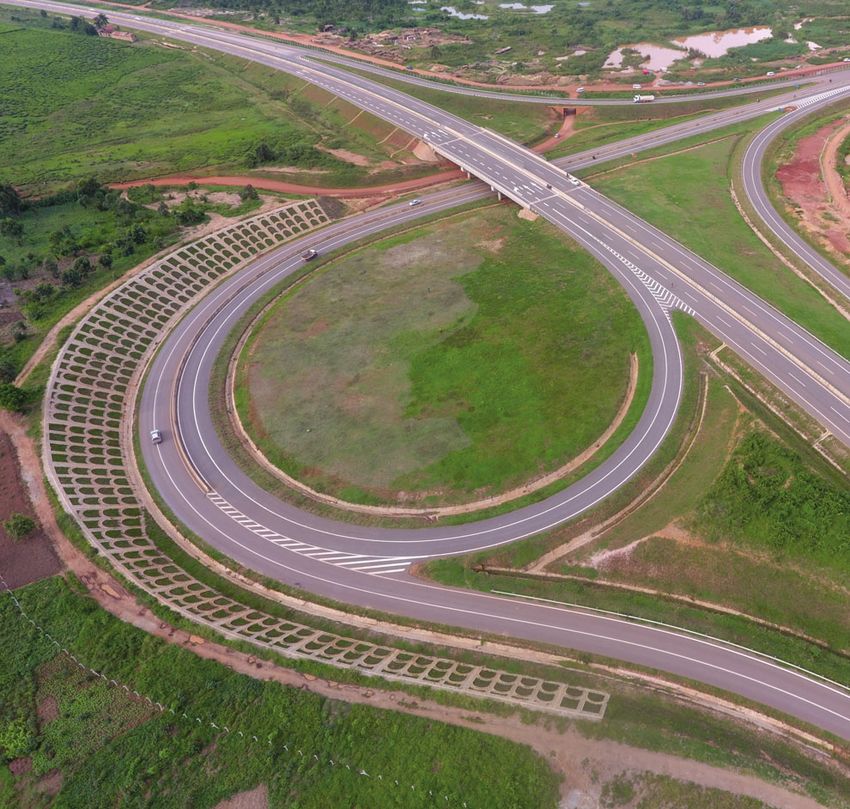
The National Development Plan II scorecard

           Uganda’s development status and trends over the two NDP periods of 2010/11 to
           2019/20 reflect an improvement in a number of areas.

           Economic growth rate during the NDPI period averaged        On the basis of the most recent data on the economy
           5.5%. However, this was below the target of 7.2% for the    published by both the BoU and Ministry of Finance, it’s
           entire NDPI. In the last five years, the economy has been   unlikely that we will be able to meet any of the above
           growing at an average rate of 4.7%. This is again lower     key NDPII targets. The government therefore needs to
           than the targeted annual growth rate of 6.3% in the NDPII   urgently come up with an economic growth strategy that
           period.                                                     will ensure that Ugandans, especially the unemployed and
                                                                       under employed youth feel the impact of the growth in the
           NDPII was designed to propel Uganda towards middle
                                                                       economy.
           income status by 2020, in line with the aspirations of
           Uganda’s Vision 2040. The Plan’s main objectives are        This impact should be felt by the population through
           to strengthen Uganda’s competitiveness for sustainable      increased jobs and employment opportunities, higher
           wealth creation, employment and inclusive growth.           incomes and a reduction in poverty. In order for Uganda
                                                                       to achieve its Vision 2040 target of a “Modern and
           The effective implementation of this Plan was to lead to
                                                                       Prosperous Country by 2030”, value addition through
           an average annual economic growth rate of 6.3% over the
                                                                       industrialization and light manufacturing linked to trade,
           five year period of 2016 to 2020, GDP per capital of USD
                                                                       tourism, agriculture, and natural resource exploitation,
           1,039 for all Ugandans by 2020, 79% of the labor force in
                                                                       while taking full advantage of the country’s demographic
           employment and a poverty level of 14.2%4 or below.
                                                                       dividend must be the key drivers, for transformation of the
                                                                       economy.

           National Development Plan II
           4

6|   PwC
Trade balance has weakened due to the high
import bill, resulting in a widening of the
current account deficit

Uganda has a systemic trade deficit as a result of the country’s dependence on fuel
imports. This has caused the country’s trade balance to weaken in the first half of
FY18/19, due to the high global oil prices.

In addition, the rise in the capital goods imports to
fund the necessary public infrastructure projects has
also resulted in an increase in the country’s import bill.
Whereas the country had realized a rise in its export
revenues, the rise was not big enough to offset the
increase in the import bill.
This weak trade position has resulted in the current
account deficit slightly deteriorating to 6.2% of GDP,
which is higher than the government’s earlier forecast
of 5.8% of GDP5.
The current account deficit is expected to trend
between 6% and 7% of GDP over the medium term.
This widening of the current account deficit is due to
weakening trade balances, rising global oil prices and
increasing capital goods imports related to the ongoing
infrastructure development projects.
However, these pressures on external balances are
expected to be partly offset by a rise in the export
revenues, as well as an increase in donor aid and
remittances inflows. This should help keep the
country’s external liquidity position stable with foreign
exchange reserves forecast to cover at least 5.3
months of imports this financial year.

Ministry of Finance: Performance of the Economy Report – November 2018
5

                                                                         Uganda Economic Outlook • January 2019 | 7
Central Bank Rate (CBR) increased to 10.0%
           in response to inflationary pressure...

           BoU has continued to pursue an accommodative monetary policy stance throughout
           FY18/19 in a bid to boost private sector credit growth and to strengthen the economic
           growth momentum.

           This has been possible because the annual core              CBR by 100 basis points from 9.0% to 10.0% in
           inflation trended below BoU’s medium term target            October, 2018. BoU felt that a slight tightening of the
           of 5.0%. However, the recent rapid rise of global oil       monetary policy was necessary to maintain the growth
           prices, together with the depreciation of the shilling in   momentum within the economy and control inflation.
           the first quarter of FY18/19, as well as the new taxes
                                                                       Despite this increase in the CBR, government is still
           introduced in the June 2018 budget, resulted in some
                                                                       confident that the economy remains on a steady path
           inflationary pressure on the economy.
                                                                       of growth supported by robust domestic demand,
           There was a concern within BoU that these inflationary      public infrastructure investments, improving agricultural
           pressures could result in a rise in core inflation within   productivity and a recovery in FDI.
           the economy. In order to curb these inflationary
           pressures, BoU increased the country’s benchmark

           ...as a result, inflation remains stable and
           contained
           In the last six months (first half of FY18/19), annual      enhancing exchange rate stability, and stepping up
           headline and core inflation averaged 3.0% and 3.4%          domestic resource mobilization growth by 0.5% points
           respectively6.                                              of GDP per annum.
           The low inflation recorded during the period was mainly
           due to the relatively stable exchange rate and favorable
           weather conditions, which resulted in an increase in
           food supplies. On this account, annual inflation remains
           within BoU’s medium term target rate of 5.0%.
           Annual headline inflation is projected to rise to 5.1%
           mainly on account of increasing oil prices and increase
           in domestic demand following a rebound in economic
           growth. However, in FY19/20 and the medium term,
           headline inflation is projected to remain stable within
           single digits and core inflation remaining close to BoU’s
           policy target rate of 5.0%.
           The country’s macroeconomic policy stance remains
           focused on containing inflationary pressures,

           Performance of the Economy – November 2018 Report
           6

8|   PwC
The Shilling has remained relatively stable
despite external pressures

After a record low of UShs 3,897 to the USD, back in September 2018, the Shilling has
recovered, and even appreciated since then.

This slight appreciation of the shilling is on account                    appreciate in the medium to long run, as a result of
of increased dollar inflows mainly from coffee export                      increased dollar inflows from exports, remittances,
receipts, offshore portfolio investors and private                         FDI and tourism; as well as the commencement of oil
transfers. The Shilling is projected to remain stable                     production.
for the remainder of FY18/19 and probably even
                                                                          Despite this optimism, the shilling remains susceptible
                                                                          to external shocks. It is therefore possible that we
                                                                          could see further sharp depreciations of the shilling
                                                                          due to the stronger than expected US dollar as well
                                                                          as the continuing global trade policy, uncertainty
                                                                          emanating from escalating trade tensions, tightening
                                                                          global financial conditions and rising geo-political risks.
                                                                          A continuation of the weak current account position
                                                                          resulting from the higher import growth may also result
                                                                          in a depreciation of the shilling. Any renewed exchange
                                                                          rate volatility of the shilling will be bad news for the
                                                                          economy and inflation in particular, as it could further
                                                                          weigh down on consumer demand by raising prices for
                                                                          imported consumer goods.

Figure 3: UShs exchange rate to the USD during the period July 2018 to January 2019

3,850                                                                                                                               2.0%
                                              1.7%
                           1.6%                                                                                                     1.5%
3,800
                                                                                                                                    1.0%
3,750                                                                                                                               0.5%
         0.0%                                                                                                                       0.0%
                                                                                               -0.3%
3,700                                                                                                                               -0.05%
                                                                                                                -0.7%
3,650                                                                         -1.1%                                                 -1.0%
                                                              -1.6%                                                                 -1.5%
3,600                                                                                                                               -2.0%
              Jul-18            Aug-18            Sep-18            Oct-18         Nov-18           Dec-18            Jan-19

                                Exchange rate                   Percantage change (gain) / loss of Ushs to the USD

Source: BoU and Ministry of Finance Planning and Economic Development

                                                                                                Uganda Economic Outlook • January 2019 | 9
Lending rates and Non-Performing Loans
           (NPLs) have been declining gradually

           Uganda has a well-developed, sound and well regulated banking system which
           compares favorably with other developing countries elsewhere in the world.

           The Uganda banking industry is currently made up         stood at 17.7%. This gradual fall in lending rates was
           of 24 commercial banks, which together have 544          partly due to the decline in BoU’s CBR from a high
           branches and 821 ATMs across the country7.               of 16.0% back in April 2016 to a low of 9.0% as at
                                                                    October 2018.
           According to the financial statements of all the 24
           commercial banks for the year ended 31 December          The gradual decline in interest rates resulted in a
           2017, the total assets of the banking sector increased   reduction in the ratio of NPLs to total gross loans
           by 12.0% between 2016 and 2017. The five top banks       across the banking sector. As of June 2018, the total
           by market share hold 62% of all total banking assets,    NPLs to gross loans had declined to 4.4% from 6.2%
           with the balance of the 38% of the assets held by the    as of June 20178.
           rest of the other nineteen banks.
                                                                    This low rate of NPLs together with BoU’s monetary
           Average lending rates charged for shilling denominated   policy framework of maintaining price stability, should
           loans have been gradually declining. As at June 2018,    feed into greater credit provision and boost demand for
           the shilling denominated loans average interest rates    credit in the private sector.

           Bank of Uganda Annual Supervision Report - 2017
           7

           Bank of Uganda Annual Report 2018
           8

10 | PwC
Credit extended to the private sector has been
on the rise despite the subdued economic
environment
Credit to the private sector and households is very important to the economy as it
contributes to consumption which in turn stimulates the economy.
The stock of total outstanding private sector credit estate and trade; each of which accounted for 20%
continued to expand in the first quarter of FY19, share of outstanding private sector credit. The other
supported by a pickup in economic recovery and sectors with big shares are personal and household
improvements in the NPL ratios. The average annual loans (18%), agriculture and manufacturing each with
growth in PSC for the quarter ended October 2018 13% shares.
was 11.3% compared to lows of 5% observed in the
However, the recent increase in the CBR has
quarter ended December 2017. The quarter-on-quarter
shilling-denominated loans on average grew by 18.5% resulted in a slight increase in lending rates
in October 2018 relative to 16.3% in July 20189. Following the increase in the CBR by BOU in October
2018, from 9.0% to 10.0%, the commercial banks’
As at the end of September 2018, the total stock
shilling denominated lending rates edged upwards
of private sector credit was UShs 13,892 billion.
from a weighted average lending rate of 19.56% in
Compared to the same month in 2017, private sector
September 2018 to 20.37% in October 2018.
credit had tremendously improved, registering a growth
of 12.5% from UShs 12,351 billion in September 2017. The increase in the lending rates was partly due to the
This improvement was supported by increases in both risk aversion tendency of commercial banks especially
economic activity and availability of cheaper credit in following an increase in the NPL ratio to the total gross
September 2018 compared to September 2017. loans which went up from 4.44% for the quarter ending
June 2018, to 4.71% for the quarter ending September
By sector, the largest holders of private sector credit
201810.
stock were: building, mortgage, construction & real
Figure 4: Private sector credit growth in the year 2018 (in UShs billions)
14,500 3.00%
14,000 13,892
2.50%
13,553
13,500 13,350 13,379
13,000
2.00%
13,000 12,900
12,780
12,580 12,600 1.50%
12,500
1.00%
12,000
11,500 0.50%
11,000 0.00%
Jan-18 Feb-18 Mar-18 Apr-18 May-18 Jun-18 Jul-18 Aug-18 Sep-18
Private sector growth Percentage change in growth
Source: BoU and Ministry of Finance Planning and Economic Development
Bank of Uganda State of the Economy Report December 2018
9
10
MoFPED Performance of the Economy – November 2018 Report
Uganda Economic Outlook • January 2019 | 11Whereas the economic outlook for 2019 is
good, there are still many risks to the economy
There are a number of external and internal risks that may affect the positive
economic outlook.
The external risks include low commodity prices and and governance, and weak public financial and
demand for the country’s exports in major markets, the investment management systems. The agricultural
appreciation of the U.S. dollar due to the expected rise sector’s susceptibility to adverse weather conditions
in interest rates in the United States, a slowdown and will always remain a major risk to the economy.
tightening of global financing conditions, which could
In addition, the government’s continued failure to meet
discourage investment and development assistance.
budget targets, together with the under-execution of
Other external risks include adverse spillover shocks the development budget remains a concern.
from some of the fragile regional neighbors, and the
The low GDP per capita, underpinned by high
continued uncertainty in the global markets and trade
unemployment and growing population, together with
as a result of the trade war between the US and China,
the ever increasing un-planned rural urban migration
and Brexit.
will result in the projected growth not being felt by all
Major internal risks to the economy include reduced Ugandans, especially the urban poor.
domestic revenue mobilization and higher public
spending on contingencies, poor institutional capacity
12 | PwCExternal debt is expected to rise as the
government continues to borrow to fund the
construction of strategic infrastructure
Infrastructure projects are among the most profitable investments any society can
make. When productive, they contribute to, and sustain a country’s economic growth,
and therefore provide the financial resources to do everything else.
According to the World Bank Report: Infrastructure According to this report, universal access to high-
Development in Sub Saharan Africa A Score Card, quality infrastructure can only be a long-term goal.
many countries in Sub Saharan Africa are trying to do On the basis of the advice and recommendations
too much infrastructure development at the same time contained in this report, it is very important that we in
and are ending up not actually doing much. Uganda, should be very careful and not aim to solve all
our infrastructure problems at once.
Some countries are giving priority to the wrong
infrastructure projects, industries and sectors and Instead, we should focus on how to best to use our
in so doing, they are devoting their limited financial, infrastructure budget to achieve the highest economic
administrative, and human resources to activities and social returns, and sustained inclusive growth.
that are not competitive and cannot generate enough
payoffs to sustain development11.
Source: UNRA Impression of Clock Tower Flyover
11
World Bank – Infrastructure Development in Sub Saharan Africa: May 2018
Uganda Economic Outlook • January 2019 | 13There is a risk that the current surge
by government in investment in public
infrastructure may deny or undercut funding
in the other growth-promoting sectors of the
economy
This is already evident by the fact that according to UBOS’ most recent data, the
percentage of people living below the poverty line has increased from 19.7% in
FY15/16 to 21.4% in FY17/18.
This increase in the poverty levels could be the economic benefits supposed to arise from these public
evidence to confirm that the surge in infrastructure infrastructure projects, but they also undermine the
expenditure has had the un-intended consequence of growth of the economy, thereby affecting the country’s
denying appropriate funds to other key sectors of the ability to repay the money borrowed to fund these
economy that are critical to poverty reduction, such as projects.
health and education.
It is therefore important that the infrastructure
The situation is made worse by the amount of public investment in Uganda, financed largely by external
resources wasted on inadequately designed, under- borrowing, is monitored very carefully to ensure that
funded, long-delayed, and poorly implemented revenue streams (generated in local currencies) are
public infrastructure projects. This does not only strong enough to meet the debt obligations (payable in
deny the public from benefiting from the expected USD) when they fall due.
Ongoing infrastructure projects in Uganda will need
to be completed and maintained. However, when it
comes to the funding and implementation of new
projects in the pipeline, it is very important that the
financing needs for these new projects is balanced
against other financing priorities in the economy.
In the presence of scarce resources available to the
government, it is very important to carry out a critical
assessment of the expected benefits of every new
infrastructure investment vis-à-vis other pressing
demands of the economy, especially education, health,
among others.
Whereas we agree with government that infrastructure
development is vital for national development and
poverty alleviation, the spending needs to be done
in a manner that reflects existing capacity within the
country as well as balanced with the other equally
important financing needs within the economy.
Source: UNRA. Kajjansi Interchange with turn to Munyonyo
14 | PwCWhereas, we share the government’s optimism
about the positive economic outlook, we are
concerned about the risk of debt distress
Budget deficits (excluding grants) averaging an estimated 5.6% of GDP over the last
six fiscal years have led to Uganda’s public debt burden rising from 26.3% of GDP in
FY 2012/13 to 41.5% in 201812.
Figure 4: Private sector credit growth in the year 2018 (in Shs billions)
45.00% 42.60%
40.00%
35.00%
30.00%
25.00%
20.30%
20.00%
15.00%
10.00%
FY FY FY FY FY FY FY FY FY FY FY FY
2008/9 2009/10 2010/11 2011/12 2012/13 2013/14 2014/15 2015/16 2016/17 2017/18 2018/19 2019/20
As at end of June 2018, Uganda’s total public debt heavily to fund its NDPII budget and the infrastructure
stock (both domestic and external) amounted to USD needed to export oil. Once the public infrastructure
10.7 billion, equivalent to Ushs. 41,326 billion. This is projects reach completion and oil production comes
equivalent to 41.5% of GDP, of which domestic debt online in FY22, public debt will begin to fall as a
accounts for 13.3% and external debt is 28.2%. percentage of GDP.
The government’s public debt is projected to continue Despite this, rapid increase in public debt, the
rising year on year as more debt is incurred to finance government has assured Ugandans that the external
the government’s infrastructure priorities. public and publicly guaranteed debt remains
sustainable in the medium and long term.
The government is projecting public debt to peak at
47% of GDP by FY20/21 as it continues borrowing
12
Background to the Budget FY 2018/19 Report
13
IMF Regional Economic Outlook – Oct 2018
Uganda Economic Outlook • January 2019 | 15The latest results of the IMF’s Debt Sustainability
Analysis shows that Uganda has moved from a
low to moderate risk of debt distress
Uganda’s risk rating has also deteriorated from low risk Therefore, although the country still has room to
to moderate risk of debt distress. This downgrade is on scale up public investment through borrowing, great
account of the significant increase in the present value care should be taken to use new loans selectively to
of the public external debt compared to revenue from support projects with high rates of return13.
exports. Any future public infrastructure and other investment
The major risks to the outlook of external debt projects will need rigorous assessment and
sustainability relate to poor performance of domestic prioritization if this limited space is to be used
revenue, low revenues from exports as well as an effectively to support growth. Increasing space for
increased rate of debt accumulation, particularly on public investment will require efforts to boost public
non-concessional terms. savings, as well as increasing domestic revenue
mobilization.
Whereas Uganda’s current debt burden is still rated as
moderate risk of debt distress, the fact that the rating In conclusion, whereas we in PwC share the
has deteriorated from “low risk” to “moderate risk” government’s optimism about the positive economic
means that the country now has limited room for more outlook, we are concerned about the deterioration of
borrowing before hitting the “high risk of debt distress” the public debt situation.
rating.
Source: UNRA. Impression of Kampala Flyover – Kitgum House (view from Crested Towers)
International Monetary Fund
13
16 | PwCOur service offerings
Audit & Assurance Integrated Tax and related Advisory & Consulting Services
We are the world’s leading global services We provide comprehensive advice
network of audit and assurance We understand that your tax and assistance to companies and
firms. outcomes and savings are governments.
dependent on the expertise,
We help companies improve their Through our Advisory & Consulting
experience and commitment of your
corporate reporting and provide Services, we bring together a full
tax advisors.
assurance that their systems are range of functional and industry
operating effectively within a well- To achieve the best outcomes, we skills and expertise to help
controlled environment. offer our clients a comprehensive businesses organizations both in the
range of tax related services private and public sectors to work
Our audit and assurance services
supported by our best assets – smarter and grow faster.
include:
our specialist tax consultants and
• Assistance on capital market Our services include:
advisers.
transactions • Business recovery services
Our tax advisory and consultancy
• Corporate reporting improvement • Capital projects and infrastructure
services include:
• Financial accounting • Corporate finance
• Customs and Excise taxes
• Financial statement audit management • Finance and accounting
• IFRS reporting • International business models and • Forensics
• Governance Risk & Compliance transfer pricing • Operations
• Digital risk and cyber security • Tax accounting services • People and organization.
• Internal audit • Global employee mobility • Strategy
• Regulatory compliance and • Compliance Management • Technology
reporting • Tax Compliance review & Tax • Transaction and support services
• Sarbanes-Oxley compliance. health checks
• Performance improvement
• Sustainability • Individual & Payroll tax services
• Mergers & acquisitions
• Tax training solutions
• Legal & Company Secretarial
services
• VAT Compliance & Planning
• Corporate Tax Planning & Advisory
• Business Start-Up & Structuring
• Tax dispute resolution
• Tax reporting and strategy
Uganda Economic Outlook • January 2019 | 17Our purpose and values
Our values define who we are, what we stand for, towards our Purpose of building trust in society and
and how we behave. solving important problems.
While we come from different backgrounds and The trust that our clients, communities and our people
cultures, our values are what we have in common. place in PwC, and our high standards of ethical
They guide how we work with our clients and each behaviour, are fundamental to everything we do.
other, inform the type of work we do, and hold us
Our values underpin our Code of Conduct which is our
accountable to do our best. They govern our actions
frame of reference for the decisions we make every
and determine our success. Our values help us work
day. It’s how we do business.
We act with
Our purpose is to build trust
We reimagine integrity in society and solve
the possible important problems.
In an increasingly complex world,
we help intricate systems function,
adapt and evolve so they can
benefit communities and society –
We make a whether they are capital markets,
tax systems or the economic
difference
systems within which business and
We work society exist.
together We help our clients to make
informed decisions and operate
effectively within them.
We care
Contact us:
PricewaterhouseCoopers Limited
1 Colville Street, Communications House
P O Box 8053, Kampala, Uganda.
Tel: +256 312 354 400 / +256 414 236 018
Fax: +256 414 230 153
For further information visit www.pwc.com/ug
This publication has been prepared for general guidance on matters of interest only, and does not constitute professional advice. You should not act upon the
information contained in this publication without obtaining specific professional advice. No representation or warranty (express or implied) is given as to the accuracy
or completeness of the information contained in this publication, and, to the extent permitted by law, PricewaterhouseCoopers does not accept or assume any liability,
responsibility or duty of care for any consequences of you or anyone else acting, or refraining to act, in reliance on the information contained in this publication or for
any decision based on it.
© 2019 PricewaterhouseCoopers Limited. All rights reserved. In this document, “PwC” refers to PricewaterhouseCoopers Limited which is a member firm of
PricewaterhouseCoopers International Limited, each member firm of which is a separate legal entity.You can also read


