2020 Outlook and Strategic Update - December 17, 2019 - AltaGas
←
→
Page content transcription
If your browser does not render page correctly, please read the page content below
2020 Outlook and
Strategic Update

            December 17, 2019
Forward-Looking Information
FLI/Non-GAAP Rider for 2020 Guidance Presentation

This presentation contains forward-looking information (forward-looking statements). Words such as “guidance”, "may", "can", "would", "could", "should", "will", "intend", "plan", "anticipate", "believe", "aim", "seek", "propose", "contemplate", "estimate", "focus", "strive", "forecast", "expect", "project", "target",
"potential", "objective", "continue", "outlook", "vision", "opportunity" and similar expressions suggesting future events or future performance, as they relate to the Company or any affiliate of the Company, are intended to identify forward-looking statements. In particular, this presentation contains forward-looking
statements with respect to, among other things, business objectives, expected growth, results of operations, performance, business projects and opportunities and financial results. Specifically, such forward-looking statements included in this document include, but are not limited to, statements with respect to the
following: 2020 normalized EPS in the range of $1.20 - $1.30; 2020 normalized EBITDA in the range of $1,275 - $1,325 million; $900 million planned capital program; estimated 2019 normalized EBITDA growth over 20%; estimated 2019 normalized FFO growth over 30%; expected 2019 debt reduction of $3
billion; expected 2019 expected debt to EBITDA ratio of approximate 5.5x; anticipated volume and in-service dates for Townsend 2B expansion and North Pine expansion; expected normalized EBITDA in 2019 of $1,200 to $1,300 million; growth in EBITDA will more than offset lost from 2019 asset sales; 15
percent EBITDA growth in Utilities and Midstream; 2020 normalized EBITDA growth and allocation by business; drivers for growth in the Utilities and Midstream segments in 2020; 2020 capital allocations by business; expected risk adjusted return of 8-10% in Utilities capital ROE and approximate 6-8x Midstream
capital EBITDA multiple; expectation that RIPET utilization will be in excess of 50,000 Bbl/d by the end of 2020; expectation to increase tolling arrangements to approximately 40% of total volumes in 2020; approximate hedged volumes in 2020 at RIPET; expectation that new customers will drive 8-10% rate based
growth; expectation of earning allowed returns in 2021; WGL ROE strategy; expected 2019 and 2020 Debt/EBITDA outlook; sources and uses of 2020 capital plan funding; planned suspension of the DRIP; estimated 2020 EBITDA seasonality; projected North American and Asian natural gas supply and demand;
anticipated spread in the Far East Index v. Mont Belvieu through November 2021; and rate case updates. Material assumptions include: assumptions regarding asset sales anticipated to close in 2020, the U.S/Canadian dollar exchange rate, financing initiatives, the performance of the businesses underlying each
sector; commodity prices; weather; frac spread; access to capital; timing and receipt of regulatory approvals; timing of regulatory approvals related to Utility Projects; seasonality; planned and unplanned plant outages; timing of in-service dates of new projects and acquisition and divestiture activities; taxes;
operational expenses; returns on investments; dividend levels; and transaction costs.

AltaGas’ forward-looking statements are subject to certain risks and uncertainties which could cause results or events to differ from current expectations, including, without limitation: capital market and liquidity risks; general economic conditions; consumption risk; market risk; internal credit risk; foreign exchange
risk; debt service risk; financing and refinancing risk; market value of common shares and other securities; variability of dividends; commitments associated with the regulatory approval of the WGL Acquisition; integration of WGL; growth strategy risk; planned asset sales in 2020; volume throughput; counterparty
credit risk; dependence on certain partners; natural gas supply risk; operating risk; changes in laws; risk management costs and limitations; regulatory; climate change and carbon tax; construction and development; RIPET rail and marine transportation; litigation; infrastructure; cybersecurity, information and
control systems risk; external stakeholder relations; composition risk; electricity and resource adequacy prices; interest rates; collateral; indigenous land and rights claims; duty to consult; underinsured and uninsured losses; weather data; service interruptions; health and safety; non-controlling interests in
investments; decommissioning, abandonment and reclamation costs; cost of providing retirement plan benefits; labour relations; key personnel; failure of service providers; technical systems and processes incidents; securities class action suits and derivative suits; competition; compliance with applicable law;
and the other factors discussed under the heading "Risk Factors" in the Company’s Annual Information Form for the year ended December 31, 2018 (AIF) and set out in AltaGas’ other continuous disclosure documents.

Many factors could cause AltaGas' or any particular business segment's actual results, performance or achievements to vary from those described in this presentation, including, without limitation, those listed above and the assumptions upon which they are based proving incorrect. These factors should not be
construed as exhaustive. Should one or more of these risks or uncertainties materialize, or should assumptions underlying forward-looking statements prove incorrect, actual results may vary materially from those described in this presentation as intended, planned, anticipated, believed, sought, proposed,
estimated, forecasted, expected, projected or targeted and such forward-looking statements included in this presentation, should not be unduly relied upon. The impact of any one assumption, risk, uncertainty, or other factor on a particular forward-looking statement cannot be determined with certainty because
they are interdependent and AltaGas’ future decisions and actions will depend on management’s assessment of all information at the relevant time. Such statements speak only as of the date of this presentation. AltaGas does not intend, and does not assume any obligation, to update these forward-looking
statements except as required by law. The forward-looking statements contained in this presentation are expressly qualified by these cautionary statements.

Financial outlook information contained in this presentation about prospective financial performance, financial position, or cash flows is based on assumptions about future events, including economic conditions and proposed courses of action, based on AltaGas management's (Management) assessment of the
relevant information currently available. Readers are cautioned that such financial outlook information contained in this presentation should not be used for purposes other than for which it is disclosed herein.

Additional information relating to AltaGas, including its quarterly and annual MD&A and Consolidated Financial Statements, AIF, and press releases are available through AltaGas' website at www.altagas.ca or through SEDAR at www.sedar.com.

Non-GAAP Measures

This presentation contains references to certain financial measures that do not have a standardized meaning prescribed by US GAAP and may not be comparable to similar measures presented by other entities. The non-GAAP measures and their reconciliation to US GAAP financial measures are shown in
AltaGas’ Management's Discussion and Analysis (MD&A) as at and for the period ended September 30, 2019. These non-GAAP measures provide additional information that management believes is meaningful regarding AltaGas' operational performance, liquidity and capacity to fund dividends, capital
expenditures, and other investing activities. Readers are cautioned that these non-GAAP measures should not be construed as alternatives to other measures of financial performance calculated in accordance with US GAAP.

EBITDA is a measure of AltaGas' operating profitability prior to how business activities are financed, assets are amortized, or earnings are taxed. EBITDA is calculated from the Consolidated Statements of Income (Loss) using net income (loss) adjusted for pre tax depreciation and amortization, interest expense,
and income tax recovery (expense). Normalized EBITDA includes additional adjustments for unrealized gains (losses) on risk management contracts, gains (losses) on investments, transaction costs related to acquisitions and dispositions, merger commitment cost recovery due to a change in timing related to
certain WGL merger commitments, gains on the sale of assets, accretion expenses related to asset retirement obligations, realized losses on foreign exchange derivatives, provisions on assets, provisions on investments accounted for by the equity method, foreign exchange gains, distributed generation asset
related investment tax credits, non-controlling interest of certain investments to which HLBV accounting is applied, and changes in fair value of natural gas optimization inventory. AltaGas presents normalized EBITDA as a supplemental measure. Normalized EBITDA is frequently used by analysts and investors in
the evaluation of entities within the industry as it excludes items that can vary substantially between entities depending on the accounting policies chosen, the book value of assets, and the capital structure.

Normalized earnings per share is calculated with reference to normalized net income. Normalized net income (loss) represents net income (loss) applicable to common shares adjusted for the after-tax impact of unrealized gains (losses) on risk management contracts, gains (losses) on investments, transaction
costs related to acquisitions and dispositions, merger commitment cost recovery due to a change in timing related to certain WGL merger commitments, gains on the sale of assets, financing costs associated with the bridge facility for the WGL Acquisition, realized gain (loss) on foreign exchange derivatives,
provisions on investments accounted for by the equity method, provisions on assets, statutory tax rate change, and changes in fair value of natural gas optimization inventory. This measure is presented in order to enhance the comparability of AltaGas’ earnings, as it reflects the underlying performance of
AltaGas’ business activities.

Funds from (used by) operations are calculated from the Consolidated Statements of Cash Flows and are defined as cash from (used by) operations before net changes in operating assets and liabilities and expenditures incurred to settle asset retirement obligations. Normalized funds from operations is
calculated based on cash from (used by) operations and adjusted for changes in operating assets and liabilities in the period and non operating related expenses (net of current taxes) such as transaction and financing costs related to acquisitions and merger commitments.

2020 Guidance Highlights                                                     ($CAD unless otherwise noted)

                    A leading North American infrastructure company that connects
                    NGL and natural gas to domestic and global markets

     Suspension                                           $1.20 - 1.30                   $1,275 – 1,325M                  $900M
     of the DRIP                                          Anticipated Normalized           Anticipated Normalized
                                                                                                                    Planned Capital Program
                                                                   EPS1                           EBITDA1

1.   Non-GAAP measure; see discussion in the advisories
See "Forward-looking Information"
                                                                                                                                              3
2019 Key Accomplishments
Setting the stage for attractive growth in 2020 and beyond

Operational Priorities                                                                Financial Priorities
    Completed key infrastructure projects                                                 Executed $2.2 billion2 of non-core asset sales
    ▪ RIPET                                                                               De-levered the balance sheet, maintained investment grade
    ▪ Marquette Connector                                                                 credit rating and regained financial flexibility
    NEBC capacity additions                                                               Timely recovery of utility expenses and invested capital
    ▪ 200 Mmcf/d Townsend 2B expansion; online Q1 2020
                                                                                          ▪   Maryland rate case
    ▪ 50 Mmcf/d Nig Creek addition; online Q3 2019
    ▪ 10,000 bbl/d North Pine expansion; online Q1 2020                                   ▪   SEMCO Energy rate case
    Executed WGL integration

Improved 2019e financial indicators

    Over 20%                                  Over 30%                                     $3 billion                              ~5.5x
  Anticipated Normalized                   Anticipated Normalized
                                                                                       Expected Debt Reduction             Expected Debt to EBITDA
     EBITDA Growth1                             FFO Growth1

                     1 Non-GAAP financial measure; see discussion in the advisories
                     2 Announced and closed                                                                                                           4
                     See "Forward-looking Information"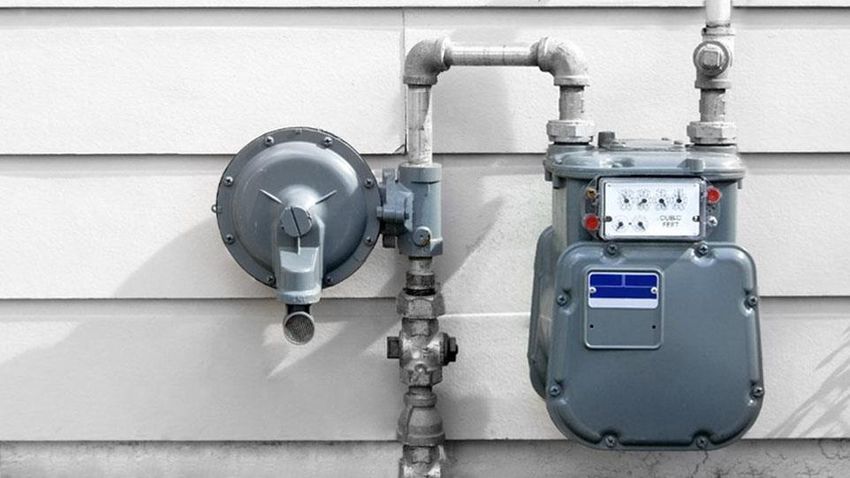
2020 Outlook

               5
Strong Growth in Base Business Underpins 2020 Outlook
    Strong growth in core Utilities and Midstream businesses                                                  EPS growth driven by lower leverage
         more than offsets lost EBITDA from asset sales                                                              and interest expense

2020 Normalized EBITDA1 Guidance2                                                               2020 Normalized EPS Guidance2
($ millions)                                                                                    (per share)
1600                                                                                                                      $1.20 - $1.30

               $1,200 - $1,300              $1,275 - $1,325

1200

 800

 400

    0
                  2019e                             2020e                                                                    2020e

                Utilities   Midstream           Power

                             1 Non-GAAP financial measure; see discussion in the advisories
                             2 Net of asset sales that are anticipated to close in 2020 (ACI)                                                       6
                             See "Forward-looking Information“.
2020 Operational Review
Growth in core business more than offsets lost EBITDA from asset sales
Utilities: Leveraging our core distribution footprint 2020 Normalized EBITDA1,2 Growth ($ millions)
▪ Increase utilization of the Accelerated $1,275 - $1,325
$1,200 - $1,300
Replacement Programs
▪ Invest in aging infrastructure and grow +7%
earnings through rate base investment $125 MM
▪ Reduce incoming leak rates to lower lost due
operating costs to 2019
asset +9%
sales
Midstream: Leveraging our core export strategy
▪ Expand existing gathering, processing ~$1,125 +2%
and fractionation systems
▪ Extend our facility network footprint
and control supply
▪ Leverage our RIPET first-mover
advantage and integrated value chain Over 15% Growth
in Base Business3
1 Non-GAAP financial measure; see discussion in the advisories
2 Assumes ACI transaction completed mid-2020 7
3 Represents growth in the base business net of the impact of lost EBITDA in 2020 associated with 2019 asset sales2020 Normalized EBITDA1 Drivers
Normalized 2020E EBITDA1 Growth Drivers
2020 Normalized EBITDA1 Guidance2
($ millions)
▲ Rate base growth through disciplined
investment in aging infrastructure
$1,275 - $1,325
▲ Achieving higher returns on equity
Utilities ▲ Cost-reduction initiatives and decreasing
leak rates
▲ Customer growth
▼ Sale of ACI
Utilities Midstream
▲ Full year and increased utilization of RIPET ~55% ~40%
▲ Higher volumes at Northeast B.C. facilities:
North Pine, Townsend and Aitken Creek
Midstream
▲ Higher expected margins on U.S. Midstream
storage and transportation
Power
▼ Asset sales ~5%
Power ▼ Asset sales
1 Non-GAAP financial measure; see discussion in the advisories
2 Pie chart percentages are net of corporate segment EBITDA of ($40 - $45 million) 8
See "Forward-looking Information“2020 Disciplined Capital Allocation
Strong organic growth drives robust risk-adjusted returns
~$900 million in top-quality projects anticipated to drive earnings growth
Capital Allocation Criteria:
Power Corporate
2% 2% Strong organic growth potential and strategic fit
Identified Projects: Identified Projects:
▪ MVP – Southgate ▪ Accelerated Pipe
Expansion Replacement
▪ Townsend Programs in Strong commercial underpinning
Expansion Michigan, Virginia,
▪ North Pine Midstream Maryland and
Expansion 18% Washington, D.C. Strong risk-adjusted return:
▪ Customer growth
▪ System betterment Utilities Capital ROE: ~8-10%
across all Utilities
Midstream Capital EBITDA Multiple: ~6-8x
Utilities Capture near-term returns by maximizing spending through
78%
Accelerated Replacement Programs
See "Forward-looking Information" 9RIPET – 2020 Operational Overview
Strong performance; positioned for growth
▪ Increased utilization - strong interest from producers supports
volumes ramping up to exit 2020 at ~50,000 bbl/d
RIPET 2020e
▪ ~80% of expected 2020 volumes hedged including tolling Hedged Volumes
Highlights
~20,000 bbl/d hedged at US$10/bbl FEI-Mt. Belvieu
▪ Expect to increase tolling arrangements
to ~40% of total volumes in 2020
Hedged Tolling
▪ Current rail offloading capability: ~40% ~40%
50 - 60 rail cars per day on average
▪ Operational and logistical improvements
along the value chain:
Operations Exposed
▪ Pursuing investments in improving rail infrastructure ~20%
▪ Optimizing rail car offloading capabilities
▪ Investing in real-time data technology to
improve overall rail logistics
See "Forward-looking Information“ 10Processing – 2020 Operational Overview
Increased utilization and expansions drive growth
Northeast B.C. Midstream Operating Capacity
Processing
800 70,000
700 60,000
▪ Projects coming online in 2020 add significant volume 600
Fractionation Capacity (bbl/d)
Gas Processing (MMCF/D)
growth supported by increased take-or-pay commitments 50,000
500
▪ Full year benefit of Northeast B.C. capacity additions:
40,000
▪ 200 Mmcf/d Townsend 2B expansion; online Q1 2020 400
▪ 50 Mmcf/d Nig Creek addition; in service Q3 2019 30,000
300
▪ 10,000 bbl/d North Pine expansion; online Q1 2020
20,000
200
100 10,000
0 -
2016 2017 2018 2019e 2020e
Base Gas Processing Townsend Gas Processing
Aitken Gas Processing Fractionation Capacity
See "Forward-looking Information“ 11Utilities 2020 Growth Drivers
Grow earnings through rate base investment
Investment in aging infrastructure and attracting new customers
is expected to drive strong rate base growth of 8 - 10%
Rate Base Growth (US$ millions)
Opportunities
▪ Disciplined approach to maintaining and
replacing aging infrastructure
▪ Enhance capital efficiency through increased
utilization of Accelerated Replacement Programs
▪ Improve business processes and drive
down costs
▪ Invest in the customer experience
(~1% customer growth)
Leads to higher earned ROEs
2018a 2019e 2020e 2021e
See "Forward-looking Information“ 12WGL ROE Strategy
Path to earning our allowed returns at WGL
Strategy in place with a clear line of sight to allowed returns in 2021
Key initiatives to achieving allowed returns: Anticipated Return On Equity
& Expected Timeline
1. Capital Discipline:
▪ Accelerated Replacement Programs ensure timely ~9.4%
recovery of invested capital 2 - 3% ROE
▪ Drive returns through the execution of strategic projects US$
~US$40-50 M
Earnings
27M
2. Rate Cases: update rates to reflect current plant and
operating costs
▪ Maryland (MD) rate case US$27 million Expected Q4 End Early End End
▪ DC rate case - expiry of stay-out period in 2020 Timeframe 2019 2020 2021 2021 2021
3. Cost Management:
▪ Optimization and cost-reduction initiatives underway
▪ Leak remediation program launched with expected MD Cost DC Cost
Current 2021e
cost-savings realized through to year-end 2021 Rate Reduction Rate Reduction
Case Order Initiatives Case Order Initiatives
13Utilities Segment Capital Spend
Disciplined approach to capital focused on strategic projects and Accelerated Replacement Programs
Designed to earn immediate returns and increase capital efficiency
through approximately 25% growth in ARP spending
2019e Utilities Capital 2020e Utilities Capital
(US$ millions) (US$ millions)
~$650 million ~$530 million
New
Marquette Business
Connector1 ARP
31% 18%
23%
ARP
45%
Increased utilization of ARPs
Maintenance
Maintenance 37%
New
31% Business Managing
15% maintenance
spending to align
with depreciation
1 Marquette Connector Pipeline successfully in-service in 2019
See "Forward-looking Information“ 14Maintain Investment Grade Credit Rating
Entering 2020 with significantly stronger financial footing
Solid foundation to capitalize on significant organic growth opportunities
10.1x ▪ Commitment to investment grade credit rating
▪ Regained financial flexibility and improving
Debt/EBITDA metrics
Improved
~5.5x Debt / EBITDA ▪ Stronger access to debt markets
Outlook: 5.5x or less
Issuer Credit Ratings2
S&P Fitch Moodys DBRS
BBB- BBB BBB (low)
AltaGas
(stable) (stable) (stable)
BBB Baa1
SEMCO
(stable) (stable)
BBB- BBB Baa1
WGL Holdings
2018 2019E 2020E+
(stable) (stable) (stable)
Net Debt / Net Debt / Net Debt / A- A- A2
Washington Gas
EBITDA1 EBITDA1 EBITDA1 (stable) (stable) (neg)
1 Non-GAAP measure; see discussion in the advisories
2 As at December 12, 2019, bolded ratings reflect changes made in December 2019 15
See "Forward-looking Information“.2020: Self-Funded Model
Growth in cash flow eliminates need for common equity and provides funding flexibility
2020 capital plan funded internally and focused on projects
with near-term returns
2020e Sources and Uses
($ millions)
$1,800
~$1,600 ~$1,600
$1,600 Leverage
Asset Sales and/or
Borrowing Potential Debt
decreasing
$1,400 Repayment through
asset sales ▪ Suspension of the DRIP program supported by
$1,200 ACI
Asset Sale Dividends
EPS growth
$1,000
▪ Asset sales continue to provide efficient source
$800
FFO
Capital of capital to further strengthen the balance sheet
$600 Program
$400
$200
$0
Sources Uses
See "Forward-looking Information“ 162020e EBITDA Seasonality
Utilities seasonality driving quarterly EBITDA profile
Consolidated Normalized 2020e Midstream Normalized 2020e Utilities Normalized 2020e
EBITDA1 By Quarter EBITDA1 By Quarter EBITDA1 By Quarter
~25% ~25% ~25% ~25%
~40%
~50%
~30%
35%
~20%
~10%
~10%
~5%
Q1 Q2 Q3 Q4 Q1 Q2 Q3 Q4 Q1 Q2 Q3 Q4
1 Non-GAAP measure; see discussion in the advisories
See "Forward-looking Information“ 172019: Outlook Unchanged
2019 Normalized EBITDA1 Guidance 2019 Net Debt Decrease
($ millions) ($ millions)
1,600
~$3 billion
$1,200 - $1,300 in debt
repayment
1,200
800
400
-
2019e
YE 2019e Net Debt
Utilities Midstream Power
1 Non-GAAP financial measure; see discussion in the advisories
2 Includes 2019 asset sales announced to date 18
See "Forward-looking Information"Launched our Inaugural ESG Report
To earn the right to grow, we must continue to integrate ESG considerations into the execution of our strategy
The report outlines our 2018 performance in several key areas relevant to the long-term
sustainability of our business, and demonstrates our ongoing commitment to transparency
and improved reporting in the future. Learn more at www.ESGatAltaGas.ca.
19Appendix
20World-Class Assets ($CAD unless otherwise noted)
$5.5B $1.2 - 1.3B $2.2B $21B
Market Cap1 2019e Normalized Asset Sales in 20191 Total Assets
EBITDA2
1.9Bcf/d 54,500bbl/d 80,000bbl/d
Gas Processing3 Fractionation4 Export5
US$3.7B 5 1.6 Million
Rate Base U.S. Jurisdictions Customers
1. As at December 10, 2019
2. Non-GAAP measure; see discussion in the advisories
3. Based on ALA working interest capacity in FG&P and extraction
4. Based on ALA 100% working interest facilities and ALA % capacity in non-operated facilities 21
5. Includes RIPET and ALA working interest in FerndaleOur Business Strategies are Straightforward
Low-Risk, High-Growth Utilities and Midstream Company
Low-Risk Regulated Utilities Opportunity-Rich Integrated Midstream
Utilities Global
Distribution Export
Leveraging our Core Leveraging our
Distribution Footprint Core Export Strategy
Steady and predictable Utilities business and high-growth integrated Midstream
assets provide a strong foundation to deliver attractive risk-adjusted returns
22Midstream Update
23Our Midstream Strategy is Straightforward
Maximize utilization of existing assets and pursue capital efficient high-return expansions
Invest ▪ Continue to build upon our export competency
Midstream
▪ Diversify and grow our customer base to help
mitigate counterparty risk
Grow
▪ Optimize existing rail infrastructure to gain scale
and efficiencies
Global
Export Leverage ▪ Increase throughput at existing facilities while
maintaining top-tier operating costs and
environmental standards
Partner ▪ Leverage and maintain strong relationships with
First Nations, regulators and all partners
Leveraging our
Core Export Strategy ▪ Mitigate commodity risk through effective hedging
Protect programs and risk management systems
Leverage export strategy and our integrated value chain to attract volumes
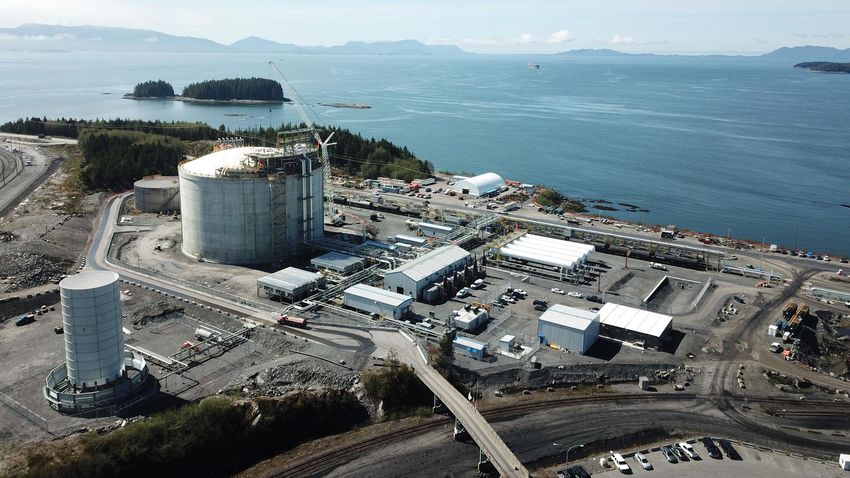
24Premier Midstream Business Connecting
Canadian Producers to Global Markets
Leverage RIPET and our integrated
value chain to attract volumes
Montney Basin
Key Assets: Strategic Benefits:
▪ Ridley Island Propane ▪ Global demand market access
Export Terminal (RIPET)
▪ Leverages existing assets
▪ Ferndale Terminal
▪ Increases producer netbacks
▪ Townsend Expansion
▪ Expansion of existing assets
▪ Aitken Creek Development
▪ North Pine Expansion
Opportunities: Strategy:
▪ Continued Montney ▪ Build on export competency
LPG growth driven by
▪ Leverage first-mover
condensate demand
advantage
▪ LNG Canada and
▪ Increase throughput at
Coastal Gas Link
existing facilities
▪ Increasing Asian
▪ Optimize rail infrastructure
demand for LPG
See "Forward-looking Information" 25Integrated Service Offering with Access to Global Markets
Increasing returns along the integrated value chain
Gas Processing &
9X – 10X Gathering Field Fractionation,
Liquids Handling Storage and Rail
CUMULATIVE
CAPEX PER Loading
Integrated
Economics EBITDA Export Terminal
5X – 6X
Potential to ~double in
RIPET EXPANSION size with minimal capital
Townsend Aitken, Townsend, North Pine North Pine
Aitken Creek Pipelines and Townsend Truck RIPET
Inga Terminal
Integrated Step Step Step Step Step
NGL value
chain 1 2 3 4 5
NATURAL GAS LIQUIDS (NGL) LIQUIDS HANDLING AND FRACTIONATION AND PROPANE STORAGE, VERY LARGE
PROCESSING UNIT TRANSPORTATION OTHER PROCESSING REFRIGERATION UNIT AND GAS CARRIER (VLGC)
REFRIGERATED STORAGE TO ASIA
TANK
From wellhead to global markets
See "Forward-looking Information" 26Abundant North American Natural Gas Supply
Excess propane supports development of incremental export capacity
Abundant supply of North American natural gas Propane supply growth continues to outpace demand
▪ U.S. natural gas production expected to grow 30% by 2023 ▪ As NA gas supply continues to shift to liquids rich basins, liquids
production is on the rise
▪ Shift towards liquids rich development targets
▪ NA propane supply is outpacing NA demand
▪ WCSB Montney is a world-class liquids rich resource generating the
lowest break-evens in North America ▪ Exports are required to balance the market in both Canada and the Gulf
▪ North American supply growth driven by condensate demand and LNG export ▪ WCSB propane supply outpaces demand by more than 100,000 bbl/d
projects
▪ Prices expected to remain relatively low for the long term
▪ WCSB supply trapped due to lack of egress and market development
Bcf/d NA Supply / Demand Growth by Basin Mbls/d WCSB Propane Supply & Demand
140 450
120 400
100 350
80 300
60
250
40
200
20
150
0
100
2007
2008
2009
2010
2011
2012
2013
2014
2015
2016
2017
2018
2019
2020
2021
2022
2023
2024
2025
2026
2027 50
Gulf Coast Mid-Continent Rockies/San Juan 0
2015 2020 2025 2030 2035
Permian WCSB (No Montney) WCSB Montney
Appalacia Total N.A. Demand Available for Export Demand WCSB Supply
Source: Wood Mac
27Supply/Demand Imbalance Supports Export Capacity Growth
Opportunity to grow Canada’s West Coast LPG export capacity
Increasing demand in Asia Supply/demand imbalance supports strong spreads
▪ Natural gas and propane are low-cost sources of clean fuel ▪ WCSB growth is constrained by regional market access putting sustained
pressure on AECO
▪ China and India demand grew by 17% and 8% annually
between 2012 and 2017 ▪ North American LPG supply/demand imbalance is expected
to keep prices low
▪ Asian demand expected to grow by ~18% over the next 10 years
▪ Growing Asian demand will continue to support Canadian exports
LPG Demand in Asia
Mbls/d Propane: Far East Index vs. Mont Belvieu
US$/bbl US$/bbl
7,000 $40 $16
FEI-MBV Spread FEI MBV
6,000 $35 $14
5,000 $30 $12
Forward Price
$25 $10
4,000
Spread
$20 $8
3,000
$15 $6
2,000
$10 $4
1,000
$5 $2
- $- $-
Asian LPG Demand
Source: Wood Mac & ICE
28RIPET: Providing Enhanced Netbacks to Producers
At current propane prices1 the RIPET advantage results in a significant increase in
our producers realized price
Alberta3
US$11.05/bbl
Ft. Saskatchewan
RIPET
AFEI2 10
US$34.52/bbl days
Japan Mt. Belvieu
25 US$21.55/bbl
days
1 Propane prices as at December 13, 2019
2 Average 2020 forward Far East Index price as at December 13, 2019
3 Mt. Belvieu minus $0.25 US/gal
See "Forward-looking Information" 29Utilities Update
30Utilities Strategy - Drive Operational Excellence
Priorities
▪ Maintain safe and reliable infrastructure
▪ Enhance overall returns via complementary
Utilities businesses and cost-reduction initiatives
Distribution
▪ Attract and retain customers through
exceptional customer service
▪ Improve asset management capabilities
Leveraging our Core
Distribution Footprint
Enhance the value proposition for our customers
31Our Utilities Business Operating Model
Safe and reliable, high-growth competitive strategy
Opportunities
▪ Improve business processes and drive
down leak remediation costs, reinvesting
savings into improving the customer
Operational
Excellence experience
▪ Invest in aging infrastructure; grow
earnings through rate base investment
▪ Utilization of the Accelerated
Build a competitive Replacement Programs
operating advantage
32Rate Case Update
Focused on Timely Recovery of Capital
Equity Thickness
Rate Case Revenue ROE Approved Notes
Approved
• Final order released December 6,
Filed May 31, 2019,
SEMCO 2019
includes the Marquette Received: US$19.9 MM Received: 9.87% Received: 54%1
(Michigan) • New rates to be implemented
Connector Pipeline
January 2020
▪ Final order released October 15,
WGL
Filed April 22, 2019 Received: US$27 MM Received: 9.7% Received: 53.5% 2019, new rates implemented at that
Maryland
time
▪ Rate case decision issued in
August 2019
▪ CINGSA is required to make a
CINGSA Filed in 2018 based on tariff filing proposing formula rates
Received: US($9) MM Received: 10.25% Received: 53%
(Alaska) 2017 historical test year by February 14, 2020
▪ Next rate case filing by July 1, 2021
based on calendar year 2020 test
year
1 Represents SEMCOs permanent equity capital
2 On September 16, 2019, a Hearing Examiner’s report was issued in response to the Virginia rate case filed in July 2018 and recommended a US $11.2 million rate increase associated with the
roll-in of SAVE surcharges, a 9.2 percent return on equity and 53.5 percent equity thickness. On October 21, 2019, Washington Gas filed comments on and exceptions to the Hearing Examiner's report,
recommending the State Corporation Commission of Virginia reject certain of the Hearing Examiner's findings. A final decision is pending.
33
See "Forward-looking Information"You can also read