Investor Presentation - FY17 HALF YEAR RESULTS - Flight Centre Travel Group
←
→
Page content transcription
If your browser does not render page correctly, please read the page content below

Investor Presentation
                        FY17 HALF YEAR RESULTS
Agenda

KEY HIGHLIGHTS
Graham Turner (CEO)

FINANCIAL RESULTS
Adam Campbell (CFO)

STRATEGIC UPDATE
Melanie Waters-Ryan (COO)

OUTLOOK
Graham Turner (CEO)

QUESTIONS

RESULTS HIGHLIGHTS

   Strong sales growth
   • Increased ticket sales in low yield environment, leading to record 1H TTV &
     outpacing market growth

   Improved productivity
   • TTV growth outpacing network growth rate, despite deflationary impacts on
     airfares – TTV per person increasing
   Business transformation
   • Ongoing investment in new tools & systems – product & pricing, customer,
     finance & digital - Contributing to rapid online sales growth

   Balance sheet strength
   • $350m + in positive net debt

   Expansion in key markets
   • 1st major push on to Continental Europe

   New Global HQ
   • About 2000 staff relocated to South Point building (Brisbane) during 1H
MARKET-SHARE GROWTH

                             1H FY17
     12%
     10%
      8%
      6%
      4%
      2%
      0%
           FLT's International   Australian    FLT TTV GROWTH
              Ticket Sales     Outbound Travel
           Growth (Australia)      Growth
PRODUCTIVITY GAINS

  TTV per person increasing in local currency compared to 1H FY16

    Nation/Region              Change
    Australia                  1.2%
    New Zealand                5.2%
    South Africa               7.8%
    Europe                     4.5%
    Canada                     7.2%
    United States & Mexico     4.0%
    Greater China              6.5%
    India                      6.5%
    UAE                      (10.7%)
    Singapore                 (4.8%)
KEY HIGHLIGHTS
New revenue streams in FY17
Acquisitions New Markets New Offerings
Network of corporate Continental Europe Interest-free holidays
travel businesses in
Germany, Sweden, Namibia Expanded range of
Norway, Denmark & Captain’s Packages
Ireland (Leisure) (CPs)
Finland
Wales Leisure & corporate
Ignite Travel Group
(49% holding) apps
China outbound
market Transactional websites
Travel Tours Group
(India) Now in 20 countries Artificial intelligence
(10 new since May tools
Sunny (China) – 2014)
announced today
BECOMING TRULY GLOBAL

10 New Countries Since May 2014

                                                    Sweden
                                      Norway       Dec. 2016
                                     Dec. 2016

                             Denmark
                             Dec. 2016                              Finland
                                                                   Dec. 2016
                         Germany
                         Dec. 2016

                         Ireland
                        May 2014

                           Netherlands
        Mexico              Mar. 2016
       Jul. 2015

                                                                   Malaysia
                                                                   Nov. 2015

                                      Namibia
                                     Jan. 2017

                                           : FLT May 2014
                                           : FLT expansion in the past 33 months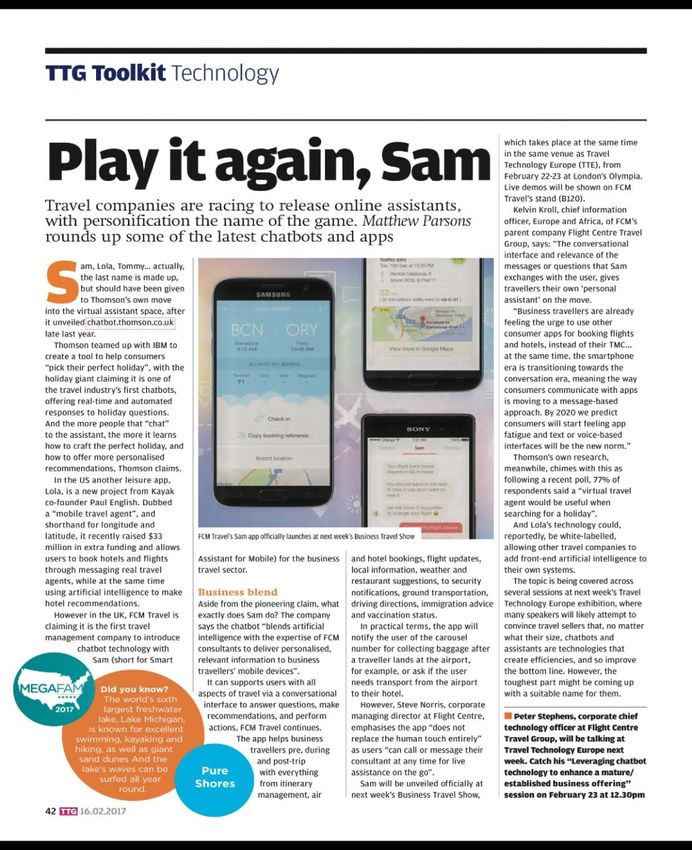
Agenda

KEY HIGHLIGHTS
Graham Turner (CEO)

FINANCIAL RESULTS
Adam Campbell (CFO)

STRATEGIC UPDATE
Melanie Waters-Ryan (COO)

OUTLOOK
Graham Turner (CEO)

QUESTIONS

FINANCIAL RESULTS
Group profit & loss
AUD 1H FY17 1H FY16 PCP change
Continued TTV growth – 20th year-on-
$m $m % year increase in 21 years since listing
Group TTV 9,343 9,182 2%
Operating revenue relatively flat –
Operating revenue 1,236 1,243 (1%)
Other revenue 15 15 (1%)
airfare deflation impacting short-term
Total revenue 1,251 1,258 (1%) growth, along with FX
Other income 4 11 (65%)
Reasonable success in cost control –
Employee benefits (690) (689) 0% increased marketing spend (1.1% of
Marketing expense (105) (96) 9%
Finance costs
TTV) to highlight cheap fares & drive
(12) (13) (8%)
D&A (36) (31) 16% demand
Other expenses (302) (282) 7%
PBT 109 157 (30%) $5m increase in 1H D&A expense –
Underlying PBT 113 146 (22%) reflects higher cap-ex in recent periods
EPS (cents) 73.7 115.7 (36%)
20 basis point decline in underlying 1H
Business teams 2,937 2,943 (0%)
income margin
Margins
Underlying Income Margin 13.4% 13.6% (0.2%)
Underlying PBT Margin 1.2% 1.6% (0.4%) Underlying PBT adjustments:
Marketing % TTV 1.1% 1.0% 0.1%
FY17: Cost of exiting Employment
Office
FY16: $11m gain from ACCC fine
refund
CONSISTENT TTV GROWTH

            GROWTH THROUGHOUT THE ECONOMIC CYCLE
   10

   8

   6

   4                                              TTV ($billion)

   2

   0
        1H10 1H11 1H12 1H13 1H14 1H15 1H16 1H17
INCOME MARGIN
Decline in
underlying
income margin
driven largely by
product mix
changes Lower
corporate
gross margins
in Australia Corporate change
driven by business
Growth in online mix (growth in high
leisure sales at profile but low
margin accounts) &
lower margins competitive pressure
in relatively soft
domestic market1H CHALLENGES
Economic Under-Performance
Airfare Deflation FX Fluctuations Uncertainty (Q1) in Some Countries
Fares significantly cheaper Affecting overseas result Circa $2.9m decline in 1H
Leading to soft July results
than during PCP (discounting translation into AUD, profits in Asia & Middle East
globally
started during 2H FY16) particularly from GBP region
Soft profit results from
Impacting Australia, USA, 5.6% 1H TTV growth at like-
Stronger 2Q results achieved touring businesses ($9.6m
India & Singapore for-like exchange rates
reduction in 1H earnings)
Predominantly affected by FX,
Sales volume growth Excluding July, TTV increased
Circa $8million impact on 1H as well as reduced trading
generally outpacing TTV & 3.4% globally and 6.2% in
PBT profits (Passenger growth but
revenue growth Australia lower load factors)IMPACT OF CHEAP FARES
Opportunities
Stimulates demand -
stronger sales volumes
Opportunities to increase
land & other add-on sales
Challenges
Lower ticket prices leading
to reduced TTV growth
Lower revenue per
transaction in leisure travel,
given FLT typically earns a %
of the fare
Can impact dollar-based super over-ride targets – FLT not
currently anticipating any significant issues during FY17
given that contracts were negotiated in similar low fare
environmentFINANCIAL RESULTS
Segment highlights Geographic & Business Diversity
Record TTV in LC in 9 of FLT’s 10
countries & regions Growing in key markets ...
Record profit in LC in Europe, South Combined North
America &
Africa & on Mainland China Europe TTV
30%
Brand & geographic diversity an
ongoing strength:
Corporate brands generated 34% 70%
of 1H TTV - consolidating FLT’s
position as one of world’s largest And in key sectors...
corporate travel managers
Other
12%
30% of 1H TTV generated in
Europe & the Americas
Leisure
Corporate 54%
34%FINANCIAL RESULTS
Segment results
Australia Continued TTV growth – exceeded $5b
for 1st time & sold travel valued at more
AUD 1H FY17 1H FY16 PCP change than $27m each day on average
$m $m %
Accelerated ticket sales growth –
TTV 5,084 4,860 5%
international ticket numbers up 10%
External Revenue 641 622 3% (strongest 1H ticket growth since FY12)
Adjusted EBIT 98 113 (13%)
Strong growth in several key sectors –
Business teams 1,554 1,568 (1%)
international & domestic flights, hotel
Margins
room nights, cruise, FX, youth sector,
Income Margin 12.6% 12.8% (0.2%)
Adj. EBIT % Revenue 16.4% 19.6% (3.2%) online
Good forward bookings for Europe
Key corporate client contract wins
including ANZ Bank and NSW
Government
Income margin affected by lower
corporate gross margins (large
accounts & competitive environment) +
business mix (growth in online)FINANCIAL RESULTS
Record 1H TTV – exceeded $US1b for 1st
USA (including Mexico)
time
AUD 1H FY17 1H FY16 PCP change
$m $m %
Strong contributions from StudentUniverse
& Corporate Traveller
TTV 1,333 1,260 6%
Increased leisure losses, reduction in
External revenue 145 142 2%
wholesale losses (GOGO)
Adjusted EBIT (6) (5) (18%)
Business teams 290 326 (11%) Reduction in GOGO & Liberty sales teams
Margins
Income Margin 10.9% 11.3% (0.4%)
Solid productivity growth – up 4% across
Adj. EBIT % Revenue (4.0%) (3.5%) (0.5%) the region
Small profit contribution from Mexico
corporate business
Digital North Atlantic (dNA) area created
Liberty micro-store open & performing well
Solid start to 2H and likely to be profitable
YTD by end of this monthTHE US MICRO-STORE MODEL
1st Liberty micro-store now open
in Tysons Corner Mall (Virginia)
& performing well
2 more planned for FY17 – Walt
Whitman Mall (Long Island) &
Annapolis (Maryland)
Low fit-out costs + low staff
requirements =cost effective
entry to prime mallsFINANCIAL RESULTS
Europe Solid recovery after Brexit shock
AUD 1H FY17 1H FY16 PCP change Record 1H TTV & profit in LC with
$m $m %
strong 2Q results & momentum
TTV 919 1,092 (16%)
Strongest ever profit recorded in
External revenue 128 153 (16%) January 2017
Adjusted EBIT 18 23 (23%)
Good 1H performance from UK
Business teams 300 295 2%
corporate business
Margins
Income Margin 13.9% 14.0% (0.1%) 4.5% productivity increase
Adj. EBIT % Revenue 13.8% 14.9% (1.1%)
Growth in Journeys & Escapes land
sales
First significant online push – BYOjet,
StudentUniverse & gapyear merger
FX translation will impact FY17 results,
as was case during 1HSTRONGER EUROPEAN FOOTPRINT
Corporate European
Traveller corporate
introduced in acquisitions to
Netherlands strengthen FCM
Presence in 5 key
countries + proprietary
online booking tool for
SME customers
Leisure offering BYOjet launched
launched in & performing
Dublin well
StudentUniverse
merged with
gapyear.com in
UKFINANCIAL RESULTS
Reasonable results from established
Rest of World businesses in South Africa (record
profit in LC), Canada (continued
AUD 1H FY17 1H FY16 PCP change
improvement & reduced losses) & NZ
$m $m %
TTV 1,826 1,781 3%
Expansion into Namibia
External revenue 207 201 3% Disappointing bottom-line results from
Adjusted EBIT 2 5 (60%) combined Asia Middle East region (circa
Business teams 787 750 5%
$2.9m decrease in 1H profits)
Margins Strong profit growth on Mainland China
Income Margin 11.3% 11.3% -
Adj. EBIT % Revenue 0.9% 2.4% (1.5%) Losses in India & Singapore in low fare
environment
Challenging market conditions in UAEImplementing
TARGETING ASIA flatter regional
management
Corporate Traveller
launched in key
structure in markets during 1H
Eastern Asia - to target SME
centralised customers –
functions, IT Singapore, Hong
solutions & Kong & UAE
1. Flatter reduced costs
2. Corporate
Structure Travel
Online Infinity Robotic ticketing
offering now in trial underway
place to service in Singapore,
Singapore, likely to be
Greater China & rolled out across
UAE businesses the region
3. 4.
Wholesale Recent
Productivity
Targeting new
acquisitions in
sectors through
key markets
introduction of
(India & China)
transactional
will enhance
websites in UAE
scale & deliver
& Singapore
springboard for
during 2H
future growth
5. Scale
6. Online
BenefitsFINANCIAL RESULTS
Segment relates to items that are not
Other
allocated to geographical segments
AUD 1H FY17 1H FY16 PCP change
1H FY16 TTV & revenue results include
$m $m %
the $11m ACCC refund
TTV 181 188 (4%)
External Revenue 130 140 (7%) Year-on-year EBIT swing brought about
by reduced earnings from touring
Adjusted EBIT (3) 4 (195%)
businesses ($9.6m) & $11m ACCC
Margins refund during 1HFY16
Income Margin 71.9% 74.5% (2.6%)
Adj. EBIT % Revenue (2.6%) 2.5% (5.1%) Group M&A expenses of $1.6m in 1H
FY17 ($0.3m is in Rest of World
segment)FINANCIAL RESULTS
1H FY17 Results by Country
Canada Europe India Greater China
TTV: $919m, down 16% TTV: $206m, up 1% TTV: $136m, up 2%
TTV: $586m, down 2% in in AUD (up 6% in lc) in AUD (up 8% in lc) in AUD (up 7% in lc)
AUD (up 3% in lc) AUD EBIT: $17.7m AUD EBIT: ($1.2m) AUD EBIT: ($0.4m)
AUD EBIT: ($1.0m) Sales teams: 300 Sales teams: 89 Sales teams: 42
Sales teams: 234
UAE
USA & Mexico
TTV: $42m, down 20% New Zealand
TTV: $1.3b, up 6% in in AUD (down 16% in lc) TTV: $511m, up 12%
AUD (up 11% in lc) AUD EBIT: $0.5m in AUD (up 7% in lc)
AUD EBIT: ($5.8m) Sales teams: 13 South East Asia AUD EBIT: $0.4m
Sales teams: 290
TTV: $96m, up 2% in Sales teams: 204
AUD (up 2% in lc)
AUD EBIT: ($1.3m)
Sales teams: 28
South Africa
TTV: $251m, up 2% Australia
in AUD (up 10% in lc)
AUD EBIT: $4.9m TTV: $5.1b, up 5%
Sales teams: 177 AUD EBIT: $98.2m
Sales teams: 1,554RECORD 1H CASH BALANCE
Ongoing Cash Generation
$449m
$450m
$400m
$350m 1H FY17
1H FY16
$300m 1H FY15
$250m 1H FY14 FLT’s general cash &
1H FY13
$200m investments portfolio
1H FY12
$150m
$125m has almost quadrupled
1H FY11
$100m
since 1H FY09
1H FY10
$50m
1H FY09
Cash &
Investments
(General)FINANCIAL RESULTS
Group cash flow
AUD 1H FY17 1H FY16 Operating cash outflow recorded in line
$m $m with FLT’s normal seasonality
Operating activities
Operating activities before interest and tax (83) (34) Cash accumulates during peak booking
Net interest and tax paid (63) (63)
periods (2H) & is paid to suppliers after
Cash flow from operating activities (147) (97)
peak travel seasons (following 1H)
Investing activities
Acquisitions (16) (44)
Timing of airline payment cycle (BSP)
Purchases of PPE and intangibles (66) (58)
Purchases of financial assets - (39) major driver of year-on-year shifts
Other investing cash flows 5 9
Cash flow from investing activities (76) (133) 2 acquisitions completed during 1H.
Financing activities
Net cash impacts of $10m for Ignite
Financing activities before dividends 17 (10) Travel Group & $6m for Europe
Dividends paid (93) (98) corporate businesses
Cash flow from financing activities (76) (108)
Increase/(decrease) in cash held (299) (338) FLT has taken advantage of an
FX impact (8) 1 arbitrage opportunity & invested
Cash and cash equivalents 1,008 1,042
borrowed funds in short-term deposits
Dec 16 Dec 15 FX adversely affecting cash position
General cash (excl. Investments) 347 430
Client cash 663 612
Bank overdraft (1) -
Total cash 1,008 1,042FINANCIAL RESULTS
Group balance sheet Movement in financial assets & other
current assets reflects changes made
AUD Dec 16 Dec 15
during FY16 (2H) – external investments &
$m $m
repurchase agreement
Cash & cash equivalents 1,010 1,042
Trade & other receivables 670 647 PPE & intangible increases driven by
Financial assets 197 104 network enhancements (cap-ex,
Other current assets 94 17 acquisitions & software)
Current assets 1,971 1,810
PPE 264 220 Tax receivable included other current
Intangibles 463 446 assets
Other non-current assets 96 67
Non-current assets 822 733 Ignite investment included in “Other” non
Total assets 2,793 2,543 current assets
Trade payables & other liabilities 1,239 1,161
Increased borrowings (repurchase
Borrowings 92 21
agreement)
Current liabilities 1,331 1,182
Trade payables & other liabilities 89 37 Movement in payables brought about by
Provisions 39 38 timing of airline payment cycle (BSP)
Non-current liabilities 128 75
Total liabilities 1,458 1,258 Some items reclassified between periods –
accounts for movements in “Trade & Other
Net assets 1,335 1,285
Payables” & “Other Current Liabilities”
General cash 347 430
General investments 102 - $347m in general cash + circa $100m in
Client cash 663 612 general investments (externally managed
Client investments 96 104
funds)
Total cash & investments 1,207 1,146
Positive net debt 357 409 $357m positive net debt at Dec 31FINANCIAL RESULTS First Half FY17 Results
Cap-ex $8m increase in 1H cap-ex
AUD 1H FY17 1H FY16 PCP change Reflects ongoing spend on:
$m $m %
PPE 53 47 11% Systems (including Microsoft
Intangibles (internal) 13 11 24% Dynamics finance platform)
Total capex 66 58 13%
Next generation shop design roll-
out & refurbs
Head office relocations (including
South Point)
Head office expenditure expected to
decrease significantly in 2H FY17
Intangibles increase linked to Dynamics
(roll-out in Canada & USA
FY17 spend likely to be circa $110mAgenda KEY HIGHLIGHTS Graham Turner (CEO) FINANCIAL RESULTS Adam Campbell (CFO) STRATEGIC UPDATE Melanie Waters-Ryan (COO) OUTLOOK Graham Turner (CEO) QUESTIONS
FLIGHT CENTRE TRAVEL GROUP

WHO ARE WE?

                         OUR CORE VALUES
   IRREVERENCE               EGALITARIANISM                  OWNERSHIP

   We take our business
                              Everyone has the same
      seriously but not                                   We take full responsibility
                             opportunities, rights and
 ourselves. We respect our                                and treat the business as
                             privileges. Self important
  customers, our partners                                         our own.
                               people don’t fit here.
       and each other.
FLIGHT CENTRE TRAVEL GROUP
OUR STRATEGIC ANCHORS
Make it easy to
buy from us Famous
and thus lead distinctive
Scalable growth
to sticky and brands with
deep customer expertise
relationshipsFLIGHT CENTRE TRAVEL GROUP
THE NEXT 20 YEARS
Leisure Travel
Retailing
In-Destination
Little Argas
Travel
(Acceleration)
Experiences
Corporate
Non-Travel
Travel
Student &
YouthLEISURE TRAVEL
Targeted Digital
growth along enhancements
the P2P Index & growth
Continued Improved
success of new Productivity
Expanding products
distribution models Search & Book
(Ignite acquisition,
developing a home- Apps, new
based model) & websites, new
increasing market- expertise, Book
share through IAP range
strong volume
with Me
expanded,
gains
Journeys & TTV per person
Escapes, increasing
interest-free
holidaysTRAVEL RETAILING… THE P2P INDEX
Dominating The Leisure
Travel Landscape
OTA Contact Centres Multi-Team Stores Community Home Based Events
• High volume, low • 24/7 telephone
• Travel Expos,
touch sales & assist. • Shopping centres
• Hyper stores Discover Europe,
• Model expanding
Discover America.
• Flightcentre, • Teams currently • CBD and strip globally
• Megastores • 36 events nationally
StudentUniverse, based in Brisbane & locations
per year in Australia
BYOJet, Aunt Betty. SydneyNEW PRODUCTS: EXPANDED CP RANGE
NEW PRODUCTS: INTEREST FREE
IN-DESTINATION TRAVEL EXPERIENCES

                                                        Buffalo Tours DMC (JV) performing
                                                        well – on track for almost $2m FY17
                                                        profit (in 2nd full year)
                     KEY
                                                        Now handling FLT’s customers in 11
                    AREAS                               countries

    Tour                                    Hotel       Developing new & unique product
  Operations                            Opportunities   offerings, now Top Deck’s ground
                                                        handler in Asia
                    Destination
                    Management                          Success prompting FLT to pursue
                     Companies                          further expansion internationally

                                                        Disappointing 1H results for touring
                                                        businesses (Top Deck and Back-
                                                        Roads) – FX impacts & over capacity
  Giving FLT greater control over the customer
  experience & creating products that can be            Strong forward bookings
  distributed via FLT’s global leisure travel network
SAM
CORPORATE TRAVEL deployed in
USA &
launched in
New tools & Europe this
Building a products to week
truly global strengthen
TMC leading tech
offering -
Europe Strong
acquisitions account wins
Continued FCM Connect,
expansion of proprietary
Corporate online booking
Traveller tool secured
(SME) brand with Europe Flagship
Rolled out in acquisition
globally clients
new regions
secured in
alongside
Market Australia &
FCM
leading globally
technology
transforming
the travel
experienceFCM’S LEADING TECH OFFERINGS
FCM’S LEADING TECH OFFERINGS
SAM :] – CAPTURING ATTENTION

                               Article reproduced
                               courtesy of TTG
FCM’S LEADING TECH OFFERINGS
STUDENT & YOUTH

                                              App bookings
                                              up 124% YoY
                            Student Flights
                              in Australia
           Aiming to
          become the
       global leader in a
          fragmented
             market          $186B
                             Global
        Developing strong
                             Market
          on and offline
             services

                            StudentUniverse
                            growing rapidly
NON-TRAVEL
Operating in sectors that are adjacent to travel or using the FLT business model
Travel Money
• Continued growth
• On track to become 4th brand to top $1b in TTV in Australia in FY17
Pedal Group
• 99 Bikes retail chain & wholesaler Advance Traders Australia
• Set to achieve almost $100m in sales during FY17
• 32 retail shops throughout Australia
Healthwise & Moneywise
• Health & financial services businesses working with internal & external clients
• Moneywise home loan consultants organised loans worth more than $100m during the 1H
First Class Education Group
• Delivering industry-recognised courses & qualifications to internal & external customers
• Evaluating international expansion opportunitiesLITTLE ARGAS (INVEST)
Partnered with
Named after first Travel Startups,
TopDeck bus Fishburners, Little
Tokyo and more
LITTLE
Working with
ARGAS
(www.littleargas.com)
external parties to
First strategic
identify
investments made;
opportunities -
Claire
sales & solving
business problems Mentoring talent
and connecting
with startupsENHANCED DIGITAL PRESENCE
Global chief digital
officer appointed
DIGITAL
Developed Investing in
Boston-based platforms and
centre of building network of
excellence for OTAs and digital
digital commerce services
Delivering rapid
growth in online
sales and mobile
app usageENHANCED DIGITAL PRESENCE
New transactional
websites (UAE &
StudentUniverse
South Africa) to
$1B launch during 2H
ONLINE
TTV
BYOjet (now in TARGET
flightcentre.com.au
four countries)
Aunt BettyENHANCED DIGITAL PRESENCE
StudentUniverse
seeing 124% YoY
growth in mobile
bookings
NATIVE
APPS
New apps deployed
for FC Australia and
FC USAAgenda KEY HIGHLIGHTS Graham Turner (CEO) FINANCIAL RESULTS Adam Campbell (CFO) STRATEGIC UPDATE Melanie Waters-Ryan (COO) OUTLOOK Graham Turner (CEO) QUESTIONS
FY17 GUIDANCE

                                         External factors that
                 1H profit guidance     impacted 1H results –
                     achieved            airfare pricing, FX –
                                             yet to abate

                   Now expecting
                underlying FY17 PBT
                                        Amended guidance -
                 towards bottom or
                                          $300m-$330m
                 below initial target
                                          underlying PBT
                       range
POSITIVE MOMENTUM BUT
SOME ONGOING UNCERTAINTY
POSITIVE
GUIDANCE X
LEAD
FACTORS
INDICATORS
US business
Strongest Further
likely to be
monthly significant
YTD
Australian airfare price
profitable by Increased
TTV growth deflation?
end of this exchange
in January
Record month rate volatility
Europe profit & possible
in January impacts on
result
transaction?2H GROWTH DRIVERS
TTV Growth Coach Touring
Greater
Stability & Continued
Positive Productivity
*Starting to track Momentum *$9.6m 1H profit
against a similar decline had a
low fare significant impact
environment. on 1H results –
*More rapid improvement
growth possible if expected during
current volumes *1H results 2H
are maintained affected by soft
July & Q1 trading.
*Good Q2 Cost Control
momentum
heading into 2H
Benefits starting to
flow from initiatives
introduced during
1HOTHER OPPORTUNITIES
NETWORK ONLINE SALES
M&A
EXPANSION GROWTH
Further acquisitions
Web businesses
likely within key
Cost effective & performing well
growth sectors
sensible growth plans
in place across P2P Progressing towards
Targeting corporate
network $1b online sales
& in-destination
target for FY17
opportunitiesIMPACT OF LCCs
Agreements in place with key players
• Proactively working with major LCCs in Australia
Full content online
• Scoot, Jetstar, Air Asia X & Tigerair fares & ancillary products now
available via flightcentre.com.au
Solid sales growth
• Increasing off a relatively small base
LCC market-share
• Has increased recently in Australia but Middle Eastern & Chinese carriers
growing more rapidlyOTHER CARRIERS TAKING OFF
20%
18%
16%
14%
12%
10% FY11
FY16
8%
6%
4%
2%
0%
LCC Market-share in Australia Gulf Carriers in Australia Chinese Carriers in AustraliaOUTLOOK – AIRFARE PRICING
Major falls during FY16 Driven by rapid capacity Seat numbers increasing
2H and throughout FY17 growth during FY16 at a faster rate than
1H calendar year international travel
Relatively stable in Jan
Average fares expected 17 but volatily expected
to be more comparable this month - deep
during FY17 2H discounting at Travel
ExposAgenda KEY HIGHLIGHTS Graham Turner (CEO) FINANCIAL RESULTS Adam Campbell (CFO) STRATEGIC UPDATE Melanie Waters-Ryan (COO) OUTLOOK Graham Turner (CEO) QUESTIONS
SUPPLEMENTARY INFO

   5-Year Growth Trajectory
   AUD                         December    December    December    December    December
                                   2016        2015        2014        2013        2012

   TTV                          $9,343m     $9,182m     $8,138m     $7,480m     $6,593m
   Income margin                  13.4%       13.7%       13.6%       14.1%       13.9%
   EBITDA                        $143.8m     $188.0m     $164.0m     $179.3m    $148.9m
   PBT                           $109.2m     $156.9m     $141.0m     $155.0m    $129.5m
   NPAT                          $74.4m     $116.7m     $100.3m     $110.8m      $91.8m

   EPS                             73.7c      115.7c       99.7c      110.3c       91.7c
   DPS                             45.0c       60.0c       55.0c       55.0c       46.0c
   ROE                             5.6%        9.1%        8.8%       10.3%       10.4%

   Capex (cash flow)              $65.7m      $58.2m      $39.5m      $28.2m     $28.4m
   Selling staff                  15,082      14,747      13,941      13,000      12,167

   General cash                  $346.9m     $429.8m     $429.4m     $401.9m    $319.5m
   Client cash                   $662.7m     $612.2m     $611.3m     $594.4m    $453.9m
   Cash and cash equivalents   $1,009.6m   $1,042.0m   $1,040.7m    $996.3m     $773.4m
   Investments                   $197.5m     $104.5m      $62.0m      $32.2m     $55.1m
   Cash and investments        $1,207.1m   $1,146.5m   $1,102.7m   $1,028.5m    $828.5m
BUSINESS UPDATE
Ignite Travel Group Develops & distributes innovative
leisure models including exclusive
holiday packages, travel vouchers &
rewards programs.
FY16 Strategic Rationale:
TTV $75m Access to unique product &
distribution methods
Staff 130
Procurement expertise
Business units 3 Enhance value proposition to
suppliers
Ownership 49%
Overseas expansion opportunities
Acquisition funded through cashBUSINESS UPDATE
Europe corporate acquisition Small & profitable corporate businesses
formerly owned by European online
travel agency eDreams ODIGEO
FY17 Strategic Rationale:
Expansion into 5 key countries
TTV €110m
(annualised) Strengthens FLT’s European
operations
Continued growth of FLT’s
Staff 93 corporate business
Geography Sweden Access to proprietary online
booking tool (OBT)
Denmark
Norway Fast-tracks growth on Continental
Finland Europe
Germany Acquisition funded through cashDisclaimer This presentation has been prepared by Flight Centre Travel Group Limited ABN 25 003 377 188 (FCTG). This presentation contains general background information about FCTG and its subsidiaries and their activities current as at 23 February, unless otherwise stated. This presentation does not purport to contain all of the information which may be required to evaluate FCTG. This presentation should be read in conjunction with FCTG’s other periodic and continuous disclosure announcements lodged with the Australian Securities Exchange, which are available at www.asx.com.au. This presentation is not financial product or investment advice or a recommendation to acquire FCTG shares and has been prepared without taking into account the objectives, financial situation or needs of individuals. Individuals should obtain their own independent professional advice about FCTG and this presentation. This presentation is not, and should not be considered as an invitation to acquire FCTG shares. Forward looking statements (i.e. statements about matters that are not historical facts), opinions and estimates provided in this presentation are based on information and assumptions known to date which are subject to various risks and uncertainties. Forward looking statements including projections, guidance on future earnings and estimates are provided as a general rule only and should not be relied upon as an indication or guarantee of future performance. Actual results may differ materially from those which FCTG expects and may be affected by matters which are beyond FCTG’s control. FCTG will not be required to update any forward looking statement contained in this presentation as a result of new information or events which may occur after the date of this presentation. Past performance information contained in this presentation is provided for illustrative purposes only and should not be relied upon as an indication of future performance. FCTG does not make any representation or warranty, express or implied, as to the accuracy, completeness or correctness of the information, opinions and conclusions contained in this presentation including any likelihood of achievement or reasonableness of any forecasts, prospects or returns. To the maximum extent permitted by law, none of FCTG, its directors, employees, agents or any other person accepts any liability (including liability arising from fault or negligence) for any loss or damage arising from or in connection with use of any information contained in this presentation. This presentation is unaudited. FCTG uses certain measures to manage and report on its business. These measures are referred to as non-IFRS financial information. FCTG considers that this non-IFRS financial information is important to assist in evaluating FCTG’s performance. The information is presented to assist in making appropriate comparisons with current periods and to assess the operating performance of the business. All amounts are in Australian dollars unless otherwise stated.
You can also read