Investor & Analyst Conference - Frankfurt/Main March 14, 2018 - SGL Carbon
←
→
Page content transcription
If your browser does not render page correctly, please read the page content below
Investor & Analyst Conference

Frankfurt/Main
March 14, 2018

Page 1
Agenda.

  1. Review of the fiscal year 2017 – Dr. Jürgen Köhler

  2. Financials 2017

  3. Outlook 2018

  4. Market and business developments

   5. New mid-term guidance

Page 2
Review of the fiscal year 2017. Strategic realignment
completed – growth strategy yielding results
Reshaping and deleveraging completed
▪ We completed the sale of the Business Unit PP in the fourth quarter – preliminary cash
  proceeds of €461 million significantly reduced our net debt
▪ We have prematurely redeemed our €250 million corporate bond as of October 30, 2017
▪ We have implemented all measures within the framework of Project CORE and already
  achieved more than 75% of the anticipated year end 2018 savings
▪ We achieved a triple digit net profit resulting from the successful disposal of CFL/CE
▪ We achieved all our balance sheet targets

Growth strategy executed
▪ We have streamlined our joint venture structures and taken full control of the carbon
  fiber value chain by acquiring the full ownership in former JVs with BMW and Benteler
▪ We have implemented our growth strategy and generated double digit organic revenue
  growth in the business units

Page 3
Agenda.

  1. Review of the fiscal year 2017

  2. Financials 2017 – Dr. Michael Majerus

  3. Outlook 2018

  4. Market and business developments

   5. New mid-term guidance

Page 4
Composites - Fibers & Materials. Moderate growth
and slightly more than proportional EBIT improvement
in € million 2017 2016
Sales revenue 331.9 317.4
EBITDA before non-recurring items* 44.2 41.3
EBIT before non-recurring items* 22.7 20.1
EBIT-Margin before non-recurring items* (in %) 6.8 6.3
ROCEEBITDA (in %) 11.3 10.9
▪ Sales revenue increased by 5% (currency adjusted by 6%) due to
Higher revenues with market segments industrial applications, automotive and textile fibers
Lower sales with wind energy industry due to reduced business volumes of our customers in Germany
Lower sales also with aerospace industry, however prior year boosted by a one-time order from the US defense industry
▪ Recurring EBIT improvement by 13% due to
Higher capacity utilization in our Scottish carbon fiber facility based on higher demand from market segment industrial applications
Improved earnings in market segment automotive mainly due to better results in SGL Composites (former joint venture with Benteler)
Better earnings also in aerospace market segment despite lower sales revenues
Lower earnings contribution from market segment textile fibers due to higher raw material and energy costs
Wind energy earnings contribution also below prior year level as a result of difficult customer market conditions
Page 5 * Non-recurring items include reversal of impairment of €0.4 million in 2017 (2016: €12.8m) and restructuring charges of minus €1.1 million in 2016Composites – Fibers & Materials.
Market segmentation
Market
Segment
Sales Automotive Aerospace Wind Industrial Textile Fibers
Energy Applications
2017 30 % 6% 12 % 23 % 29 %
2016 29 % 7% 15 % 21 % 28 %
Page 6Graphite Materials & Systems. Strong growth and
substantially more than proportionate EBIT improvement
in € million 2017 2016
Sales revenue 510.2 444.1
EBITDA before non-recurring charges* 70.8 49.8
EBIT before non-recurring charges* 47.8 27.8
EBIT-Margin before non-recurring charges* (in %) 9.4 6.3
ROCEEBITDA (in %) 18.0 12.7
▪ Sales revenue increased 15% (currency adjusted plus 17%)
Strong double digit growth in market segments battery & other energy, industrial applications, semiconductor, LED, automotive &
transport
Business with the lithium ion battery industry increased 35%
Single digit growth in market segments solar and chemicals despite weakness in chemical end markets in first half 2017
▪ Recurring EBIT improved substantially more than proportionately by 72% primarily due to
Strong earnings increases in market segments battery & other energy as well as industrial applications
All other segments showed stable to slightly improved earnings
Page 7 * Non-recurring effects of €2.3 million in 2017 and minus €1.6 million in 2016Graphite Materials & Systems.
Market segmentation
Market
Segment
Sales Battery & Solar LED Semi- Automotive Chemical Industrial
other Energy conductor & Transport Applications
2017 19 % 10 % 3% 6% 7% 24 % 31 %
2016 16 % 11 % 2% 5% 7% 27 % 32 %
Page 8Corporate.
Like-for-like stable development as anticipated
in € million 2017 2016
Sales revenue 18.0 8.3
EBITDA before non-recurring charges* -24.3 -21.2
EBIT before non-recurring charges* -30.4 -27.2
▪ Lower recurring EBIT due to
Positive one-off effect of approx. €4 million from land sale in Malaysia in prior year
Like-for-like stable development as expected
Page 9 *Non-recurring effects of €6.2 million in 2017 and minus €7.1 million in 2016Group. Improved operating profit and disposal proceeds
partially offset by still high interest expense
in € million 2017 2016
Sales revenue 860.1 769.8
EBITDA before non-recurring items 90.7 69.9
EBIT before non-recurring items 40.1 20.7
Non-recurring items (reversal of impairment and restructuring ) 8.9 3.0
EBIT 49.0 23.7
Net financing result -56.8 -50.9
Results from continuing operations before income taxes -7.8 -27.2
Income tax expense and non controlling interests -8.4 -8.8
Net result – continuing operations* -16.2 -36.0
Discontinued operations 155.1 -75.7
Consolidated net result attributable to the shareholders of the parent
138.9 -111.7
company
▪ Group sales revenue up 12%, recurring Group EBIT nearly doubled
▪ Net financing result burdened by one-time charges of net approx. €8 million relating to early redemption of
corporate bond (accelerated amortization of capitalized refinancing costs and early repayment penalty)
▪ Positive net result due to book profit on the sale of CFL/CE (recorded in discontinued operations)
Page 10Free cash flow. Positively impacted by proceeds from the sale of former business unit PP Continued operations in € million 2017 2016 Cash flow from operating activities -82.3 -16.2 Capital expenditures in property, plant and equipment and intangible assets -52.9 -34.6 Cash used in other investing activities* -9.5 2.7 Free cash flow – continued operations -144.7 -48.1 Free cash flow – discontinued operations 458.7 -32.9 Total free cash flow 314.0 -81.0 ▪ Capex higher and at level of depreciation as expected – reflecting increasing number of executed growth projects particularly relating to the lithium-ion battery end market in the business unit GMS ▪ In addition, free cash flow from operating activities (continued operations) impacted mainly by higher working capital and cash outflow for the acquisition of the outstanding 50% of the JV with Benteler ▪ Free cash flow from discontinued operations amounted to plus €458.7 million and related mainly to the proceeds from the sale of GE and CFL/CE (compared to minus €32.9 million in 2016) ▪ Total free cash flow of €314.0 million (after minus €81.0 million in prior year) used for net debt reduction *Dividends received and/or payments made for capital contributions in investments accounted for At-Equity and other financial assets, proceeds from sale of intangible assets and property, plant and equipment, as well as payments for the acquisition of subsidiaries Page 11
Balance sheet.
All balance sheet targets have been reached

 in € million                                                                                                   31.12.2017                   31.12.2016
  Total assets                                                                                                      1,541.7                      1,899.2
  Equity ratio (in %)                                                                                                   29.6                         17.5
  Total liquidity*                                                                                                    382.9                        333.0
  Net financial debt                                                                                                  139.0                        449.4
  Gearing (net debt/equity)                                                                                             0.30                         1.35
  Leverage ratio (net debt/EBITDA)                                                                                        1.5                          6.4

▪ All balance sheet metrics have improved due to the proceeds from the sale of the former business unit PP as well as
  the early redemption of the €250 million corporate bond
▪ All balance sheet targets have been reached
▪ Further improvement in equity ratio in Q1/2018 as we repaid the €240 million convertible bond at maturity in
  January 2018 from cash on hand reducing total assets; gearing and leverage ratio will slightly deteriorate due to full
  consolidation of SGL ACF but remain within our targets

                                      *including liquidity of assets held for sale of €3.6 million as of December 31, 2017 and € 3.5 million as of December 31, 2016
Page 12
Agenda. 1. Review of the fiscal year 2017 2. Financials 2017 3. Outlook 2018 – Dr. Michael Majerus 4. Market and business developments 5. New mid-term guidance Page 13
Business Unit outlook 2018.
Composites – Fibers & Materials (CFM)
▪ Substantial increase in sales by 25%
Mainly driven by acquisition of former joint ventures with BMW and Benteler
Accordingly sales in market segment automotive to more than double, while sales with the wind energy industry
should decline by approximately 25% due to the sale of SGL Kümpers
Sales to market segments aerospace, industrial applications and textile fibers expected on prior year level
Like-for-like (i.e. excluding currency and M&A effects) mid-to-high single digit growth rate expected
▪ EBIT* to also improve substantially due to
Full consolidation of former joint venture with BMW
Higher volumes partially offset by negative currency effects and higher development expenses
Page 14 *before purchase price allocation and non-recurring itemsBusiness Unit outlook 2018. (cont.)
Graphite Materials & Systems (GMS)
▪ Slight increase in sales – corresponding to currency adjusted mid-to-high single digit sales growth
Driven by market segments LED, solar as well as automotive & transport
Semiconductor, chemicals and industrial applications expected on prior year level
Strong volume increase in market segment battery and other energy, offset by price adjustments
▪ Slight EBIT* improvement: higher capacity utilization partially offset by adverse currency effects
▪ High ROCEEBITDA of 18% in 2017 should be achievable again in this business unit
Corporate
▪ Slightly higher expenses due to
Lower cost allocations to buyers of former PP business unit
Higher consulting fees (OMS, new data protection directive)
Page 15 *before non-recurring itemsGroup outlook 2018.
Further improvement in the profit and loss statement
▪ Full year Group sales to increase by approximately 10%, corresponding to a like-for-like (ie.
excluding currency and M&A effects) mid-to-high single digit growth rate
▪ Group recurring EBIT* to increase at a slightly faster pace than sales due to expected volume
increases, the additional earnings contribution from the full consolidation of the former joint
venture with BMW as well as cost savings, partially offset by adverse effects from currency, raw
material and personnel cost developments
▪ Net result – continued operations expected to improve and reach a “black zero” due to
Improved operating profit
Lower interest expenses due to early redemption of corporate bond in October 2017 and repayment of
convertible bond at maturity in January 2018 – partially offset by higher interest expenses relating to full
consolidation of former JV with BMW
*before purchase price allocation and non-recurring items
Page 16Group outlook 2018. Capex/acquisitions drive higher
net debt but all balance sheet targets remain intact
▪ Capex to increase compared to prior year to 15-25 million € above level of depreciation
Level of depreciation increases to €65 million due to full consolidation of former joint ventures
Broad guidance range reflects flexibility in timing of individual investment projects
Mid term guidance of capex at depreciation levels remains valid but capex requirements are front end loaded
▪ Total free cash flow to reach a “black zero”
Free cash flow - continued operations to improve significantly but remain negative in low-to-mid double digit
range mainly due to high capex level and cash outflow for the acquisition of the Wackersdorf site in the former
joint venture with BMW
Free cash flow - discontinued operations to reach positive low-to-mid double digit range due to payment of final
instalments of purchase price for disposal of GE and CFL/CE
▪ Net debt at end 2018 to substantially increase due to the full consolidation of former joint venture
with BMW however
▪ Balance sheet targets - equity ratio at or above 30%, gearing at or below 0.5 and leverage ratio at
or below 2.5 – will continue to be met
*before non-recurring items
Page 17Agenda. 1. Review of the fiscal year 2017 2. Financials 2017 3. Outlook 2018 4. Market and business developments – Dr. Jürgen Köhler 5. New mid-term guidance Page 18
Automotive. CO2 targets drive lightweight construction

OEM fleet target development (EU)                       Relative component weight*
[in g CO2/km]                                           [in %]

                       -20%
                                                                     -5 to -25%
                   ~               -15%          -30%            ~
                                                                                  -40%

                                                                                         -15%         -20%
           119                                           100
                                                                                                                   -60%
                       95
                                   ≤ 81
                                                 ≤ 67

          2016         2021        2025          2030    Steel      .
                                                                 Light     ..
                                                                        Aluminum   ...
                                                                                  Mag-      .
                                                                                          CFRP      . uni-
                                                                                                  CFRP
          actual              Expected targets                   weight          nesium quasi- directional
                                                                  steel                 isotropic

                                                                                                   *With same functionality
Page 19
                                                                                                Source: ICCT, SGL estimates
Automotive.
Driving growth in CFM…
▪ Completion of the FRP* value chain by acquiring and integrating former JVs with Benteler and
BMW will allow to better address the increasing number of new requests from both OEM and Tier1
in the market
▪ Growth in components driven by
New applications (e.g. leaf spring)
New technologies (e.g. thermoplastics)
Existing products/markets (e.g. wet friction)
▪ Clear trend evolving toward multi material mix and FRP* usage for local reinforcement
▪ Globalization and ramp-up in America and Asia
▪ E-Mobility as a key driver for new lightweight structural FRP* concepts also driven by new OEM
entrants
*Fiber reinforced plastic
Page 20Automotive.
...as well as in GMS
▪ E-mobility supports growth with graphite parts: higher demand for brake assistant pumps and
water pumps
Brake assistant pumps: create missing vacuum (electric vehicles)
Water Pumps: cooling remains key topic in all vehicles (e.g. Tesla S has 4 secondary water pumps)
▪ Entry into Chinese market via existing and new customers, supply to some key projects opens up
additional opportunities
▪ Due to increased demand for automotive solutions and components based on specialty graphite,
we are investing approx. 25 million euros until 2020 to increase capacity at the Bonn site
▪ We have recently received a major order from “Rheinmetall Automotive – Pierburg”, where we will
supply brake assistant pumps. The annual order volume is in the low double-digit million euros
range
Page 21Page 22
Aerospace.
Market growth and focus on operating cost efficiency

  ▪       Airline industry extremely competitive, constant battle over cost reduction => composites
          address this key customer requirement as lightweight construction reduces fuel consumption
  ▪       Strong commercial aircraft CFRP market growth (CAGR > 8%) driven by aircraft programs (e.g.
          A350, B787, B777X)
  ▪       Besides Boeing and Airbus in the field of commercial aircraft other aerospace markets are
          accelerating – launcher, UAV, etc.

Page 23
Aerospace. CFM growth based on proven
competence in automated serial manufacturing
▪ Limitations in today’s aerospace composites manufacturing prevented further penetration beyond
Boeing 787 and Airbus 380 and 350
Low annual production volume allow labor intensive production processes
Composites for aerospace are by far the most expensive. Average markup (ratio of end-user/raw material cost)
is nearly 6.5, and thus far ahead of the next sector, consumer goods (ratio of 2.9)*
▪ Aerospace industry likely to further increase composites penetration rate between 2016-2021*
Requirement: higher use of automation to produce composite parts at lower manufacturing costs and
increased production volumes
▪ We are ideally positioned to address exactly these issues based on our carbon fiber and
composites competence acquired while working for the automotive industry
Integrated value chain from precursor to components
Materials (e.g. fabrics) for secondary structures, and interior applications
New aerospace projects for materials and aircraft components
Source: JEC
Page 24Wind energy. Redefine CFM market approach to better
exploit opportunities
▪ Current market conditions challenging
Stagnating global installed wind turbine growth
German-centric customer base more than proportionally affected (new tendering procedures)
OEMs and suppliers are under high cost pressure and qualify further suppliers
▪ Temporarily lower sales share due to sale of SGL Kümpers
▪ Changing technologies (prepreg vs. fabrics vs. pultrusion) require adjustment of market
approach
▪ Several OEMs design new blades for large off-and on-shore wind turbines based on new
technologies
▪ Beyond wind energy: additional opportunities identified in oil & gas industry (e.g. pipes, risers,
liquid gas tanks, and others)
Page 25Battery & other energy. The whole value chain
continues to invest into lithium-ion battery technology
Cell Material Cell/Battery Automotive OEMs
Producers Producers
Multiplying of New capacities > 200 new xEV
capacities initiated announced >500 models announced
GWh/a until 2030 until 2025
Page 26Battery & other energy. Accelerated growth drives
our graphite anode material business
▪ All prior growth estimates will be
exceeded – e-mobility as key driver
▪ Graphite Anode Material (GAM)
demand approx. 1kg per 1 kWh
▪ Our strong market share positions us
well to participate in anticipated
strong growth
▪ Lithium-ion continues to remain the
dominant battery technology well
beyond 2025, due to
Established technology and capacities
Cost/kWh will halve until 2025
Page 27Solar.
Growth continues, driven by and depending on China
PV module installations [GWp/a] Solar growth continues
▪ China, India and USA are main drivers
EPIA historical data1) 160 ▪ Levelized costs of PV energy continues to fall
PV Tech 2)
140 ▪ Crystalline silicon remains dominant PV technology
ITRPV 2017 3) 115 but shift towards mono due to higher efficiency
100+
77
90 Positive impact on GMS
▪ Technology shift from multi/crystalline to
51
40 mono/crystalline favoring our graphite product
portfolio
▪ Opportunities for price increases and long-term
2014 2016 2018 2020 partnerships with industry players
CAGR 2010 -’15 CAGR 2016 -’21 ▪ Promotion of full graphite portfolio (differentiating
24% 16% factor)
1) EU PV Industry Assoc., “Global Market Outlook 2017-2021”; 2) PV Tech article Aug. 16, 2017 and IHS Markit Aug. 24, 2017; 3) ITRPV (International Technology Roadmap for PV,
Mar. 15, 2017 ) “Low scenario” figures are in line with IEA expectations (IEA, Energy Technology Perspective, June 2016);
Page 28Semiconductors.
Stable long-term growth
Semi sees stable and long-term growth
▪ 5% CAGR expected 2017-2022*
▪ Memory (computing, mobile phones) drives 12’’
▪ Automotive (semi-autonomous and autonomous driving) and industrial (“Industry 4.0”) drives 8’’
▪ After strong 2017, we expect 8’’ and 12’’ wafers in short supply in 2018
▪ Artificial Intelligence a sustainable growth driver
▪ Long-term growth particularly in China
Positive impact on GMS’ graphite products
▪ Potential for price increases
▪ Gain qualification at new accounts
▪ Maintain/intensify cooperation with Chinese players (>40 new semi fabs to be built in the next
years)
*Source: SEMI Industry Strategy Symposium, Gartner, IHS Markit
Page 29LED.
Major contributor to GMS‘ growth expectations
▪ LED growth driven by
7.9%: automotive* CAGR 2016-2022 (increasing LED use on vehicle exteriors, headlamps, daytime running
lights, rear lighting, turning lights, and interior vehicle illumination for both cars and heavy vehicles)
8.5%: signage* CAGR 2016-2022 (trend towards finer pitch displays, large full color displays, road signs,
traffic lights, and building lettering)
6.1%: general lighting*CAGR 2016-2022
▪ Expansion of LED fabs leading to a sellout situation in SiC coated graphite
▪ Settlement of patent litigation will accelerate our growth 2018ff
▪ This strong growth drives demand for our graphite susceptors and wafer carriers. Consequently
we are beginning with the second expansion stage in our St. Marys (Pennsylvania, USA) coating
facility
First expansion stage started in 2017 to be completed mid 2018
Second expansion stage to be completed in fourth quarter 2018
Total capex €25 million over 3 years
*Source: IHS Markit
Page 30Chemicals.
Chemical industry expected to stabilize
Chemical production forecast Chemical industry improving profitability
[change 2018 vs. 2017 in %] ▪ Consolidation (e.g. Dow/DuPont)
▪ US petrochemical industry recovering from low base
World 3,5 ▪ Shale gas recovery expected
USA 3,0 We expect our business to benefit from this
Brazil 1,5 improvement
EU 2,0 ▪ Recent contract win in China for HCl recovery
China 6,0 ▪ Postponements of projects/system maintenance of
India 4,5 recent years now have to be executed
South Korea 2,5 ▪ Maintenance capex in EMEA and US to drive sealing
Japan
business
2,0
Source: Industry Top Trends 2017 – Oil & Gas, EIA: www.eia.gov/todayinenergy, PWC 2017 Chemicals Industry Trends, Chemie Technik June 2017; VCI Business Worldwide Sep. 2017
Page 31Industrial Applications. Favorable economic backdrop
for continued improvement in high-tech applications
▪ Economic forecasts (IMF, PMI, etc.) predict ongoing, if not improving favorable general industrial
environment
▪ CFM:
Industrial applications important end market to bridge automotive and aerospace development time
New applications/ industries: Prepregs, CFRP, grids, thermoplastics for machinery, medical, marine, ballistic
High growth in carbon fiber, esp. for injection molding parts
New application possibilities for the use of carbon in civil engineering projects
▪ GMS:
US market for industrial applications with cautious improvement driven by increased drilling activities
New applications under development, for example glass bending and optical fiber enabled by graphite
solutions
Page 32Agenda. 1. Review of the fiscal year 2017 2. Financials 2017 3. Outlook 2018 4. Market and business developments 5. New mid-term guidance – Dr. Jürgen Köhler Page 33
Targets for 2020 remain valid.
We introduce ROCEEBIT as key performance indicator

  1200

 1000
                                                                                                                     Drivers for ROCE
                                                                                        ~ €1.1 billion               improvement:
   800                                                                                     sales*                    ▪ Top line growth (benefiting
                                                                                                                       from megatrends) leading to
   600                          Moderate organic                                           ≥15%                        higher capacity utilization
          €737 million      sales growth and process             Accelerated organic
                                                                    growth phase         ROCEEBITDA
   400
             sales             optimization phase
                                                                                                                     ▪ Increasing share of
                                                                                             ~9%                       innovative products bearing
             8%
   200                       Augmented by potential selective and accretive                ROCEEBIT                    higher margins
          ROCEEBITDA         bolt on acquisitions to complement our portfolio
                                    in terms of region, technology, etc.                                             ▪ Efficiency improvement
      0
             2014                                                                              2020
                                                                                                                       programs driving down
            2014                                                                             2020                      costs
                          ≥Min. 15% ROCEEBITDA = ~ 9% ROCEEBIT
                  based on annual depreciation and amortization levels of
                 €65-70 million following the full consolidation of SGL ACF

                                                                                       *like-for-like comparison, i.e. before changes in joint venture structures
Page 34
We introduce a new mid term guidance. Market trends
and business positioning drive accelerated growth
1400 Group Additional 2022 targets:
Net profit margin ~6-7%
1200
Free cash flow margin ~5%
1000 Group ~ €1.3 billion
sales Over the entire guidance
800
€860 million ≥11% ROCEEBIT period:
600 sales
Equity ratio ≥30%
400 4.6% ROCEEBIT ≥10% ROSEBIT
Leverage ratio ≤2.5
4.7% ROSEBIT
200 Gearing ≤0.5
0
2017 2022
2014 2020
We also introduce margin targets for the business units:
≥12% ROSEBIT until 2022
Page 35Thank you for your attention! Page 36
Backup

Page 37
Group Market Segmentation. Reflects stronger
orientation to customer and growth markets

   Market
  Segment

  Sales           Mobility1                 Energy2               Digitization3                  Industrial                   Chemical                 Textile
                                                                                                Applications                                           Fibers
  2017                 19 %                  22 %                        5%                           29 %                       14 %                   11 %
  2016                 20 %                  22 %                        4%                           27 %                       15 %                   12 %

          1comprises   automotive, aerospace, and transport markets; 2comprises battery, solar, wind, and other energy markets; 3comprises LED and semiconductor markets
Page 38
Carbon and Graphite.
Positioned along the entire value chain
Customers
Control over the entire value
chain enables product
customization to customer
requirements
Acrylonitrile, Acrylic fibers, oxidized Preforms, prepregs, Composite
CFM
Polyacrylonitrile (PAN) fibers, carbon fibers multiaxial fabrics, components, carbon
braidings, textile ceramic brake discs,
products leaf springs
Customers receive tailor made
Intermediate Semi finished Solutions/
Raw materials solutions from every step of the
stages products components
value chain
Cokes, pitches, natural Synthetic fine grain Machining, finishing, Heaters, anode materials
GMS
graphites graphite blocks, expanded
natural graphite
coatings (e. g. SiC),
assembly
for lithium-ion batteries,
sealings, felts, process
Forward integration in finishing
equipment and solutions technologies (GMS)
and CFRP-components (CFM)
including application know how are
essential for differentiation
Customers
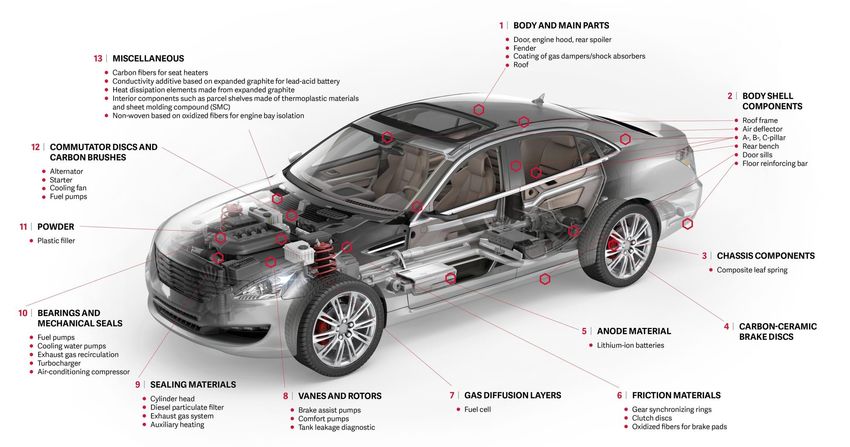
Page 39CFM. Capabilities tailored to serve market needs Page 40
GMS. Yet unsolved challenges for series application
of Solid State will allow LiB to thrive for many years

          Solid State Technical Challenges           Solid State Business Challenges
▪ Metallic lithium presents safety issue.      ▪ Supply chain does not exist yet
  Highly reactive and self-igniting
                                               ▪ Re-investment in cell production plants
▪ Dendritic crystal growth also causes           necessary, as new processes and
  safety issues (short circuiting)               equipment will be needed
▪ Cycle stability of cells unproven            ▪ Will need to compete with very
▪ No fast charging possible, which is key to     competitive LiB technology: Cost
  consumer acceptance                            optimized supply chain for LiB, highly
                                                 efficient production processes, global
▪ Technology currently available only on
                                                 economies of scale
  micro scale

Page 41
GMS. Further improvement potential supports positive
LiB technology outlook
Current LiB technology still has large improvement potential and is not fully optimized yet
▪ Capacity & power limits have not been reached
▪ Silicon additives to anode materials will allow capacity improvements
▪ Raw material cost optimization will create increasingly competitive cost/performance profile
▪ Further optimization of supply chain
▪ Further improvement of quick-charging capabilities
Long automotive cycles will ensure product survival and prevent quick substitution
Battery replacement market is an additional potential to extend LiB lifecycle and increase sales
Page 42Important note: This presentation contains forward looking statements based on the information currently available to us and on our current projections and assumptions. By nature, forward looking statements are associated with known and unknown risks and uncertainties, as a consequence of which actual developments and results can deviate significantly from the assessment published in this presentation. Forward looking statements are not to be understood as guarantees. Rather, future developments and results depend on a number of factors; they entail various risks and unanticipated circumstances and are based on assumptions which may prove to be inaccurate. These risks and uncertainties include, for example, unforeseeable changes in political, economic, legal and business conditions, particularly relating to our main customer industries, such as electric steel production, to the competitive environment, to interest rate and exchange rate fluctuations, to technological developments, and to other risks and unanticipated circumstances. Other risks that may arise in our opinion include price developments, unexpected developments associated with acquisitions and subsidiaries, and unforeseen risks associated with ongoing cost savings programs. SGL Group assumes no responsibility in this regard and does not intend to adjust or otherwise update these forward looking statements. © Copyright SGL CARBON SE ®Registered trademarks of SGL CARBON SE Page 43
You can also read