CAPITAL MARKETS DAY 25/06/2019 - Investor Relations ...
←
→
Page content transcription
If your browser does not render page correctly, please read the page content below

CAPITAL MARKETS DAY 25/06/2019

LEGAL DISCLAIMER & CONTACTS
The document has been prepared by Europcar Mobility Group (the “Company”). Recipients should conduct and will be solely responsible for their own investigations and analysis
of the Company. This presentation does not contain or constitute an offer of securities for sale or an invitation to invest in securities in France, the United States or any other
jurisdiction.
None of the Company nor its respective employees or officers, makes any representation or warranty, express or implied, as to the accuracy, relevance and/or completeness of
the document or any information, forward-looking statements contained herein and the Company shall not incur any liability for the information contained in, or any omissions
from, the document.
Forward-looking statements are statements that are not historical facts. These statements may include projections and estimates and their underlying assumptions, statements
regarding plans, objectives, intentions and expectations with respect to future financial results, events, operations, services, product development and potential, and statements
regarding future performance or events. Forward looking statements are generally identified by the words "expects", "anticipates", "believes", "intends", "estimates", "plans",
“projects”, “may”, “would” “should” and similar expressions. Forward-looking statements are based on the Company management's current expectations or beliefs on or about the
date of the document but are not guarantees of future performance and are subject to inherent risks, uncertainties (including without limitation, risks identified in the "Risk factors"
section of the Annual Registration Document filed with the Autorité des marchés financiers and also available on the Company's website: www.europcar-group.com) and
assumptions about Europcar Mobility Group and its subsidiaries and investments, trends in their business, future capital expenditures and acquisitions, developments in respect
of contingent liabilities, changes in economic conditions globally or in Europcar Mobility Group’s principal markets, competitive conditions in the market and regulatory factors.
Those events are uncertain; their outcome may differ from current expectations which may in turn materially affect expected results. Actual results may differ materially from those
projected or implied in these forward-looking statements. Other than as required by applicable law, the Company does not undertake to revise or update any forward-looking
statements in light of new information or future events.

    INVESTOR RELATIONS
    Olivier Gernandt             +33.1.80.20.91.81                         olivier.gernandt@europcar.com
    Investor Relations           +33.1.80.20.92.65                         investor.relations@europcar.com
    For all financial or business information, please refer to our IR website at: https://investors.europcar-group.com/

    MEDIA RELATIONS
    Valérie Sauteret                                                                                         valerie.sauteret@europcar.com

2
WITH YOU TODAY

    Caroline Parot   Fabrizio Ruggiero        Olivier Baldassari       Albéric Chopelin         Luc Péligry
         CEO             Deputy CEO           Group Chief Countries    Group Chief Commercial    Group Chief
                     Head of Business Units   and Operations Officer    and Customer Officer    Finance Officer

                               Management board

3
WITH YOU TODAY: “MOBILITY TALKS” SPEAKERS

          Xavier Corouge               Alexandre Crosby     Luc Péligry       Darragh Genockey
            Managing Director,             Group Chief       Group Chief        Business Leader
            Urban Mobility BU             Product Officer   Finance Officer      Vehicle Sharing
               (former Group                                                    Urban Mobility BU
        Digital & Marketing officer)

4
CAPITAL MARKETS DAY
25/06/2019
MOBILITY IS
    - AND HAS
    ALWAYS BEEN -
    A FUNDAMENTAL
    NEED FOR PEOPLE
    AND SOCIETIES

6
MOBILITY IS AT A
                                                                              PIVOTAL POINT TODAY:

                                                                              MORE PEOPLE,
                                                                              MORE VEHICLES,
                                                                              MORE CONGESTION,
                                                                              MORE CO2 EMISSIONS.

As congestion in cities rises, existing transportation — from cars to buses to trains — can no longer keep up with the growing population.
    Americans have lost an average of 97 hours a year due to congestion, according to the 2018 INRIX National Traffic Scorecard.
                               In 2018, it cost Americans roughly $87bn, or an average of $1,348 per driver.

7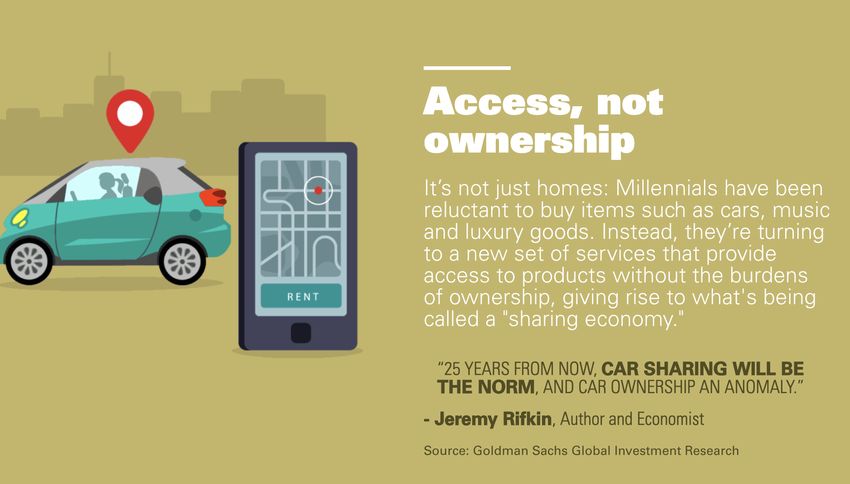
WE ARE AT THE BEGINNING
          OF A SOCIETAL REVOLUTION

          MOBILITY SOLUTIONS
    WILL PLAY AN ESSENTIAL PART IN IT

       IT IS NOW CRITICAL TO RECONCILE
    THE FUNDAMENTAL NEED THAT MOVING IS,
              WITH WHAT IS AT STAKE
8
WE BELIEVE
    MOBILITY
    IS ALL ABOUT
    ATTRACTIVE,
    ALTERNATIVE
    SOLUTIONS
    TO CAR OWNERSHIP,
    IN A RESPONSIBLE
    AND SUSTAINABLE WAY

9
GOOD NEWS #1
     SHARED MOBILITY IS AT THE CORE OF OUR DNA
               (AND HAS BEEN SINCE 1949)

                    1949

10
MISSION
Be the preferred
“mobility service company”
VISION by offering alternative
PURPOSE
The future needs global attractive solutions
is to deliver an experience of
mobility providers, to vehicle ownership. open mobility for all, lifting all
making people’s life easier. barriers, giving individuals as well
as groups of people easy access
to this great new world of mobility
We will play a leading solutions, whenever and wherever
they want, whatever the ride.
role in the mobility Accessibility is key: mobility
new ecosystem. should be inclusive,
not excluding.
11GOOD NEWS #2
MEGATRENDS ARE VERY PROMISING:
OUR GROUP IS IN A GROWTH STORY
12WITH WORLDWIDE LEISURE FLOWS
GLOBALIZATION,
MORE AND MORE
PEOPLE ARE
EUROPE
MOVING MORE
FREQUENTLY
FROM A TO B, +
FOR BUSINESS
OR LEISURE
PURPOSES
13MEGACITIES POPULATION DENSITY WILL AVERAGE 2.000/KM2 IN 2030,
AND THE DISTANCES TRAVELLED FROM A TO B WILL SKYROCKET.
THERE WILL BE A MASSIVE NEED OF MULTIMODAL URBAN MOBILITY SOLUTIONS.
14WE HAVE ENTERED THE SHARING ECONOMY ERA
100M
subscribers
150M
users 400 000 members 150M
400 locations subscribers
90 cities
1516
MOBILITY IS         MOBILITY
        NEITHER       IS AN UNRELENTING
       A MARKET,           SOCIETAL
     NOR A CATEGORY       REVOLUTION

        MOBILITY          AS SUCH,
      IS BECOMING        MOBILITY IS
      AN ESSENTIAL       A BLESSED
         SERVICE         BUSINESS!

17
THE ‘‘MOBILITY BUSINESS’’
2030
TODAY
16% 19%
World World
GDP, GDP,
#2 #1
18
Source: International Data (IDC), Siemens “Megacity Challenges”, World Bank, Oliver Wyman analysisMOBILITY IS A BIG CAKE AND EVERYONE WANTS A SLICE OF IT
SEAMLESS
INTEGRATED START UP
ACCESSIBILITY
MAAS
FREEDOM
PLATFORM
CONNECTED
MULTIMODALITY
PROVIDER
LOCAL AUTHORITIES
ONE APP
FLEET
MOBILE
URBAN
INTEGRATION
QUALITY
TECH OF LIFE
ECOLOGIC GLOBAL
TAILORMADE
MULTIMODALITY CO-CONSTRUCTION
19 COOPETITIONWHERE DOES
EUROPCAR MOBILITY
GROUP STAND?
20EVOLUTION OF WORLDWIDE ADDRESSABLE WHEELED MARKET
2017 +8.3% 2030
CAGR
415 1000
+4%
CAGR
€865bn €1700bn
+12.5%
450 CAGR 700
Rental / Leasing Urban Mobility
21
SOURCES: Oliver WymanOVER THE LAST 3 YEARS,
WE HAVE HEAVILY INVESTED*
TO CAPTURE GROWTH
22
*CAPEX & OPEXSTRONG REFOUNDATION OF OUR “OPERATING SYSTEMS”
(MIDDLEWARE) TO SUPPORT OUR TRANSFORMATION
Click&Go program
> digital customer
journey
NPS 110 program
New CRM
> customer satisfaction
> digital performance
ONE GROUP
CALL CENTERS Connected Vehicles
> customer care program > digital
(3C program) operations
23 STRONG GROWTH MOMENTUM SINCE 2015
2.142
2.929 251 350
+37% +39%
FY REVENUE (€M)
FY ADJUSTED CORPORATE EBITDA*
44 56.4 CAPEX DIGITAL €170M
€200M
OPEX URBAN MOBILITY €30M
+12pts
FY EUROPCAR NPS
24
NOTES: REVENUE AND ADJUSTED CORPORATE EBITDA ARE REPORTED FIGURES
EXCL. NEW MOBILITY (€M)WE ARE READY TO ADDRESS A BROADER RANGE
OF WHEELED MOBILITY USAGES…
DAY(S) HOUR HOURS
TO OR TO
WEEK(S) LESS DAY(S)
& more
RENTAL URBAN MOBILITY
25WITH VERY STRONG ASSETS
TO MOVE FORWARD
AND SEIZE THE OPPORTUNITIES
WHICH ARE AHEAD OF US…
26WE HAVE A UNIQUE, CENTRAL POSITION
Mapping of relevant players on the mobility value chain
Platform &
Vehicle Maintenance & Fleet mgt. Customer
Services
Manufacturing Repair Incl. financing Operations
MaaS
OEMs B2C Platforms
Micro-mobility
Ride-hailing/Taxi
Car sharing
Car & Van rental
Leasing
27WE SERVE OUR CUSTOMERS IN MORE THAN 130 COUNTRIES
45
2 TERRITORIES 15
TERRITORIES TERRITORIES
PARTNERS
13
TERRITORIES NORTH AMERICA
Canada
USA
ASIA
30 India
TERRITORIES China
29
Japan
TERRITORIES 7
TERRITORIES
30
TERRITO
28 RIES7.7M ACTIVE CUSTOMERS IN 2018
27%
market
share
x 2.75
29WITH 27% MARKET SHARES, WE ARE THE UNDISPUTED
CAR RENTAL LEADER IN EUROPE
Avg. Market share
27% 18% 18% 14% 13% 10%
Others
30
1. Euromonitor data, including total revenue from franchisees and vans rental market below 1Ton
Source: Euromonitor 2018, Oliver Wyman analysisWITH 60% LEISURE & 40% BUSINESS,
WE BENEFIT FROM A BALANCED POSITIONING
Rental revenue breakdown by customer group Corporate car rental market growth
2018, Worldwide, in % 2017-2030, Worldwide, in M€
+4%
CAGR 37,342
23,570
Corporates 40% 2017 2030
60% Leisure Leisure car rental market growth
2018-2030, Worldwide, in M€
71370
+8.2%
CAGR
27764
2018 2030
31 1. Includes accident replacement 2. In corporate countries
Source: Companies Annual reports, Companies investor presentation, EMobG presentations, Euromonitor, Oliver Wyman analysisWE ARE A LARGE SCALE, ASSET LIGHT FLEET MANAGER
2018
Fleet average size 315k 90% Fleet in buy back
Sales points served 1900 246€ Controlled and derisked FCPU
Number of rental days 90M
€5bn €5bn
Fleet Back
asset financing
32WE ARE SCALING UP OUR URBAN MOBILITY ASSETS,
WITH VERY PROMISING PERSPECTIVES AHEAD OF US
Evolution of car sharing market worldwide Europcar Mobility Group vehicle sharing facts & figures,
2018-2025, in $USbn Q1 2019
UBEEQO’S
GROWTH RATE
+11%
IS 4 TO 5 TIMES 2018
CAGR SUPERIOR +52%
revenue
TO THE
MARKET’S ONE
10.9
5.6
2018 2025
• Ubeeqo to be break even during our journey to 2023.
But priority is first manage to seize market opportunities and take position,
then scale up to profitability. Ireland cities are already porfitable since 2018.
33
Sources: PS Market research / gminsights.comLEVERAGING THESE STRONG ASSETS,
WE ARE INVESTING TO BUILD
ONE FULLY INTEGRATED
TARGET OPERATING MODEL
& BEST CAPTURE
GROWTH OPPORTUNITIES
342023: ONE GROUP TARGET OPERATING MODEL
ONE INTEGRATED, AUGMENTED INFRASTRUCTURE
4 CORE BRANDS
ONE GLOBAL NETWORK
ONE CUSTOMER
ONE TECH BACKBONE JOURNEY
ONE ONE ENLARGED
CONNECTED CUSTOMER BASE
FLEET ONE AGILE ORGANIZATION
ONE TALENT POOL
352023
> €4.0bn
Urban
2018
+33% Mobility
X10*
2.9bn
36
*circaCAPITAL MARKETS DAY 25/06/2019
AS OF TODAY, OUR ORGANIZATION BY BUs’ IS THE ‘‘ENGINE’’
 OF THE GROUP

                       CUSTOMERS

        CARS       LOW COST      VANS & TRUCKS    URBAN MOBILITY
                 DIGITAL DISTRIBUTION PLATFORMS                    OPERATING
                                                                   MODEL
                      PHYSICAL PLATFORMS                           TODAY

38
WE HAVE BUILT A POWERFUL BATTLESHIP
CUSTOMERS
CARS LOW COST VANS & TRUCKS URBAN MOBILITY
• Direct2Brand eCom • Full integration in • Started expansion, • Open car sharing focus
growth: +9 % in 2018 9 months in the flexi market, where we can get scale:
vs previous year • Double-digit covering longer Paris!
• Strongly multi-segment: growing market duration • Clear opportunity in the
B2C, B2B and B2B2C • Platform for global • Network reinforced Corporate Car Sharing
• Geographical expansion with super-sites market
expansion (India, • 1 500 cars already
Israel…) dedicated to PHV
(Uber-like) drivers
• Asset utilization centric organization at 76%
39
• Highest buyback share in the market
• Constant fleet cost optimization… AND THIS BATTLESHIP HAS BEEN ABLE TO SUPPORT OUR GROWTH
+10% +199% +29% +45%
€2.122M €388M €344M €35M
CARS LOW COST VANS & TRUCKS URBAN MOBILITY
40
2018 FY results, reported revenueWITH THESE 4 ‘‘VERTICALS’’, WE ARE WELL POSITIONED
TO FURTHER CAPTURE GROWTH
2017 +8.3% 2030
CAGR
415 1000
+4%
CAGR
€865bn €1700bn
+12.5%
450 CAGR 700
Rental / Leasing Urban Mobility
41
SOURCES: Oliver Wymanshift OUR
2023
ROADMAP
TO FURTHER
CAPTURE GROWTH
42WE HAVE SET OURSELVES AMBITIOUS GOALS
> 4bn
REVENUE
(CIRCA 10% 15M
coming ACTIVE
from Urban
Mobility) CUSTOMERS GROUP
NPS*
AT 50
43
PROFITABLE GROWTH
*Including all brands scores5 PRINCIPLES, ON WHICH WE ALL COMMIT TO ACHIEVE THESE GOALS
S peed up
High value creation
I nvest in the future
shift 2023
Focus on customers
Tech & talents-powered
44WE WILL WIN 2 BATTLES WITH 5 ACTIVATION LEVERS
1 One Brand Portfolio
AUGMENT AMPLIFY
CORE BUSINESS BUSINESS SERVICES
One Phygital Customer
Enhanced car rental 2 Journey
Develop customer experience on
the car rental market
One B2B Commercial
Enhanced van rental
Services to Corporates 3 Platform
Become the first European one-stop- Offer corporate customers a
shop for van rental offering a flexible, comprehensive platform of mobility
digital and hassle-free rental experience services, leveraging public subsidies
for all customers, specially for SME and enabling companies to improve One Connected Fleet
employees’ quality of life 4 and One Network
Scaled-up Urban Mobility
Scale-up to conquer European major
One Customer
cities with an hybrid model 5 Data Base
45THE WORLD IS OUR BATTLEGROUND 46
ENHANCE CAR RENTAL

                                                              > € 3.1 bn
               € 2.5 bn            > 25%
                                                              REVENUE

                     •    Digitisation of the customer journey
     WHAT            •    Individualisation / Personalisation of the offer
  IS FEEDING         •    Customer repetition
THE GROWTH?          •    Flexibility as a “core” element of the offer
                     •    Global expansion
  47
ENHANCE VAN RENTAL
€ 0.5 bn
€ 0.35 bn > 50% REVENUE
• Digitisation of the customer journey, dedicated to the B2B world
WHAT • Flexibility as a “core” element of the offer, covering longer durations
IS FEEDING
THE GROWTH? • Proximity with higher specialization
• Selective M&A
48SCALE-UP URBAN MOBILITY
€ 0.4 / 0.5 bn
€ 0.04 bn circa X 10
revenue
• Focus and scale in big cities, where we can assure proximity (a car
WHAT within 400M in Paris) and leverage our core infrastructure
IS FEEDING • Car rental B2B focus to feed Corporate Car Sharing and ride hailing
THE GROWTH? solutions
• PHV (Uber drivers) market growth
49SERVICES TO CORPORATE
40% 45%
B2B + 5pts B2B
revenue revenue
• From business travel and car replacement to new uses cases: flexi
WHAT lease, corporate car sharing, …
IS FEEDING • Total access to the full digital customer journey
THE GROWTH? • New platforms and new loyalty program
• Entry point for the BLEISURE (business-leisure) growth
50ACHIEVE NURTURE
OPERATIONAL & ENLARGE
EXCELLENCE OUR
AS ONE CUSTOMER
GROUP BASE
Olivier Baldassari Albéric Chopelin
Group Chief Countries Group Chief Commercial
and Operations Officer And Customer Officer
51WE OPERATE
A VERY CONCRETE BUSINESS
AT A LARGE SCALE:
GRANULAR,
DAILY,
LOCALIZED,
EXPERT,
PROFITABLE
52OUR OPERATIONS AT A GLANCE
12 000 € 2.929 bn
employees revenues
7.7M
~ 70% employees clients ~ 24% of revenue
in stations 315 000 vehicles in station costs
~ 30% employees 90M rental days ~ 12% of revenue
in support functions 14M Rentals in support
~ 76% utilization rate function costs
1 900
stations directly
operated 646 000 m3
~ 35 000 = yearly water
300 stations in airports
connected cars consumption
60 stations in railway
~ 4 200 cars to wash cars
32 Supersites
8 cities with car with direct access
sharing activated ~ 4 600 Low
emission vehicles
533 KEY INITIATIVES TO SUPPORT GROWTH AND ACHIEVE OPERATIONAL
EXCELLENCE SHIFT 2023
ONE ONE ONE
OPERATIONAL CONNECTED DIGITALIZED
FRAMEWORK FLEET NETWORK
€30M support 2% margin
functions run 80% connected improvement
rate reduction vehicles by 2023 in 2023
by end 2020
54ONE OPERATIONAL FRAMEWORK
SHIFT 2023
We are standardizing our target
Countries, business units and operating model through our HQ 2020
Functions are organization pillars program
• Target Operating Models have been
defined for all main functions
BUSINESS
UNITS GLOBAL • Group Functions leadership has •€10M savings in 2019
FUNCTIONS
authority for the organization and
•€30M support functions
the processes within their function
run rate reduction by
• Business Units are integrated in end 2020
each country organization and
COUNTRIES
resources are shared
• Country Management team focus
on execution
• Discipline is a new motto
55ONE CONNECTED FLEET
SHIFT 2023
Automated fleet inventory
Geofencing based alerts
ASSETS Vehicle anomalies detection
Theft alerts
Mileage based alerts
Direct Access
Direct return CUSTOMER At least 80% connected
Enhanced safety EXPERIENCE vehicles by 2023
Enhanced Driving experience
Deskless station
STATION Turnaround process monitoring
Telemetry
OPERATION
Damage management
Performance Management
56ONE DIGITALIZED NETWORK
SHIFT 2023
Tactical Optimisation Design Optimization One digitalized Network
• Network • Airports & railways •2000 points of sales within • 1pt margin
improvement
resizing in (389) one integrated physical
by 2020
UK (199->129), • Supersites (32) network
France (315 ->246), • Retail stations (1500) •One Integrated digital • 2pts margin
• Germany and Spain • Maintenance & Infleet platform improvement
in progress •Pilot in Mallorca (5000 in 2023
/ Defleet centers (20)
• Logistic network vehicles)
optimization •Ubeeqo (3500 vehicles)
•Europcar Ireland (10200
vehicles)
•GoCar (700 vehicles)
57
•One Fleet across all brands2019 – 2023 OPERATIONAL EXCELLENCE ROADMAP
SHIFT 2023
2019 2020 2021 2022 2023
One
Arming
operational phase Execution
framework €30M run rate reduction
One
Connected Planning
Fleet 80% connected
One digitalized Planning
Network
1pt margin improvement 2pts margin improvement
58WE OPERATE
A VERY CONCRETE BUSINESS
WITH A GREAT DIVERSITY OF CUSTOMERS:
DIFFERENT CULTURES,
DIFFERENT NEEDS,
DIFFERENT USAGES AND DURATION,
DIFFERENT SATISFACTION TRIGGERS,
VALUABLE
59COMMERCIAL & CUSTOMERS KEY FACTS & FIGURES
SHIFT 2023
7.7M Active Customers 15M Active Customers
Group Customer Database Omnichannel Approach
4
Group Customer ID Core Commercial Platforms
Brands
Group CRM Platform Group Loyalty Program
3 Bn€ Revenue > 4 Bn€ Revenue
603 PRIORITIES
Mission: Lead worldwide Sales & Marketing Expertise of Europcar Mobility Group
into Excellence & Customer Centricity,
in order to nurture a profitable & sustainable growth
1 2 3
BRAND
OFFER CUSTOMER
PORTFOLIO
DESIGN ENGAGEMENT
MANAGEMENT
61AMBITION: 15M ACTIVE CUSTOMERS
x2
QUANTITATVIVE
+2 15M
+2
+2 Services to corporate
& Urban Mobility
+1 Services to
corporate
7.7 M
Enhanced
van rental
Enhanced
car rental
QUALITATIVE
2018 Incremental SMEs Business Business & Urban 2023
leisure travelers mobility
Frequency
Sessions per month per user 10 >15
Customer average spend +/- + ++ +++
62
1. In peak season, ~2 outside peak season1
BRAND
PORTFOLIO
MANAGEMENT
634 CORE BRANDS
SUSTA
SMART CONNECTED PIONEER INABL
SUSTAINABLE
E
RELIABL
FAIR FAST RELIABLE SPONTANEOUS
E
FEEL GOOD SIMPLE GREEN CITY-ZEN
64VALUE CREATION
Revenue Margin Customer
Satisfaction
Brand Differentiation Operational Excellence
Brand Stretch Centralized marketing
Enhanced Car / Van Rental Engagement System
ROI Based Decisions
Urban Mobility Focus on Profit Pools
Offer Design & innovation Pricing Power
652
OFFER
DESIGN
66OFFER DESIGN
METHOLOGY EXAMPLE: SERVICES TO CORPORATES
1. Customer Selection & 2. Value capture /
Value Proposition Profit model
5. Operating Model
3. Scope of activities
4. Strategic control
& Assets
67OFFER DESIGN | SERVICES TO CORPORATES
For Travel Managers: integrated services can simplify For employees: more mobility options are available
processes, improve visibility, reduce travel costs, etc. and the travel experience is enhanced
Invoice Policy enforcement Ride-hailing Ride and car sharing
Digitization • Premium cars & drivers • In Parking
• Longer waiting times • Publicly available
Billing Benchmarking of Car rental Micro-mobility
customers • Corporate account • Bike sharing on-site
• Negotiated prices • Public Bike sharing info.
• Special rewards
ERP Integration Instant
payment
Incentive Scheme
Rewards for generated
savings for the company
Cost Reporting
Virtual Credit Card
Loyalty program
Rewards for frequent travellers
VAT claim Insurance applicable on leisure account
683
CUSTOMER
ENGAGEMENT
69CUSTOMER ENGAGEMENT
1 2 3 4 5 6
DESIGN ENLARGE CREATE CONSOLIDATE LAUNCH MONITOR
PHYGITAL CUSTOMER STICKYNESS A UNIQUE COMMERCIAL CUSTOMER
CUSTOMER BASE CUSTOMER ID OFFENSIVES SATISFACTION
JOURNEY
Group prototype Business CRM Cross-selling Specific platforms NPS 110 Program
travelers, SMEs, Personalization Packaged offers for Corporates, Reputation
Omnichannel
Business & urban & loyalty program Multibrand forces B2G & SMEs
Group CX Gate mobility Integration Boost cross seliing
70CUSTOMER ENGAGEMENT
ENHANCE PERSONALIZATION DIGITALIZE THE CUSTOMER JOURNEY
The right target at the right moment Phygital seamless experience defined at
brand level and optimized at Group level
+ 20% revenues through personalized • User Friendly app
web experience • Digital car check & return
• Click & Go, …
+15% revenues through personalized
upsells travel
Create
INCREASE FREQUENCY Stickyness DESIGN A BEST IN CLASS
2018 sessions per month per user LOYALTY PROGRAM in 2020
#, in US
• Bridge B2B & B2C
21
• Increase cross-selling
18
• No one size fits all program
10 9 • Smart Group contact plan
5
>1
Mobility Food Public Ride- Car Traditional
mapping Takeaway Transport hailing sharing car rental
71
Note: Index built using estimates that at least 21% of users take ride-hailing or taxi services at least once a month per HSBC broker report and that average number of sessions per month for Lyft or Uber is 9 per Verto. 42% of users take food takeaway at least monthly, ratio for ride-hailing is
applied to food takeaway to compute food takeaway number of sessions; Similarly, average frequency of use of public transport of 2,7 times per month vs. 2,3 for Uber or Lyft, this ratio is used to assess the number of sessions for public transport apps; and metrics for “other” categories
exclude companies separately called out in the same industry; sample of 20 companies with 2016 and 2018 data, 9 companies with 2017 and 2018 data, and 10 companies with 2018 data only Source: Verto Indexes 2016, 2017 and 2018; Oliver Wyman analysisCONSOLIDATE A UNIQUE CUSTOMER ID WITH EXISTING ASSETS
… creating a key asset for the
From 5 independent customer bases … … to a single group customer ID …
group to leverage through digital
EMobG’s customer data bases One consolidated database
Improved customer
Corporate
EMobG
1 acquisition
countries1
consolidated
Phoenix customer database
Franchisees Enhanced retention
In-house
or
Rentway
…
Incremental revenue
Bubirent Sigger
with with with
1 customer = X profiles 1 customer = 1 profile 1 Group Contact Plan
72AS A CONCLUSION… 73
3 PRIORITIES INTO 15M ACTIVE CUSTOMERS

                    1                             2                               3
          BRAND
                                            OFFER                      CUSTOMER
        PORTFOLIO
                                            DESIGN                    ENGAGEMENT
       MANAGEMENT

     • Focus on 4 Core Brands         •   Innovation                  •   Phygital Customer Journey
     • Empowered Brands with unique   •   Cross selling               •   Unique Customer Database
       & differentiated identity      •   Upselling                   •   Global CRM Platform / Personalization
     • Pricing power                  •   Bundled offers              •   Group Customer ID
     • Centralized marketing          •   Service to Corporates       •   Loyalty Program
     • Systematic ROI decisions       •   E Commerce & Direct Sales   •   NPS 110 & Reputation
74
FINANCE SECTION
GROUP KEY FINANCIALS OVER LAST FOUR YEARS
                              REVENUE (€M)                                                             ADJUSTED CORPORATE EBITDA excl. New Mobility (€M)
                                                                                               Growth                       +39%
Growth                             +37%
                                                                                                                                                350
                                                             2,929
                                                                                                                  251
               2,142

              FY 2015                                      FY 2018                                              FY 2015                       FY 2018

                                               CORPORATE FREE CASH FLOW (€M)

                            Growth                                      +57%
                                                                                                  135
                                                                                                                          • c.€470m of Corporate FCF
                                                     86                                                                     generated over 2015-18
                                                                                                                          • Total shareholder returns over the
                                                                                                                            last four years of c.€200m

                                                  FY 2015                                      FY 2018

                                                      Strong growth in all three key financials indicators
76
         NOTES: REVENUE, ADJUSTED CORPORATE EBITDA AND CORPORATE FREE CASH FLOW ARE REPORTED FIGURES
STRONG OPERATIONAL GROUP PERFORMANCE OVER LAST 4 YEARS
RENTAL DAY VOLUME (MILLION) FLEET COSTS PER UNIT PER MONTH (€)
Growth +54% Change (11)%
88 253
57
226
FY 2015 FY 2018 FY 2015 FY 2018
UTILIZATION RATE (%) AVERAGE FLEET (THOUSAND)
Growth +54%
76.1% 76.1%
316
205
FY 2015 FY 2018 FY 2015 FY 2018
High capability to manage superior growth with resilient and flexible operating model
77
NOTES: FIGURES AT CONSTANT EXCHANGE RATEFOCUS ON GOLDCAR AND BUCHBINDER ACQUISITION SYNERGIES
2018 2019 2020 %1 2018 2019 2020 %1
≥ Fleet
purchasing 66%
33%
c.€10m c.€2m
33% Fleet financing N/A N/A N/A
synergies synergies
already attained already attained
in 2018 for in 2018 for
Goldcar ≤ Buchbinder
Other 33%
33%
Total
100% synergies 100%
Well on track to reach over €30m synergies for Goldcar and over €10m synergies for Buchbinder by 2020
78
NOTE: 1 - PERCENTAGE OF TOTAL ESTIMATED SYNERGIESSELF-HELP MEASURES
TOTAL
HQ EXPECTED NETWORK
2020 SYNERGIES OPTIMIZATION
2%
OF GROUP REVENUE
BY 2020
3%
OF GROUP REVENUE
BY 2023
792020 CORPORATE EBITDA MARGIN PROSPECTS
Corporate EBITDA margin bridge between 2018 and 2020
Low end In line
with current market
Including (0.9)% of
consensus
UM impact
+0.9-1.0%
+0.7-1.0%
+0.7-1.0% 12.5% - 13.0%
11.2% (0.6-0.7)%
(0.4-0.6)%
-
2018 Network HQ efficiencies Synergies Marketing & Macro environment 2020
optimization Digitization
Accelerating self help measures confirmed on a 2021 run rate basis
80 Target of Corporate EBITDA margin range between 12.5% and 13.0% by 2020GROUP REVENUE MID-TERM AMBITION
Revenue bridge between 2018 and 2023
>€4bn
CAGR +50%
2018-23 +8%
+8%
+3%
€2.9bn
2018 Cars Vans & Trucks Low Cost Urban Mobility M&A 2023
New Group Revenue target of above €4bn by 2023 implying a CAGR of above 10%
81 Urban Mobility BU expected to grow Revenue by at least 50% per annum over the periodCASH ALLOCATION PROSPECTS
Growth acceleration
M&A Selective & strategic focus on bolt-on and international expansion
Maximum 2.5% of Group Revenue in 2020-2023
NON-FLEET CAPEX
Over 70% of which into Group digitization
Shareholder returns
DIVIDEND POLICY Maintain the current dividend policy
& TACTICAL SBB Funded by excess cash when appropriate
Balanced cash allocation between growth acceleration and shareholder returns
82FINANCIAL AMBITION FOR 2023
• Organic Growth
REVENUE • Urban Mobility
> €4bn Group Revenue
• M&A / Strategic partnerships
• Fleet Costs
PROFITABILITY • Network Rationalisation > €500m Corporate EBITDA *
• HQ Optimisation
• Strong FCF Generation
LEVERAGE • Ability to deleverage by around [2.0-2.5x] Corporate net leverage
0.5x EBITDA per annum
83
NOTE: * CORPORATE EBITDA EXCLUDES IMPACT OF IFRS 16 ; INCLUDING IFRS 16, THIS FIGURE WOULD BE CLOSER TO €600 MILLIONKEY
TAKE-AWAYS
84WE HAVE A UNIQUE, CENTRAL POSITION
Mapping of relevant players on the mobility value chain
Platform &
Vehicle Maintenance & Fleet mgt. Customer
Services
Manufacturing Repair Incl. financing Operations
MaaS
OEMs B2C Platforms
Micro-mobility
Ride-hailing/Taxi
Car sharing
Car & Van rental
Leasing
85Car rentals Car manufacturers New mobility
-1% 19-23
1% 10% 17% -4% 4% 17% 66% 143%
69%
2016 - 2018
Sales CAGR
median
5% 8% 12% 13% 4% 7% 8%
EBITDA
Margin 2018
(EBIT for car
manufacturers)
median
0% 0% 3% 0% 2% 5% -19% -16%
-14%
FCF/Sales
2018
median
1.5x 1.8x 2x 2.4x 0.2x 1x 1.4x 6.7x 6.8x
EV/Sales
2019e
median 865 PRINCIPLES, ON WHICH WE ALL COMMIT TO EXECUTE OUR 2023
ROADMAP
S peed up
High value creation
I nvest in the future
shift 2023
F ocus on customers
T ech & talents-powered
87WE HAVE SET OURSELVES AMBITIOUS GOALS
> 4bn
REVENUE
(CIRCA 10% 15M
coming ACTIVE
from Urban
Mobility) CUSTOMERS GROUP
NPS*
AT 50
88
PROFITABLE GROWTH
*Including all brands scores2023: ONE GROUP TARGET OPERATING MODEL
ONE INTEGRATED, AUGMENTED INFRASTRUCTURE
4 CORE BRANDS
ONE GLOBAL NETWORK
ONE CUSTOMER
ONE TECH BACKBONE JOURNEY
ONE ONE ENLARGED
CONNECTED CUSTOMER BASE
FLEET ONE AGILE ORGANIZATION
ONE TALENT POOL
892023
> €4.0bn
Urban
2018
+33% Mobility
X10*
ADJUSTED
CORPORATE
2.9bn EBITDA
> €500M
90
*circaQ&A 91
WITH YOU TODAY: “MOBILITY TALKS” SPEAKERS

       Xavier Corouge               Alexandre Crosby           Luc Peligry          Darragh Genockey
         Managing Director,             Group Chief             Group Chief           Business Leader
         Urban Mobility BU             Product Officer         Finance Officer         Vehicle Sharing
            (former Group                                                             Urban Mobility BU
     Digital & Marketing officer)

      How to build a                  Discovering our       Understanding our          How to build a
     compelling digital             Product organization     Group’s debt and      profitable car sharing
     customer journey                and our Connected     refinancing structure   business (Ubeeco and
                                     Cars product lines                              it affiliate GoCar)
92
CAPITAL MARKETS DAY 25/06/2019
APPENDIX
You can also read