Corporate Overview July 2021 - WD-40 Company
←
→
Page content transcription
If your browser does not render page correctly, please read the page content below

Corporate Overview July 2021
Forward-Looking Statements
Historical financial and operating data in this presentation reflect the consolidated results of WD-40 Company, its subsidiaries and its legal
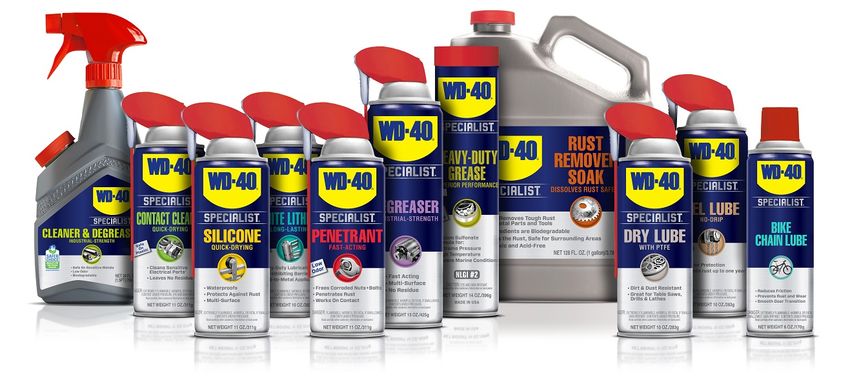
entities. WD-40 Company markets maintenance products (“MP”) under the WD-40®, 3-IN-ONE® and GT85® brand names. Currently included
in the WD-40 brand are the WD-40 Multi-Use Product and the WD-40 Specialist® and WD-40 BIKE® product lines. WD-40 Company markets
the following homecare and cleaning (”HCCP”) brands: X-14® automatic toilet bowl cleaners, 2000 Flushes® automatic toilet bowl cleaners,
Carpet Fresh® and no vac® rug and room deodorizers, Spot Shot® aerosol and liquid carpet stain removers, 1001® household cleaners and
rug and room deodorizers and Lava® and Solvol® heavy-duty hand cleaners.
Except for the historical information contained herein, this presentation contains “forward-looking statements” within the meaning of the Private
Securities Litigation Reform Act of 1995. Such statements reflect the Company’s current expectations with respect to currently available
operating, financial and economic information. These forward-looking statements are subject to certain risks, uncertainties and assumptions
that could cause actual results to differ materially from those anticipated in or implied by the forward-looking statements.
Our forward-looking statements include, but are not limited to, discussions about future financial and operating results, including: growth
expectations for maintenance products; expected levels of promotional and advertising spending; anticipated input costs for manufacturing
and the costs associated with distribution of our products; plans for and success of product innovation, the impact of new product introductions
on the growth of sales; anticipated results from product line extension sales; expected tax rates and the impact of tax legislation and regulatory
action; the length and severity of the current COVID-19 pandemic and its impact on the global economy and the Company’s financial results;
and forecasted foreign currency exchange rates and commodity prices. Our forward-looking statements are generally identified with words
such as “believe,” “expect,” “intend,” “plan,” “could,” “may,” “aim,” “anticipate,” “target,” “estimate” and similar expressions.
The Company's expectations, beliefs and forecasts are expressed in good faith and are believed by the Company to have a reasonable basis,
but there can be no assurance that the Company's expectations, beliefs or forecasts will be achieved or accomplished.
Actual events or results may differ materially from those projected in forward-looking statements due to various factors, including, but not
limited to, those identified in Part I―Item 1A, “Risk Factors,” in the Company’s Annual Report on Form 10-K for the fiscal year ended August
31, 2020 which the Company filed with the SEC on October 21, 2020 and in the Company’s Quarterly Report on Form 10-Q for the period
ended May 31, 2021 which the Company filed with the SEC on July 7, 2021.
All forward-looking statements included in this presentation should be considered in the context of these risks. All forward-looking statements
speak only as of July 7, 2021 and we undertake no obligation to update or revise any forward-looking statements, whether as a result of new
information, future events or otherwise. Investors and prospective investors are cautioned not to place undue reliance on our forward-looking
statements.
2
Who We Are
What Does A Good Business Look Like?
    •   Strong and highly engaged culture

    •   Simple and easy to understand business model

    •   Brand leader in its industry

    •   Superior returns on capital

    •   Sustainable competitive advantage

    •   Significant cash flow generation

    •   Strong balance sheet

    •   Growth opportunities

    •   Proven management team

4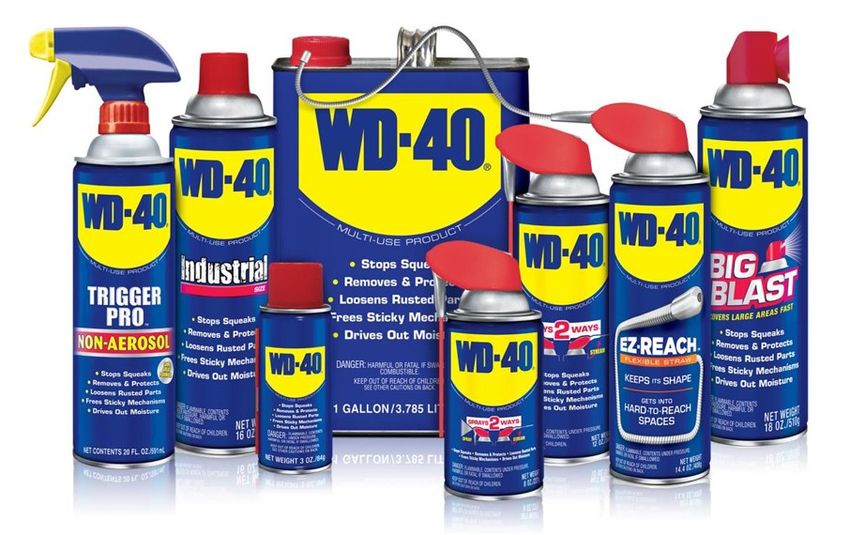
WD-40 Company’s Origins
      In the 1950’s a chemist in San Diego set out to create
      a compound that would prevent rust and corrosion. It
      took him 40 attempts to get the water displacing
      formula right, but the result became the original
      secret formula for WD-40® Multi-Use Product.

                                                              2008
                                          1973                International     2015
                                                              sales exceed
                      1958                WD-40 Company
                                                              domestic
                                                                                WD-40 EZ-
                                                                                REACH
                      WD-40 Multi-Use     goes public on
                                                              sales for the     successfully
                      Product makes       the NASDAQ;
    1953              appearance on       stock increases
                                                              first time in
                                                              Company’s
                                                                                launched
    Rocket Chemical   store shelves in    61% on first
                                                              history
    Company           San Diego           trading day
    Incorporated                                                                               In 2020…
                                            1997        2005            2011                   Company celebrated 67th
     1953 - 1958               1970                                     WD-40                  anniversary, flagship WD-40
                                            Garry       WD-40                                  Brand is more popular than ever,
                               The name                                 Specialist
     WD-40 Multi-Use                        Ridge       Smart Straw                            achieved over $408 million in net
                               WD-40                                    product line
     Product is used by                     named       successfully                           sales, and products are available
                               Company                                  successfully
     aerospace industry and                 president   launched                               in more than 176 countries and
                               was                                      launched
     on the SM-65 Atlas                     and CEO                                            territories worldwide
                               adopted
     missile

5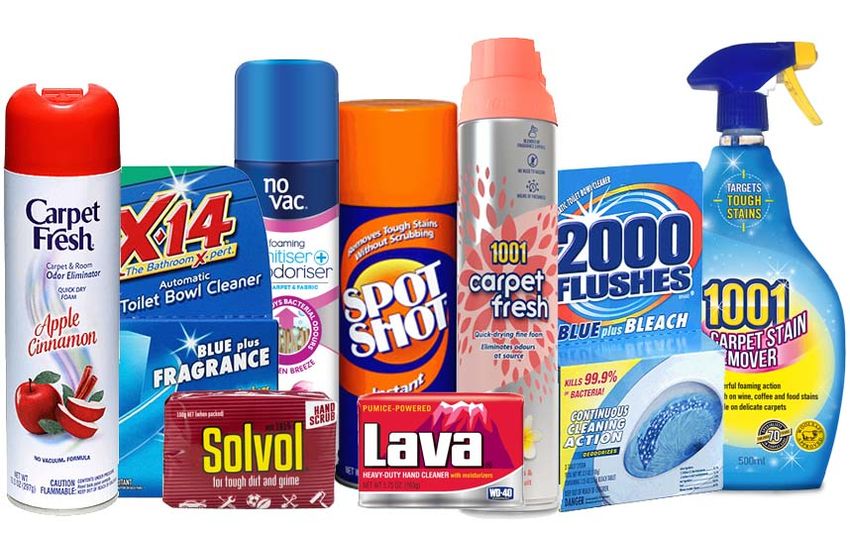
Our Brands

        MAINTENANCE PRODUCTS                             HOMECARE & CLEANING PRODUCTS

    •   Currently make up ~90% of net sales              •   Available in niche segments and geographies
    •   Core strategic focus and primary growth engine   •   Generate positive cash flows but are not core
                                                             strategic focus

6
PEOPLE PURPOSE PASSION PRODUCTS

    LEARNING              PEOPLE                                                     PURPOSE
    MOMENTS           TRIBAL CULTURE                                                   WHY

         EXECUTION    TYPHOON PLANNING                                                VALUES
          (TACTICS)     ZONE  (STRATEGY)                                             FREEDOM

       CARE - CANDOR - ACCOUNTABILITY - RESPONSIBILITY

7                                      © 2019 Learning Moment, Inc.
                      All rights reserved. Do not duplicate. thelearningmoment.net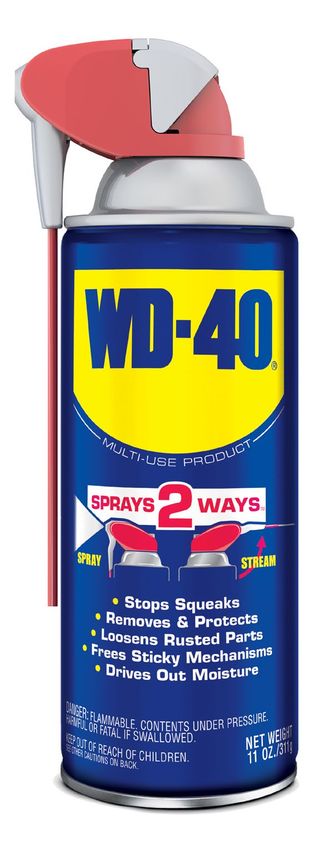
OUR PURPOSE “WHY”
       We exist to create positive lasting memories in everything we do. We
    solve problems. We make things work smoothly. We create opportunities.

                        HOW WE DO IT “HOW”
       We create positive lasting memories by cultivating a tribal culture of
     learning and teaching which produces a highly engaged workforce who
                      live our Company’s values every day.

                        OUR MISSION “WHAT”
    We deliver unique, high value and easy-to-use solutions for a wide variety
     of maintenance needs in workshops, factories and homes. We market
    and distribute our brands across multiple trade channels in countries all
                                 over the world.

8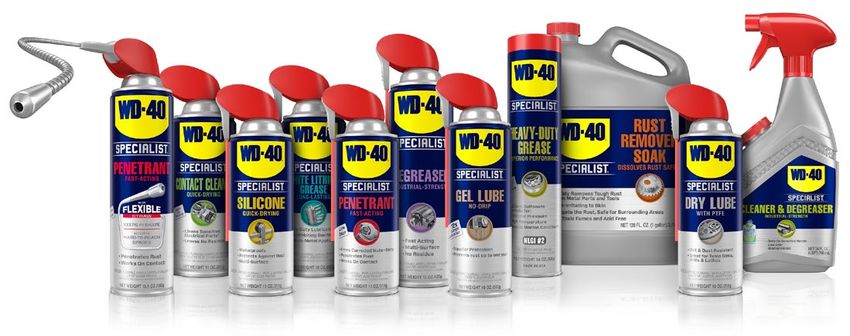
Our Values

9
Our job is to make sure we create an environment where
  our tribe members wake up each day inspired to go to
work, feel safe while they are there, and return home at
the end of the day fulfilled by the work they do – feeling
 that they have learned something new and contributed
          to something bigger than themselves.

This is the world we envision. If we can create this world
for our people, they will take care of our customers, and
     that will, in turn, take care of our stockholders.
Environment, Social and Governance (“ESG”)
• Company published its first-ever ESG
report in October 2020
• The report covers practices and activities
related to material issues covering:
• Our tribe - prioritizing the well-being
of our employees
• Our products - ensuring that our
products are safe
• Our sourcing and supply chain -
minimizing our impacts on the natural
environment
• The full report can be downloaded at:
https://www.wd40company.com/our-
company/corporate-responsibility/
11Circle of Competence
Our Circle of Competence

                   CULTURE

                                               This intense focus on playing to his
     END USERS                  GLOBAL            strengths — and largely ignoring
                                            everything else — lies at the heart of
                                             Buffett’s success. He once remarked:
                                         “You have to stick within what I call your
                                                   circle of competence. You have
                                                to know what you understand and
                                                   what you don’t understand. It’s
                                         not terribly important how big the circle
                 DISTRIBUTION               is. But it’s terribly important that you
                                                    know where the perimeter is.”

                                                                  - Warren Buffett

13
Brand Equity
The “shield” carries with it positive brand equity - the brand is memorable,
easily recognizable, and known for its superiority in quality and reliability.
Similar to Coca-Cola, Kentucky Fried Chicken and Google, the formula for
WD-40 Multi-Use Product is a trade secret so protected that there was never
a patent filed for it.
142020 Employee Engagement Survey Results
Question Result
Average of all questions 93.0
I love to tell people that I work for WD-40 Company. 98.3
I am clear on the company’s goals. 98.0
I understand how my job contributes to achieving WD-40 Company’s goals. 97.9
I feel my opinions and values are a good fit with the WD-40 Company culture. 97.5
I respect my coach. 97.1
I know what results are expected of me. 95.3
I feel like I am a valued member of my functional team. 94.8
I am excited about WD-40 Company’s future direction. 93.9
WD-40 Company encourages employees to continually improve in their job. 93.8
WD-40 Company’s vision and mission motivates me to help the company succeed. 95.9
WD-40 Company’s “Why,” “How,” and “What” motivates me to help the company succeed. 93.7
“The WD-40 Company culture is second to none! We aren't just employees, but rather tribe
members who are deeply bonded by our commitment to quality products, excellent service,
positive relationships and life-long learning.”
- Joanne Lamb, Human Resources Director, United States
15Unique Approach to Distribution 16
Broad Global Infrastructure

     Our products are currently available in more than 176 countries and territories
                   worldwide and in over 62 unique trade channels

         •   Aircraft Supplies     •   E-Commerce             •   Locksmith
         •   Appliance Repair      •   Electrical Equipment   •   Marine
         •   Automotive            •   Farming Equipment      •   Motorcycle
         •   Bicycle               •   Grocery                •   Office Supplies
         •   Big Box               •   Hardware               •   Plumbing
         •   Body Shop             •   HVAC                   •   Refrigeration
         •   Building Supplies     •   Industrial Supplies    •   Sporting Goods
         •   Chemicals             •   Janitorial             •   Welding Equipment
         •   Drug Store            •   Lawn and Garden

17
Market Share of End Users in Developed Markets
MAINTENANCE, CONSTRUCTION & PASSIONATE AT HOME NON-
REPAIR & OVERHAUL SKILLED TRADES HOBBYIST ENTHUSIAST
$70.00 per year $0.40 per year
Annual usage amounts vary dramatically among our end-users
Market share data based on Ipsos Brand Value Creator model. BVC looks at the ability to create strong brand resonance with target audience and how well market effects are
18 managed to translate into actual purchase. These factors translate into Effective Equity which is a proxy for market share. Based on multi-purpose lubricant market data in the United
States in 2019.Developed Market Distribution
Though e-commerce (included in
‘other’ category) makes up only a We estimate ~60% of our product
small % of our global sales, it has volumes are used by professionals
been our fastest growing channel in workshops and factories
for the past 2-years.
Global Sales by Distribution Channel
AT HOME NON-
MAINTENANCE, CONSTRUCTION &
PASSIONATE ENTHUSIAST
REPAIR & OVERHAUL SKILLED TRADES
HOBBYIST
19 Global sales by distribution channel for FY2019. Customer data indicative of typical WD-40 Company developed market.Growth Aspirations
Strategic Initiatives “Probably Wrong and Roughly Right”
Growth Aspirations
1. Grow WD-40 Multi-Use Product
Maximize the product line through geographic expansion, increased Grow WD-40 Multi-Use Product to
market penetration and development of new and unique delivery ~$530 million in net sales by 2025
systems. More places, more people, more uses, more frequently.
2. Grow the WD-40 Specialist Product Line
Leverage the WD-40 Specialist line to create growth through continued Grow WD-40 Specialist to ~$100
geographic expansion as well as by developing new products and million in net sales by 2025
product categories within identified platforms.
Continue to grow, nurture, and
3. Broaden Product and Revenue Base develop products that fit well with our
Leverage the recognized strengths of WD-40 Company to derive unique multi-channel distribution
revenue from existing brands as well as from new sources and products. network and grow to ~$70 million in
net sales by 2025
4. Attract, Develop and Retain Outstanding Tribe Members
Grow employee engagement to
Succeed as a tribe while excelling as individuals.
greater than 95 percent
5. Operational Excellence
Continuous improvement by optimizing resources, Execute the 55/30/25 business
systems and processes as well as applying rigorous commitment to model while safeguarding the “Power
quality assurance, regulatory compliance, and intellectual property of the Shield”
protection.
Our growth aspirations for revenue are based on the Company’s current expectations, beliefs and forecasts to strive to meet the higher end of our anticipated 2025
21 revenue targets. They are expressed in good faith and are believed by the Company to have a reasonable basis, but there can be no assurance that they will be
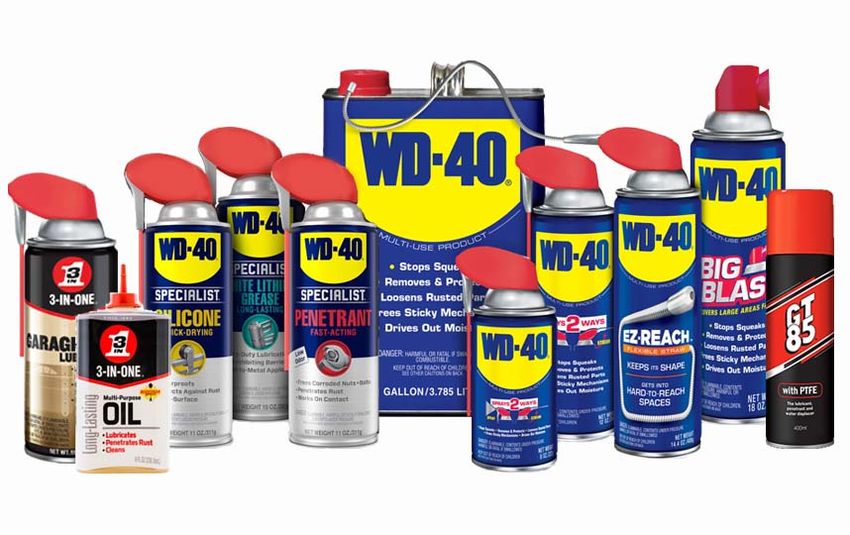
achieved or accomplished.Our Strategic Brands
WD-40® Multi-Use Product WD-40 Specialist®
3-IN-ONE ® WD-40 BIKE ® GT85 ® 1001® Spot Shot ® Solvol ® Lava ® no vac ®
22Revenue Growth Aspirations
“Probably Wrong and Roughly Right”
FY 2010 FY 2020 2025 Growth Aspirations
Reported Revenue Reported Revenue Anticipated Revenue Target
$321M $408M $650M – $700M(1)
$240M $304M ~$530M
$53M
$37M
$56M
~$100M
~$70M
Revenue Generated by Strategic Initiative #1 Revenue Generated by Strategic Initiative #2 Revenue Generated by Strategic Initiative #3(2)
1) Our growth aspirations for revenue are based on the Company’s current expectations, beliefs and forecasts to strive to meet the higher end of our anticipated 2025 revenue
targets. They are expressed in good faith and are believed by the Company to have a reasonable basis, but there can be no assurance that they will be achieved or
accomplished. Historical revenue numbers have not been adjusted for changes in foreign currency exchange rates.
23 2) Strategic Initiative #3 includes WD-40 Company products under the following brands: 3-IN-ONE, GT85, WD-40 BIKE, no vac, Spot Shot, 1001, Lava and Solvol.Growth Ambition by Segment
Total
Americas EMEA Asia-Pacific Company
43% of global sales 44% of global sales 13% of global sales Targeting a
compound annual
Targeting a Targeting a Targeting a growth in the
compound annual compound annual compound annual mid-to-high
growth rate of growth rate of growth rate of single digits
5-8% 8-11% 10-13%
Primary Growth Drivers:
• Geographic expansion of WD-40 Multi-Use Product
• Premiumization through conversion to Smart Straw Next Generation and EZ-REACH
• Increased penetration of WD-40 Specialist
• Heightening focus on digital commerce
* Percentage of sales number as of 5/31/21.
24 1) CAGR assumptions for revenue are based on the Company's expectations, beliefs and forecasts. They are expressed in good faith and are believed by the
Company to have a reasonable basis, but there can be no assurance that they will be achieved or accomplished.10-Year Maintenance Product Sales by Segment
Maintenance Products
10-Year CAGR by Segment
Americas 3.4%
$200 MP Sales by Segment
EMEA 5.8%
(In millions)
$180 Asia Pacific 6.9%
3%
$160
6%
$140
$120
$100
$80
$60
$40 7%
$20
$
FY10 FY11 FY12 FY13 FY14 FY15 FY16 FY17 FY18 FY19 FY20
Americas EMEA Asia Pac
25 1) FY20 presented as reported, all prior years presented on a constant currency basis using FY20 foreign currency exchange rates.10-Year Maintenance Product Sales
Our maintenance products have grown at a compounded annual
growth rate of 4.7% over the last 10-years
MaintenanceProducts
Maintenance Product Revenue
Sales
(In
(Inmillions)
millions)
$383
$369
$360
$340
$322
$298 $304
$289
$256
$246
FY11 FY12 FY13 FY14 FY15 FY16 FY17 FY18 FY19 FY20
26 1) FY20 presented as reported, all prior years presented on a constant currency basis using FY20 foreign currency exchange rates.Strategic Brands Global Product Sales
Our strategic brands have grown at a compounded
annual growth rate of 4.0% over the last 10-years
Strategic Brands Revenue(1)
(In millions)
$409
$397
$384
$364
$347
$324 $331
$316
$289
$278
FY11 FY12 FY13 FY14 FY15 FY16 FY17 FY18 FY19 FY20
27 1) FY20 presented as reported, all prior years presented on a constant currency basis using FY20 foreign currency exchange rates.
2) Strategic brands include WD-40 Multi-Use Product, WD-40 Specialist, 3-IN-ONE, WD-40 BIKE, GT 85, Lava, Solvol, no vac, 1001, and Spot Shot.Must-Win Battles
Our Must-Win Battles

  Must-Win Battle
                     Must-Win Battle
        #1
                           #2

    Geographic
                     Premiumization
    Expansion

  Must-Win Battle
        #3           Must-Win Battle
                           #4

   Drive WD-40
 Specialist Growth       Digital
                       Commerce
Must-Win Battle #1 - Geographic Expansion
We estimate the potential global market opportunity for WD-40 Multi-Use Product to be ~$1.0B (1)
$100 China Americas
Indonesia
EMEA
Russia
India Asia-Pacific
Saudi Germany
Arabia
Opportunity (in millions)
Brazil
South
Korea
Thailand Mexico
Egypt
Nigeria Turkey
Italy
Malaysia Spain
Vietnam Canada
Algeria Colombia
$0
Emerging Developing Developed
30 1) Based on Industrial Value Added (IVA) / Purchase Price Parity (PPP) third-party benchmarking. WD-40 Company’s estimated IVA/PPP figure is calculated using country GDP (PPP) data, which is
a country's GDP converted into ‘international dollars’ using the PPP index, then multiplied by the country's IVA (% GDP) figure.Must-Win Battle #2 - Premiumization
• Our objective is to
grow Smart Straw
penetration to >60%
of WD-40 Multi-Use
Product global sales
• We believe this growth
represents ~$50M in
incremental revenue
which will help us to
achieve our growth
aspirations
Next Generation EZ-Reach®
Classic Can Smart Straw®
Smart Straw® Flexible Straw
‘Premiumization’ of the blue and yellow can with the little red top creates
opportunities for revenue growth and gross margin expansion
31Smart Straw Next Generation
• Benefits of the Smart Straw Next Generation
• Permanently attached straw so you’ll never lose the
straw again (Similar to original Smart Straw.)
• Sprays two ways – flip up for stream, down for
spray (Similar to original Smart Straw.)
• Better actuator making it easier to spray (New)
• More ergonomic design (New)
• More durable (New)
• Improved spray pattern (New)
• First of its kind lockable “toolbox proof” design
reduces accidental discharge (New)
• Design and utility patents applications have been
filed in many places around the globe
• Launched in Canada in FY20
32Must-Win Battle #3 – WD-40 Specialist
• WD-40 Multi-Use Product’s iconic assets (blue and yellow can with a red cap) are
trusted, prominent and noticeable
• New WD-40 Specialist packaging leverages these iconic assets allowing end-users to
identify our products up to 26% faster and decreases potential ‘walk-away’
33 33WD-40 Specialist Product Categories 34
Must-Win Battle #4 – Digital Commerce

       Our global digital ambition is to engage
       with end-users at scale, becoming the
       global leader in our category on the
       digital platforms they use, making it easy
       to access, learn about, and purchase our
       brands online.

     Creating positive lasting memories….ONLINE

35
Investment Performance
5-Year Comparison of Total Stockholder Return
                                                         Value of $100 Invested on August 31, 2015

               $300
               $280
               $260
               $240
               $220
               $200
               $180
               $160
               $140
               $120
               $100
                 $80
                  FY 2015                      FY 2016                     FY 2017        FY 2018        FY 2019   FY 2020

                                           WD-40 Company                        S&P 500   Russell 2000

*$100 invested on 8/31/15 in stock or index, including reinvestment of dividends.
Fiscal year ending August 31.

Copyright© 2020 Standard & Poor’s. All rights reserved.
Copyright© 2020 Russell Investment Group. All rights reserved.

 37
What Drove the Performance?
SOLID FINANCIAL FOUNDATION FOCUSED ON CREATING VALUE
• Strong balance sheet • High Returns on Invested Capital
• Predictable free cash flow • ROIC was 32% in FY17, 31% in FY18,
• Strong liquidity & access to capital 27% in FY19, and 32% in FY20
• Employee earned incentives tied to EBITDA
growth
EFFICIENT BUSINESS MODEL WITH GROWTH PLATFORM SUPPORTED BY
ASSET-LIGHT STRATEGY STRONG BRANDS
• Average annual maintenance CAPEX needs • Brand portfolio includes many well-known
of about 1% to 2% of net sales(1) brands and products
• Outsourced manufacturing and distribution • Global diversification reduces risk
• Sales per employee of $0.78M in FY20 • Long runway of growth ahead
We invest in brands and people, not factories and warehouses
(1) Fiscal years 2017 – 2020 include capital investments above this range due to investments the Company has made in new facilities in San Diego, Milton Keynes and Pine Brook. In
38 addition, the Company has been making investments in new manufacturing equipment to increase capacity and make improvements to its proprietary delivery systems.55/30/25 Business Model
The 55/30/25 Business Model
                       WD-40 Company’s business is guided by the 55/30/25 business model
             We target gross margin at or above 55%, cost of doing business of 30%, and EBITDA of 25%

                                           55                                                  Gross Margin
                                                                                              55% of net sales

                                           30                                             Cost of Doing Business(1)
                                                                                              30% of net sales

                                                 Maintenance CAPES & Regular Dividends

                                           25
                                          Maintenance CAPEX of betweenEBITDA      (1)
                                                                          $2M to $4M   per fiscal year
                                           Annual dividends targeted 25%   of net
                                                                     at ~50%      sales or ~$20M
                                                                              of earnings

40   1)   See appendix for descriptions and reconciliations of these non-GAAP measures.
The “55” - Gross Margin
• In FY20 the Company achieved gross margin of 54.6% down from
54.9% in FY19
• Additional warehousing, distribution and freight costs, primarily in 5-Year Gross Margin Trend
EMEA (-0.9pp)
• Sales mix changes and other misc. costs (-0.8pp)
• Discount changes, primarily in the Americas and Asia-Pacific (-0.1pp)
• Changes in petroleum-based specialty chemicals (+0.8pp)
• Price increases, primarily in EMEA (+0.6pp) 55% Gross Margin Target
• Changes in aerosol cans costs, primarily in EMEA (+0.1pp)
• Continued focus on driving gross margin improvement over the
long-term
• New product development, innovations and reformulations
• Operational efficiencies
• Product mix and market mix
• Pricing adjustments, as needed, to offset input cost increases
Gross margin can be impacted positively and negatively by things not under the Company’s
control like changes in foreign currency exchange rates and input costs
41What Makes Up the Cost of a Can?
Approximate Cost Breakdown of a Typical Can of
WD-40 MUP Manufactured in the United States
2% Corrugate
21% Plastic
Petroleum-Based
34% Specialty Chemicals
13% Manufacturing Fees
33%
30% Can
Data as of September 2020. Represents average input costs over 6-month period of a typical 12 ounce can of WD-40 Multi-Use Product manufactured in the United States.
Current manufacturing and input costs typically take approximately 90-120 days to be reflected in the Company’s consolidated statement of operations due to production and
inventory lifecycles.
42The “30” – Cost of Doing Business
• FY20 cost of doing business was 34%, flat
compared to F19
• In FY20 cost of doing business came from three
primary areas:
• People costs, including earned incentive accruals
• Marketing, advertising and promotion
• Freight costs to get products to customers
• Investments in research and development, brand
development and innovation, intellectual property
protection, information systems, and regulatory
and quality assurance remain a high priority
Revenue growth is the most important factor in achieving the “30” target
43FY20 55/30/25 Results
Target FY20 FY19 FY18
55/30/25 Business Model
Actuals Actuals Actuals
Gross Margin 55% 55% 55% 55%
Cost of Doing Business 30% 34% 34% 34%
EBITDA 25% 21% 21% 21%
* See appendix for descriptions and reconciliations of these non-GAAP measures.
Note: Percentages may not aggregate to EBITDA percentage due to rounding and because amounts recorded in other income (expense), net on the Company’s
consolidated statement of operations are not included as an adjustment to earnings in the Company’s EBITDA calculation.
44Capital Allocation
Capital Allocation Strategy

                                                                                                                                                                          (2)

     (1)   Fiscal years 2017 – 2020 include capital investments above this range due to investments the Company has made in new facilities in San Diego, Milton Keynes and Pine Brook. In
46         addition, the Company has been making investments in new manufacturing equipment to increase capacity of and make improvements to its proprietary delivery systems.
     (2)   In April 2020, in response to COVID-19 health crisis, management suspended purchases under the approved share repurchase plan in order to preserve cash.
Working Capital Changes Support Growth
Working Capital as a % of Net Sales
Over the last 10-years we have taken deliberate actions
18.0%
19.2% to support our long-term revenue and gross margin
16.2% 15.5% 16.3% 15.7% 16.4%
12.3%
13.9% 14.4% objectives which have required increased investments in
working capital:
FY11 FY12 FY13 FY14 FY15 FY16 FY17 FY18 FY19 FY20
• Executed the North American Supply Chain
Working capital as a % of net sales Restructure Project (FY12)
• Launched WD-40 Specialist to diversify and
Accounts Receivable as a % of Net Sales
19.7% ‘premiumize’ our product portfolio (FY11)
17.3%
16.6% 17.0% 16.9% 16.9% 17.2%
• Continued expansion of international business
(ongoing)
16.2%
15.4% 15.5%
We continue to make investments in working capital to
FY11 FY12 FY13 FY14 FY15 FY16 FY17
A/R as a % of net sales
FY18 FY19 FY20
manage the profitable growth of our business:
• Built up inventories in EU to reduce risk
Inventory as a % of Net Sales
associated with BREXIT (FY19)
• Expect inventory levels to remain slightly elevated
9.6% 10.1%
to support global launch of Smart Straw Next
9.3%
Generation (FY21)
8.7% 8.8% 9.1% 8.5% 8.9%
8.4%
5.2%
FY11 FY12 FY13 FY14 FY15 FY16 FY17 FY18 FY19 FY20
Inventory as a % of net sales
WDFC defines working capital as Accounts Receivable and Inventory Less Accounts Payable and Accrued Liabilities.
Note: In August of FY18 the Company had $6.9 million outstanding in foreign currency forward contracts which matured in September 2018. This amount is reflected in 'Other current assets' and 'Accrued liabilities'
on the Company's balance sheet as of 8/31/18. For the purposes of this working capital calculation, the impact of these foreign currency forward contracts to 'Other current assets' and 'Accrued liabilities' has been
47 removed. We believe this impact of foreign currency forward contracts is highly irregular and not expected to reoccur in the future. We removed it because we do not believe its inclusion appropriately reflects the
Company's use of working capital.Cash Returns to Stockholders
Dividends
• Company has paid dividends without
interruption for over 40 years
• Company has continued to return
capital to stockholders through regular
dividends which are targeted at 50%
of earnings
Share Repurchases
(in millions)
• In April 2020, in response to COVID-19
health crisis, management elected to
suspend purchases under share buy-back
plan in order to preserve cash
• Share buy-back plan expired at the end of
August 2020
• Management does not anticipate seeking
board approval for additional share
repurchases until uncertainty surrounding
the pandemic is reduced
48Guidance
Fiscal Year 2021 Guidance

     • Current market conditions suggest that for fiscal year 2021 total net
       sales are expected to be between $475 million and $490 million
         ‒ Revision to net sales expectations driven primarily by strong sales results
            experienced in the third quarter of fiscal year 2021

     • Due to the uncertainty that the pandemic continues to present, the
       Company is not issuing comprehensive financial guidance for fiscal year
       2021

50
Final Thoughts
Where does our focus need to be?
     •   Continue to live our values and enrich our tribal culture

     •   High levels of employee engagement

     •   Steady sales growth of WD-40 Multi-Use Product across all markets

     •   Sales growth of WD-40 Specialist product line

     •   Innovation and premiumization to support growth

     •   Continued commitment to raising our digital IQ

     •   Maintain gross margin of 55% or greater

     •   Manage cost of doing business as a % of revenue towards 30%

     •   Protect “the power of the shield” and mitigate regulatory impact

52
What are our biggest risks?
• Global volatility, uncertainty, complexity, ambiguity
• Not continuing to live our values or enriching our tribal culture
• Loss of focus – not executing against our strategic drivers or Must-Win Battles
• Not successfully managing the complexity of operating a business that
markets and sells in 176 countries and 62 trade channels
• Misaligned compensation – moving away from ‘pay for performance’
• Not being deliberate and focused – deviating away from best-in-class
products that generate positive lasting memories for our end-users
• Temptation to ‘di-worsify’ – bad capital allocation
• Developing products that need more support than our business model allows
• Targeting end-users that don’t fit our existing distribution model
53Appendix
Foreign Currency Translation Impact or “Constant Currency”

      ($ in millions; except EPS, gross profit and % change)

      Financial Results
      As reported
                                                                          FY20                                FY19                          % Change
           Net Sales                                                     $408.5                             $423.4                                 -4%
           Gross Profit (%)                                              54.6%                               54.9%                               -30 bp
           Operating Income                                               $77.2                               $82.4                                -6%
                                                                                                                         (1)
           Net Income                                                     $60.7                               $55.9                                 9%
                                                                                                                         (1)
           EPS (Diluted)                                                  $4.40                               $4.02                                 9%
      Financial Results
      Constant currency basis                                        FY20 CC(2)                                FY19                          % Change
           Net Sales                                                      $413.4                             $423.4                                -2%
           Operating Income                                                $78.5                              $82.4                                -5%
           Net Income                                                      $62.5                              $55.9 (1)                            12%
           EPS (Diluted)                                                  $4.54                               $4.02 (1)                            13%
      1)    Net income and diluted earnings per share were unfavorably impacted as a result of a reserve for an uncertain tax position recorded in Q4 FY19 in
            the amount of $8.7 million
      2)    FY20 results translated at FY19 foreign currency exchange rates.

56
Non-GAAP Reconciliation
(1) This presentation contains certain non-GAAP (accounting principles generally accepted in the United States of America) measures, that our
management believes provide our stockholders with additional insights into WD-40 Company’s results of operations and how it runs its business. Our
management uses these non-GAAP financial measures in order to establish financial goals and to gain an understanding of the comparative performance
of the Company from year to year or quarter to quarter. The non-GAAP measures referenced in this presentation, which include EBITDA (earnings before
interest, income taxes, depreciation and amortization) and the cost of doing business, are supplemental in nature and should not be considered in isolation
or as alternatives to net income, income from operations or other financial information prepared in accordance with GAAP as indicators of the Company’s
performance or operations. Reconciliations of these non-GAAP financial measures to the WD-40 Company financials as prepared under GAAP are as
follows:
Fiscal Ye ar Ende d August 31,
2020 2019 2018
Total operating expenses - GAAP $ 145,797 $ 149,958 $ 146,659
Amortization of definite-lived intangible assets (2,211) (2,706) (2,951)
Depreciation (in operating departments) (4,095) (3,829) (3,725)
Cost of doing business $ 139,491 $ 143,423 $ 139,983
Net sales $ 408,498 $ 423,350 $ 408,518
Cost of doing business as a percentage of net sales - non-GAAP 34% 34% 34%
EBITDA:
Fiscal Ye ar Ende d August 31,
2020 2019 2018
Net income - GAAP $ 60,710 $ 55,908 $ 65,215
Provision for income taxes 14,805 24,862 9,963
Interest income (93) (155) (454)
Interest expense 2,439 2,541 4,219
Amortization of definite-lived
intangible assets 2,211 2,706 2,951
Depreciation 5,490 4,886 4,849
EBITDA $ 85,562 $ 90,748 $ 86,743
Net sales $ 408,498 $ 423,350 $ 408,518
EBITDA as a percentage of net sales - non-GAAP 21% 21% 21%
Note: Percentages may not aggregate to EBITDA percentage due to rounding and because amounts recorded in other income (expense), net on the Company’s
consolidated statement of operations are not included as an adjustment to earnings in the Company’s EBITDA calculation.
57You can also read