Investor Presentation Cactus, Inc. (NYSE: WHD) November 2019

Page created by Melvin Navarro
 
CONTINUE READING
Investor Presentation Cactus, Inc. (NYSE: WHD) November 2019
Investor Presentation
Cactus, Inc. (NYSE: WHD)
November 2019
Investor Presentation Cactus, Inc. (NYSE: WHD) November 2019
Important Disclosures

Non-GAAP Measures
This presentation includes references to EBITDA, Adjusted EBITDA, Adjusted EBITDA Margin, and EBIT, which are not measures calculated in accordance with accounting principles generally
accepted in the United States of America (“GAAP”). A reconciliation of EBITDA, Adjusted EBITDA and EBIT to net income, the most directly comparable measure calculated in accordance with
GAAP, is provided in the Appendix included in this presentation. While management believes such measures are useful for investors, these measures should not be used as a replacement for
financial measures that are calculated in accordance with GAAP.
Forward-Looking Statements
The information in this presentation includes “forward-looking statements” within the meaning of Section 27A of the Securities Act of 1933, as amended, and Section 21E of the Securities
Exchange Act of 1934, as amended. All statements, other than statements of historical fact included in this presentation, regarding our strategy, future operations, financial position, estimated
revenues and losses, projected costs, prospects, plans and objectives of management are forward-looking statements. When used in this presentation, the words “may,” “hope,” “potential,”
“could,” “believe,” “anticipate,” “intend,” “estimate,” “expect,” “project” and similar expressions are intended to identify forward-looking statements, although not all forward-looking statements
contain such identifying words. These forward-looking statements are based on Cactus’ current expectations and assumptions about future events and are based on currently available information
as to the outcome and timing of future events. We caution you that these forward-looking statements are subject to all of the risks and uncertainties, most of which are difficult to predict and many
of which are beyond our control, incident to the operation of our business. When considering forward-looking statements, you should keep in mind the risk factors and other cautionary statements
described under the heading ‘‘Risk Factors’’ included in our SEC filings. These forward-looking statements are based on management’s current belief, based on currently available information, as
to the outcome and timing of future events. Important factors that could cause actual results to differ materially from those in the forward-looking statements include, but are not limited to: demand
for our products and services, which is affected by, among other things, changes in the price of, and demand for, crude oil and natural gas in domestic and international markets; the level of
growth in the number of rigs, pad sizes, well spacings and associated well count and availability of takeaway capacity; capital spending discipline practiced by customers; the level of fracturing
activity; the size and timing of orders; availability of raw materials; transportation differentials associated with reduced capacity in and out of the storage hub in Cushing, Oklahoma; expectations
regarding raw materials, overhead and operating costs and margins; availability of skilled and qualified workers; potential liabilities such as warranty and product liability claims arising out of the
installation, use or misuse of our products; the possibility of cancellation of orders; our business strategy; our financial strategy, operating cash flows, liquidity and capital required for our business;
our future revenue, income and operating performance; our ability to pay dividends; the termination of relationships with major customers or suppliers; laws and regulations, including
environmental regulations, that may increase our costs, limit the demand for our products and services or restrict our operations; disruptions in the political, regulatory, economic and social
conditions domestically or internationally; import tariffs assessed on products from China or imported raw materials used in the manufacture of our goods in the United States; the significance of
future liabilities under the tax receivable agreement we entered into with certain direct and indirect owners of Cactus LLC in connection with our IPO; a failure of our information technology
infrastructure or any significant breach of security; potential uninsured claims and litigation against us; competition within the oilfield services industry; our dependence on the continuing services of
certain of our key managers and employees; plans, objectives, expectations and intentions contained in this presentation that are not historical; and our ability to successfully remediate any
material weakness in our internal control over financial reporting and disclosure controls and procedures. You are cautioned not to place undue reliance on any forward-looking statements, which
speak only as of the date of this presentation. We disclaim any duty to update and do not intend to update any forward-looking statements, all of which are expressly qualified by the statements in
this section, to reflect events or circumstances after the date of this presentation.
Industry and Market Data
This presentation has been prepared by Cactus and includes market data and other statistical information from third-party sources, including independent industry publications, government
publications or other published independent sources. Some data is also based on Cactus’ good faith estimate. Although Cactus believes these third-party sources are reliable as of their respective
dates, Cactus has not independently verified the accuracy or completeness of this information.
Information Presented
Except as otherwise indicated or required by the context, references in this presentation to the “Company,” “Cactus,” “we,” “us” and “our” refer to (i) Cactus Wellhead, LLC (“Cactus LLC”) and its
consolidated subsidiaries prior to the completion of our IPO and (ii) Cactus, Inc. (“Cactus Inc.”) and its consolidated subsidiaries (including Cactus LLC) following the completion of our IPO on
February 12, 2018. Cactus LLC is our accounting predecessor.

                                                                                                                                                                                                            2
Investor Presentation Cactus, Inc. (NYSE: WHD) November 2019
Executive Team
                          ◼   Mr. Bender has served as President and CEO since co-founding Cactus Wellhead, LLC (“Cactus LLC”) in 2011.
                          ◼   Mr. Bender previously was President of Wood Group Pressure Control from 2000 to 2011.
    Scott Bender          ◼   Mr. Bender successfully built and monetized Ingram Cactus Company (sold to Cameron in 1996) and led Wood Group
   President & CEO            Pressure Control’s profitable expansion until its sale to General Electric in 2011.
                          ◼   Mr. Bender graduated from Princeton University in 1975 with a Bachelor of Science in Engineering and from the
                              University of Texas at Austin in 1977 with a Master of Business Administration.

                          ◼   Mr. Bender has served as Senior Vice President and COO since co-founding Cactus LLC in 2011.
                          ◼   Mr. Bender previously was Senior Vice President of Wood Group Pressure Control from 2000 to 2011.
     Joel Bender
                          ◼   Mr. Bender successfully built and monetized Ingram Cactus Company (sold to Cameron in 1996) and led Wood Group
Senior Vice President &
                              Pressure Control’s profitable expansion until its sale to General Electric in 2011.
Chief Operating Officer
                          ◼   Mr. Bender graduated from Washington University in 1981 with a Bachelor of Science in Engineering and from the
                              University of Houston in 1985 with a Master of Business Administration.

                          ◼   Mr. Bender has served as Vice President of Operations of Cactus LLC since 2011, managing all US service center and
                              field operations.
   Steven Bender
   Vice President of      ◼   Mr. Bender previously was Rental Business Manager of Wood Group Pressure Control from 2005 to 2011.
      Operations
                          ◼   Mr. Bender graduated from Rice University in 2005 with a Bachelor of Arts in English and Hispanic Studies and from the
                              University of Texas at Austin in 2010 with a Master of Business Administration.

                          ◼   Appointed Vice President, Chief Financial Officer & Treasurer, on March 15, 2019.
                          ◼   Mr. Tadlock previously served as Vice President and Chief Administrative Officer since March 2018, and has also served
   Steve Tadlock
                              as VP of Corporate Services since June 2017. He has worked with Cactus LLC since its founding in 2011 as a Board
 Vice President, Chief        observer.
  Financial Officer &
                          ◼   Mr. Tadlock previously worked at Cadent Energy Partners, where he served as a Partner from 2014 to 2017.
       Treasurer
                          ◼   Mr. Tadlock graduated from Princeton University in 2001 with a Bachelor of Science in Engineering and from the
                              Wharton School at the University of Pennsylvania in 2007 with a Master of Business Administration.

                          ◼   Mr. Isaac has served as Vice President of Administration and General Counsel since September 2018.
     David Isaac          ◼   Mr. Isaac previously worked at Rockwater Energy Solutions, Inc. and most recently served as Senior Vice President of
   Vice President of          Human Resources and General Counsel.
  Administration and      ◼   Mr. Isaac previously was the Vice President of Human Resources and General Counsel of Inmar, Inc.
   General Counsel        ◼   Mr. Isaac graduated from The College of William & Mary in 1983 with a Bachelor of Arts in Economics and from The Ohio
                              State University in 1986 with a Juris Doctor.

                                                                                                                                                       3
Investor Presentation Cactus, Inc. (NYSE: WHD) November 2019
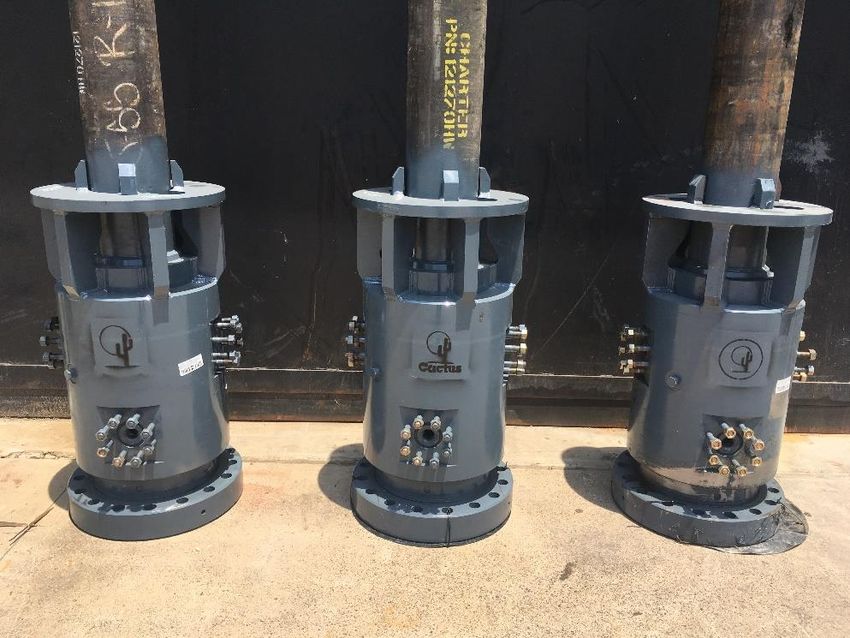
Investment Highlights

       A Leading Pure Play Wellhead and Pressure Control
  1    Equipment Solutions Provider for Onshore Activity

       Innovative and Differentiated Products with
  2    Presence Across Various Geographies

                                                             Consistent
  3    Dynamic Manufacturing Capabilities                      Market
                                                           Outperformance

       Returns Focused with Substantial Cash Flow
  4    Generation and Regular Quarterly Dividend

       Experienced Management Team with Significant
  5    Equity Ownership & Strong Industry Relationships

                                                                            4
Investor Presentation Cactus, Inc. (NYSE: WHD) November 2019
Company Overview
                Cactus designs, manufactures, sells and rents highly engineered products which yield
                      greater pad drilling and completions efficiencies while enhancing safety
      LTM Q3 2019 Revenue by Type                                                             Revenue ($ in millions)

                                                                                                                                                                                                                                                  $628.0
                                                                                                                                                                                                                  $544.1
                                                                                                                                                                                                                                                 Q3 2019
                          Field                                                                                                                                                                                                                   $160.8
                         Service                                                                                                                                                 $341.2
                                                                                                                                                                                                                                                   9 mos.
                           and                                                                                  $221.4                                                                                                                             ended
                          Other                                                                                                                  $155.0
                                                                                                                                                                                                                                                 6/30/2019
                          21%                                                                                                                                                                                                                      $467.2

                                               Product                                                            2015                            2016                             2017                            2018                      LTM Q3 2019
                   Rental                       56%                                                         33.4%              37.1%
                    23%                                                                        Adjusted EBITDA(1) ($ in millions)
                                                                                                            Margin             Margin

                                                                                                                                                                                                                                                  $234.1
                                                                                                                                                                                                                 $212.6
                                                                                                                                                                                                                                                 Q3 2019
                                                                                                                                                                                                                                                  $58.8
                                                                                                                                                                                 $112.1                                                           9 mos.
                                                                                                                 $63.1                                                                                                                            ended
                                                                                                                                                 $32.2                                                                                          6/30/2019
     *Product Revenue Includes Drilling and Production
                                                                                                                                                                                                                                                  $175.3
                     Consumables
                                                                                                                 2015                             2016                            2017                             2018                      LTM Q3 2019
     Selected Active Basins                                                                 Adj. EBITDA(1)
                                                                                            as % of        28.5%                                  20.8%                            32.9%                           39.1%                           37.3%
    ◼    Bakken                           ◼    DJ / Powder                                  Revenue
                                               River                                           Adjusted EBITDA(1) – Net Capital Expenditures(2) as % of Revenue
    ◼    Eagle Ford                       ◼    Marcellus /
                                               Utica                                                                                                                                                              26.5%                           29.1%
                                                                                                                                                                                 23.9%
                                                                                                                17.9%
    ◼    Permian                          ◼    SCOOP /                                                                                            9.6%
                                               STACK
              ◼     Cooper, Australia                                                                            2015                             2016                            2017                             2018                      LTM Q3 2019

Source: Company filings.
1)    EBITDA and Adjusted EBITDA are non-GAAP financial measures. Cactus defines Adjusted EBITDA as EBITDA excluding (gain) loss on debt extinguishment, stock-based compensation, non-cash adjustments for the revaluation of the liability related to the tax receivable   5
      agreement. and equity offering expenses. The Appendix at the back of this presentation contains a reconciliation of EBITDA and Adjusted EBITDA to net income, the most comparable financial measure calculated in accordance with GAAP.
2)    Net Capital Expenditures equals net cash flows from investing activities.
Investor Presentation Cactus, Inc. (NYSE: WHD) November 2019
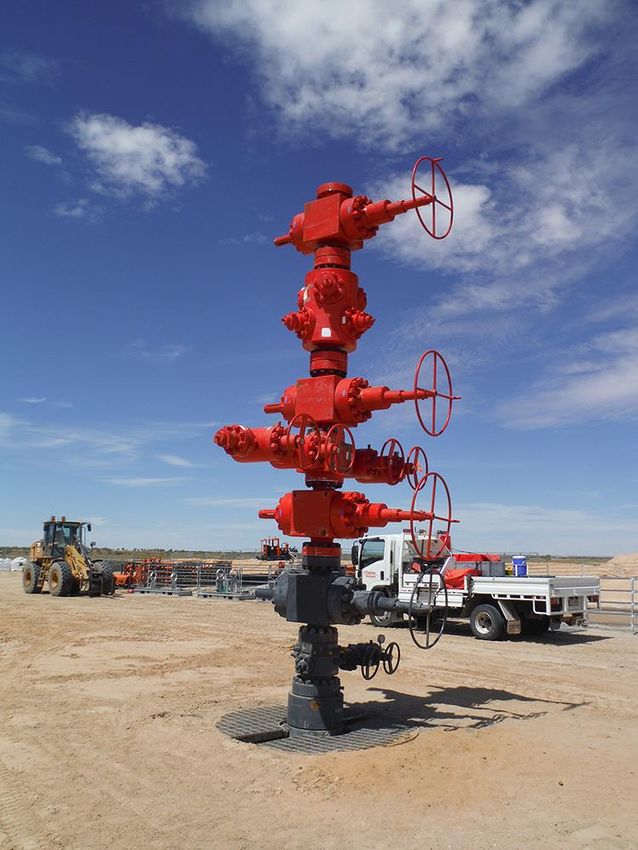
Proprietary Equipment Across Drilling, Completion, and
Production Phases of a Well
Technologically advanced wellhead and frac solutions deliver greater reliability and time savings
◼   Designed for pad drilling and intense completion environments

◼   Principal products: SafeDrill® wellheads, frac related rentals and production trees

◼   Time savings can exceed 30 hours of rig time per well

            Drilling                        Completion (Frac)                             Production

    Consumable Sale                        Temporary Rental                      Consumable Sale

               Cactus Also Provides Field Service, Installation & Maintenance
                                                                                                       6
Investor Presentation Cactus, Inc. (NYSE: WHD) November 2019
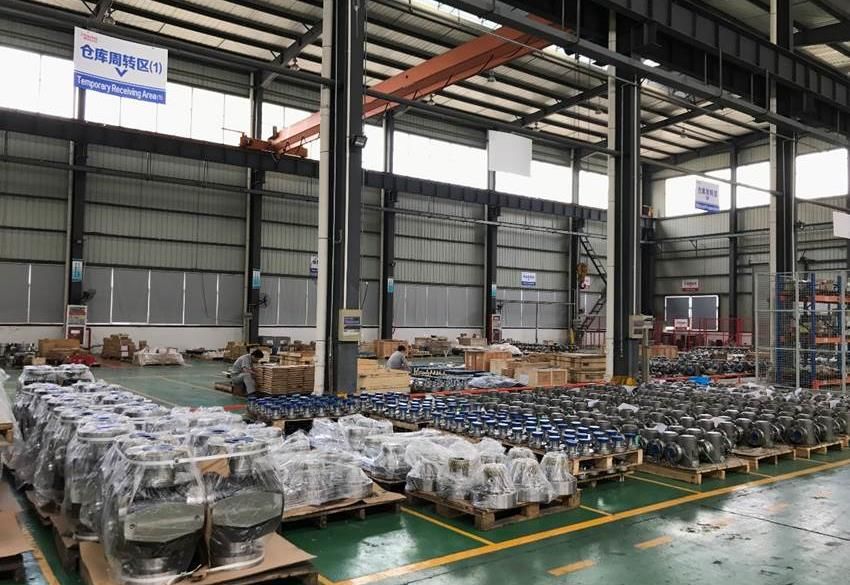
Market Leader with Strong Growth
      Historical U.S. Onshore Market Share(1)

 400                                                                                                                                                                                                                                                                            35.0%

 350                                                                                                                                                                                                                                              29.3%          29.7%
                        Cactus Rigs Followed                                                                                                                                                                                       28.2%                                        30.0%

                                               (1)
                                                                                                                                                                                                    27.0%          26.6%
                        Market Share                                                                                                                                                                                                295
 300                                                                                                                                                                                 24.4%
                                                                                                                                                                                                                     275                            276                         25.0%

                                                                                                                                                                      21.5%                           245                                                          247
 250
                                                                                                                                                                                       220                                                                                      20.0%
                                                                                                                                                       17.5%
 200
                                                                                                           179
                                                                                                                         14.4%          14.5%
                                                                                            158                                                                                                                                                                                 15.0%
 150
                                                                                                                                                                        129
                                                                             119                                          119
                                                              100                                                                         99                                                                                                                                    10.0%
 100                                                                                                      9.8%
                                                75                                         8.9%                                                           68
                                47                                          7.0%                                                                                                                                                                                                5.0%
  50                                                         5.9%
                                             4.3%
                 15
                              2.5%
               0.8%
      0                                                                                                                                                                                                                                                                         0.0%
              Dec-11         Jun-12         Dec-12         Jun-13         Dec-13          Jun-14        Dec-14          Jun-15         Dec-15         Jun-16         Dec-16         Jun-17         Dec-17          Jun-18         Dec-18         Jun-19         Oct-19
 U.S.
Onshore
 Rigs

 Source: Baker Hughes Rig Count Data, as published on the Friday on or immediately preceding the 15th day of each month presented, and Cactus analysis.

 1)       Represents the number of active U.S. onshore rigs Cactus followed divided by the total number of active U.S. onshore rigs, as of mid-month. The number of active U.S. onshore rigs Cactus followed represents the approximate number of active U.S. onshore drilling
          rigs to which Cactus was the primary provider of wellhead products and corresponding services during drilling, as of mid-month. Cactus believes that comparing the total number of active U.S. onshore rigs to which it is providing its products and services at a given
          time to the total number of active U.S. onshore rigs on or about such time provides Cactus with a reasonable approximation of its market share with respect to its wellhead products sold and the corresponding services it provides.

                                                                                                                                                                                                                                                                                        7
Investor Presentation Cactus, Inc. (NYSE: WHD) November 2019
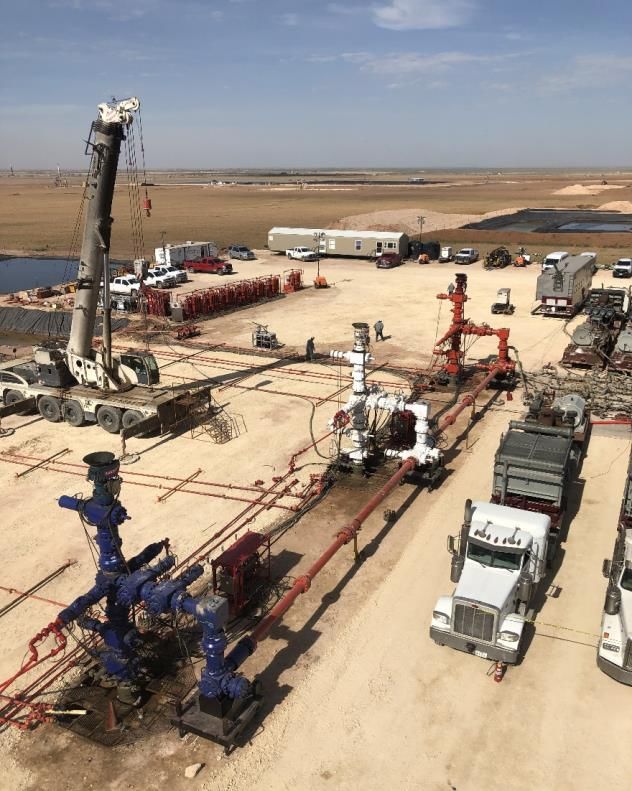
Historical Margin Sustainability Through the Cycle
       Historical Adjusted EBITDA Margins (2014 – YTD 2019) (1)(2)                                                                                  Adjusted EBITDA Margin (2014 – YTD 2019) (1)(2)

                                                                                                                                                     35%          34%
          40%

                                                                                                                                                     30%
          30%

                                                                                                                                                                               25%
                                                                                                                                                     25%                                    23%          23%
          20%                                                                                                                                                                                                        22%

                                                                                                                                                     20%
          10%

                                                                                                                                                                                                                                  15%
                                                                                                                                                     15%                                                                                       14%
                                                                                                                                                                                                                                                            13%
            0%
                                                                                                                                                                                                                                                                         11%
                                                                                                                                                     10%
        (10%)

                                                                                                                                                       5%

        (20%)
                           2014              2015               2016               2017               2018          YTD 2019
                                                                                                                                                       0%
                             WHD                  Peer A               Peer B                Peer C               Peer D                                          WHD Peer A Peer B Peer C Peer D Peer E Peer F Peer G Peer H
                             Peer E               Peer F               Peer G                Peer H

             Strength of margin profile relative to peers maintained through the cycle
Source: Factset, Company filings.
1)    Peer data represents Adjusted EBITDA where available per company filings and presentations. Peers include: Apergy, Dril-Quip, Forum Energy Technologies, Gardner Denver, Hunting, National Oilwell Varco, Oil States International, Schoeller-Bleckmann. Cactus’
      computation of Adjusted EBITDA may not be comparable to other similarly titled measures of other companies.
2)    Cactus data represents Adjusted EBITDA, defined as EBITDA excluding (gain) loss on debt extinguishment, stock-based compensation, non-cash adjustments for the revaluation of the liability related to the tax receivable agreement, and equity offering expenses. The   8
      Appendix at the back of this presentation contains a reconciliation of EBITDA and Adjusted EBITDA to net income, the most comparable financial measure calculated in accordance with GAAP. Adjusted EBITDA Margin is defined as Adjusted EBITDA expressed as a
      percentage of Revenue. YTD 2019 represents through 3Q 2019 for Cactus, Apergy, Dril-Quip, Forum Energy Technologies, Gardner Denver, National Oilwell Varco, and Oil States International and through 2Q 2019 for Hunting and Schoeller-Bleckmann.
Investor Presentation Cactus, Inc. (NYSE: WHD) November 2019
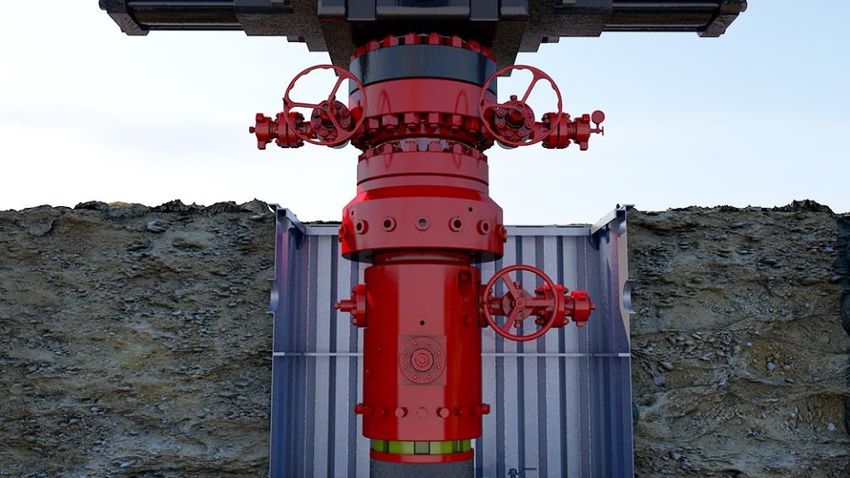
Technologically Advanced Pad Drilling Wellhead Systems
 Cactus SafeDrill®                 SafeDrill® Advantages

                                           Safety                  Time Savings
                                    Fewer trips into            Eliminates time
                                     confined space (cellar)      consuming BOP
                                     -                            manipulation

                                    No BOP manipulation  No waiting on cement
                                     after intermediate           after running casing
                                     casing has been              strings
                                     installed                    -
 Conventional Wellhead
                                    No “hot work” required  Mandrel hangers, pack
                                     to cut casing with torch     offs run and set through
                                                                  BOPs

                                                                                             9
Investor Presentation Cactus, Inc. (NYSE: WHD) November 2019
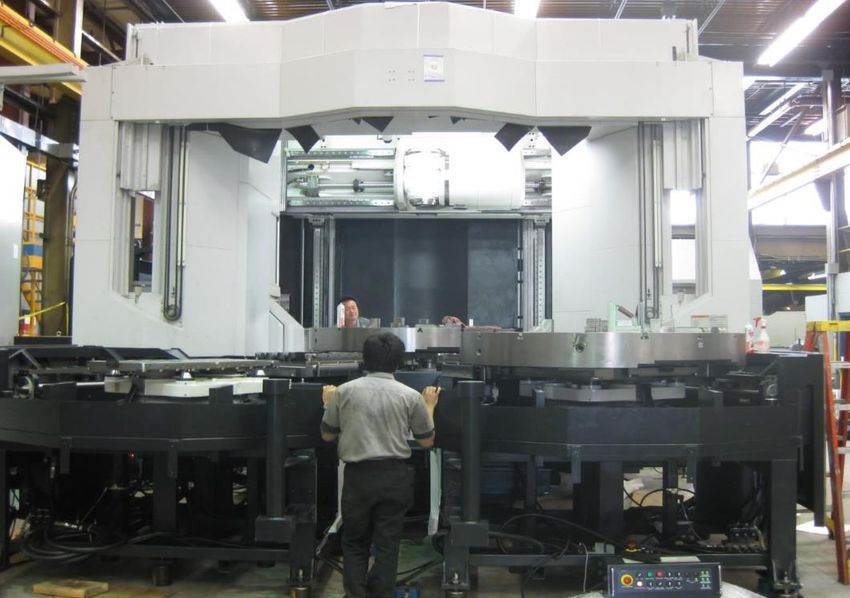
Well Counts and Pad Drilling Drive Our Product Business

 Operations & Trends                                                                          % of Wells Drilled on a Pad (Delaware Basin)
 ◼   Well-diversified across all key producing basins                                         Pct
                                                                                               100%
                                                                                                                                         2019 YTD Marcellus: 93%
 ◼   Service centers support field services and provide repair                                                                         2019 YTD U.S. Land Avg: 77%
                                                                                                                                                                         73%
     services                                                                                   75%                                                         67%
                                                                                                                                                58%

 ◼   Products best suited for multi-well pads                                                   50%                               40%
                                                                                                                         35%
                                                                                                           22%
 ◼   Operators still shifting toward pad drilling and larger pads                               25%
     in key basins
                                                                                                    0%
                                                                                                           2014          2015     2016          2017        2018       YTD 2019
                                                                                                 Source: Barclays Research.

 Map of Operations                                                                            Average Pad Size (Delaware Basin)
                       United States                                  China
                                                                                              Avg. Pad Size
                                                                                              5.0
           Bakken
                         Bossier City, Louisiana                                              4.5
            Powder       Manufacturing Facility                                                                                        2019 YTD Marcellus: 4.1
             River
             Basin                                  Marcellus                                 4.0

                                                   Utica                                      3.5
                                                                                                                                      2019 YTD U.S. Land Avg: 3.3
        DJ / Niobrara                                                  Suzhou, China
               SCOOP / STACK                                                                  3.0
                                                                     Manufacturing Facility
                                                                                                                                2.4           2.5         2.5          2.5
        Delaware
                                                                      Australia               2.5        2.2          2.2
                       Barnett
             Midland        Haynesville                                                       2.0
                                 Gulf Coast                                                              2014         2015      2016         2017        2018        YTD 2019
               Eagle Ford

                                                                                                 Source: Barclays Research.
                                   Manufacturing   Service Centers
                                   Headquarters    Oil & Gas Basin
                                                                                                                                                                                  10
Operator Drilling Efficiencies Translate Into More Wells
Drilled Per Rig
U.S. Drilling Days Per 1,000 Lateral Foot
Days

       7.1
             7.0

                   6.4 6.4

                               5.4 5.5 5.4 5.3

                                                 4.7 4.8
                                                           4.6 4.6

                                                                     4.1 4.0 4.0
                                                                                 4.0

                                                                                       3.3 3.3 3.2
                                                                                                     3.1
                                                                                                           3.0         2.9 2.9
                                                                                                                 2.7             2.7 2.7 2.7 2.8 2.7 2.6
                                                                                                                                                           2.4
                                                                                                                                                                 2.2
                                                                                                                                                                       2.0

  Source: Barclays Research.

                                                                                                                                                                             11
Cactus Generating More Revenue Per Rig Followed
 Drivers For Increased Revenue Per Rig                                                                                         Cactus Product Revenue Per U.S. Onshore Rig Followed(1)
                                                                                                                                   (Data Indexed to 100)
     ◼    Increased rig efficiencies
                                                                                                                                                                                                                                                                       178
                   ◼     E&Ps drilling more wells per rig
                         operated
                                                                                                                                                                                                                                                          165
                   ◼     Lateral lengths stabilizing

     ◼    Sale of higher-end wellhead systems

                   ◼     Shift to higher-pressure wells requires                                                                                                                                                                             144
                         higher value equipment                                                                                                                                                                        139
                                                                                                                                                                                                          137
                                                                                                                                                                                                                                  134
     ◼    Customer utilization of additional features

                   ◼     E&Ps continue to value additional time-
                         saving features                                                                                                                                         120

     ◼    Evolution in artificial lift                                                                                                                              112
                                                                                                                                                                                              116
                                                                                                                                                        106
                   ◼     Customer preference to utilize multiple
                                                                                                                                           100
                         forms of artificial lift during a well life-
                         cycle increases product sales
                                                                                                                                          1Q17         2Q17        3Q17         4Q17        1Q18         2Q18         3Q18        4Q18         1Q19        2Q19         3Q19

1)       Revenue per rig followed represents total company Product revenue divided by rigs followed, which represents the average number of active U.S. onshore rigs Cactus followed (which Cactus defines as the number of active U.S. onshore drilling rigs to which it was the
                                                                                                                                                                                                                                                                                    12
         primary provider of wellhead products and corresponding services during drilling) as of mid month for each of the three months in the applicable quarter.
Small Expenditures Can Have a Big Impact on Operators

     Cactus Value Proposition                        Components of Onshore Well Costs(1)

     ◼   Cactus offerings make up a
                                                                 Other
         relatively small portion of the overall                 15%

         cost to drill & complete a well
                                                                                           Completion
     ◼   Efficiency and reliability can cause a                                              54%

         disproportionate amount of benefit
         for operators

     ◼   Operators willing to reward high-         Drilling
                                                    29%
         quality equipment and service

                                                           Cactus        Cactus
                                                          Products       Rentals
                                                             1%            1%

                                                                                                   13
1)    Source: EIA and Management estimates.
Focus on Completions Efficiency Drives Our Rental
Business

◼   Growth opportunity for Cactus

◼   Priced on per diem basis

       ◼   More wells per pad and/or stages per well
           generally translates into more rental equipment
           on location for greater periods of time

◼   Proprietary rental equipment offerings enhance
    wellsite efficiency and generate attractive paybacks

◼   Deploying recent innovations of complementary rental
    items to reduce human intervention during completions
    process to save time and enhance safety

◼   Expanded capacity of legacy rental equipment in 2018
    and continuing to add to equipment fleet in 2019 with
    emphasis on expanding fleet of recent innovations

◼   Ability to quickly scale capital expenditures up or down
    based on market demand

                                                               14
Recent Innovations Strengthen Moat in Rental Business
    Complement & enhance legacy rental offerings while requiring no additional personnel
◼   Designed to significantly reduce non-productive time by increasing reliability and automation
◼   Increases safety by removing personnel from the exclusion zone
◼   SafeLinkTM
        ◼ Singular & continuous large bore connection between missile and multiple frac trees
        ◼ Minimal space required
        ◼ Reduces rig-up/down time, leaks and maintenance that cause NPT
◼   SafeInjectTM
                                                                                                    SafeClamp®
        ◼ Remotely operated method to perform frac tree maintenance and
                                                                                     SafeInjectTM
          collect valuable data at wellsite
        ◼ Efficient maintenance technique eliminates need for personnel to
          enter exclusion zone
◼   SafeClamp®
        ◼ Reliable method to connect the wireline lubricator to the frac tree
          without the need for human intervention within the exclusion zone
        ◼ Reduces NPT associated with transition between wireline and frac
          operations

                    Legacy Setup                              SafeLinkTM

                                                                                                     SafeLinkTM
                                                                                                                  15
A Dynamic Manufacturing Advantage; Responsive,
Highly Scalable and Lower Cost
Responsive manufacturing in the U.S. supplemented by high volume production in China
Bossier City Facility                                                                         Suzhou Facility

◼ Facilityhas 16 5-axis computer numerically             ◼ Cactussources most of its less time-sensitive, high-
  controlled machines that facilitate rapid-response      volume wellhead equipment in Suzhou, reducing
  manufacturing of equipment; two machines installed      costs
  in 2019
                                                         ◼ Wholly   foreign owned enterprise (WFOE)
◼ “Just-in-time”  product capabilities allow Cactus to
  offer fast delivery time for parachute orders          ◼ Expanded    in 2017 with ample capacity

◼ Roofline   expansion completed in 2018                 ◼ Continue to increase product types assembled and
                                                          tested in Suzhou

                                                                                                                  16
Highly Experienced and Well Incentivized Team with
Strong Industry Relationships
  ◼   Management team is well incentivized as it owns more than 25% of the business
  ◼   Management team has built the foundation of this company over four decades
  ◼   Track record of building and successfully monetizing similar businesses
  ◼   Strength of leadership is attested by management and operating teams that joined from past
      ventures                                                                        Current

   1959     1975            1980            1985             1990         1995           2000         2005              2010              2018

                                                                    ICC sold to
                               Joel Bender                                                                        Scott Bender
                                                                    Cooper Cameron                                                    Cactus, Inc.
                               appointed Vice                                                                     leaves WGPC
                                                                    Corporation                                                       IPO (2018)
                               President of                                                                       (2010)
                                                                    (1996)
                               CWE (1984)

            Scott Bender
            appointed
            President of              CWE Merges with Ingram
  Cactus    Cactus                    Petroleum Services, forming            Scott and Joel                          WGPC
                                                                                                  Steven Bender                   Scott and          Cactus, Inc.
  Pipe      Wellhead                  Ingram Cactus                          Bender appointed                        Sold to GE
                                                                                                  appointed                       Joel Bender        initiates
  founded   Equipment                 Company (“ICC”)                        President and SVP,                      Oil and
                                                                                                  Rental                          found              regular
  (1959)    (“CWE”), a                                                       respectively, of                        Gas (2011)
                                      ◼   Scott and Joel Bender                                   Business                        Cactus LLC         quarterly
            subsidiary of                 become President                   Wood Group                                           with 18 key
                                                                                                  Manager of                                         dividend
            Cactus Pipe                   and VP Operations,                 Pressure Control                                     managers
                                                                                                  WGPC (2005)                                        (2019)
            (1977)                        respectively, of                   (“WGPC”)                                             (2011)
                                          ICC (1986)

                                                                                                                                                                    17
Well Established Relationships with High-Quality Customer Base
     3Q 2019 YTD Total Revenue by                                                             3Q 2019 YTD Product Revenue by            3Q 2019 YTD Rental Revenue by
     Customer Type                                                                            Customer Type                             Customer Type

                                         Other            Majors                                                 Other Majors
                                          1%                                                                      1%    2%                     Private
              Private                                      10%                                         Private                                  13%
               18%                                                                                      20%                                                             Majors
                                                                                                                                                                         27%
                                                                                                                                        SMID
                                                                                                                                        E&P
                                                                                                                                        11%

     SMID
                                                                                                SMID
     E&P
                                                                                                E&P
     15%
                                                                                                18%

                                                                        Large                                                   Large                               Large
                                                                         E&P                                                     E&P                                 E&P
                                                                         56%                                                     59%                                 49%

          Majority of customer base represented by larger, well capitalized operators

                                                                                                                                                                                 18
Note: Large E&P represents companies with enterprise value of over $5bn as of November 8, 2019 per FactSet.
Returns & Margins Have Outperformed Peers
 Adjusted EBITDA Margin (%)

   40.0%
                                                                                                                                                                                                          (1)

   30.0%                                                    NCSM

                                                         SBO

   20.0%
                                                                                        FTI
                                                 OIS

                                                                    WEIR

                                    NOV
                                           FET
                                             HTG

   10.0%

                                                                                                                                                                                                                              ROCE(2)
      0.0%                                                                         DRQ                                                                                                                                 (2015 – YTD 2019) (%)
         (10.0%)                                   0.0%                                10.0%                                20.0%                                30.0%                                40.0%

Source: Company filings and Factset.
Note: Adj. EBITDA Margins as of 3Q 2019 for WHD, APY, DRQ, FET, GDI, NOV, and OIS, as of 2Q 2019 for SBO, and as of 1H 2019 for HTG. Cactus’ computation of Adjusted EBITDA may not be comparable to other similarly titled measures of other companies.
1)     Cactus EBIT = Adjusted EBITDA – depreciation and amortization. The Appendix at the back of this presentation contains a reconciliation of Adjusted EBITDA to net income, the most comparable financial measure calculated in accordance with GAAP.   19
2)     ROCE reflects weighted average of 2015, 2016, 2017, 2018, and YTD 2019 ROCEs. YTD 2019 represents 9M 2019 for WHD, APY, DRQ, FET, GDI, NOV, and OIS and 1H 2019 for SBO and HTG. ROCE = (Adj. EBITDA less D&A) / (Average of the subject year and
       preceding year capitalization including capital leases).
Compelling Value Opportunity in Relation to Select
   Industrial Companies
       Better Margins…                                                                               …Returns…                                                                                    …And Growth…

                            Avg. EBITDA Margin                                                                                  ROCE                                                                          Consensus Revenue Growth
                             (2015 - YTD 2019)                                                                           (2015 - YTD 2019) (1)                                                                    (2018 - 2020E) (2)
                                                                                                           37%                                                                                          13%
             34%
                                                                                                                                                                                                                  8%       7%       6%      5%
                     24%                                                                                                                                                                                                                             3%       1%
                              19%     19%                                                                          20%
                                               16%                                                                          17%
                                                       15%      14%                                                                  15%      14%
                                                                        13%
                                                                                 11%                                                                   10%      10%
                                                                                                                                                                          8%                                                                                          (6%)
                                                                                                                                                                                   5%

                                                                                                                                                                                                                                                                              (15%)

        … At a Lower Valuation Compared to Other Companies in the Industrial & Flow Control Industries

                                                                                       Enterprise Value / Consensus 2019E EBITDA                                                          (3)

                                                   20.1x

                                                                               17.4x
                                                                                                           16.0x
                                                                                                                                       14.1x                       13.5x                        13.5x
                                                                                                                                                                                                                          12.7x
                                                                                                                                                                                                                                                      11.8x
                         9.4x

                        WHD                    Company C                   Company A                   Company F                  Company G                    Company E                  Company H                    Company B                  Company D
Source: Factset, Company filings and presentations. Consensus estimates as of 11/8/2019 per Factset. Companies include: Badger Meter, CIRCOR, Flowserve, Franklin Electric, Rotork, SPX Flow, Thermon Group, and Weir Group.
Note: Thermon financial data compares fiscal March 31 year-end to the nearest comparable calendar year. Cactus’ computation of Adjusted EBITDA may not be comparable to other similarly titled measures of other companies. The Appendix at the back of this presentation
contains a reconciliation of Adjusted EBITDA to net income, the most comparable financial measure calculated in accordance with GAAP.
1)     ROCE reflects weighted average of 2015, 2016, 2017, 2018, and YTD 2019 ROCEs. YTD 2019 represents 9M 2019 data where available, or the latest quarterly or semi-annual data. ROCE = (Adj. EBITDA less D&A) / (Average of the subject year and preceding year
       capitalization including mezzanine equity, unfunded pension liabilities and capital leases). Adj. EBITDA may not be available for all companies. Cactus computation of ROCE may not be comparable to other similarly titled measures of other companies.
2)     2018 revenue data pro forma for divestitures where available.
3)     Enterprise Value represents market capitalization, less cash and short-term investments, plus debt, unfunded pension liabilities, capital leases and other items. Cactus market capitalization utilizes total shares outstanding and Enterprise Value does not include non-    20
       controlling interest related to Class B shares or liability related to the tax receivable agreement. Cactus computation of Enterprise Value may not be comparable to other similarly titled measures of other companies.
Clean Balance Sheet & Low Capital Intensity
                                Strong balance sheet with track record of cash flow generation
                                                                                                                                           Adjusted EBITDA(1) – Net Capital Expenditures(2) ($ in
                       Balance Sheet & Capital Summary                                                                                     millions)
          ◼     September 30, 2019 cash balance of $167.5
                                                                                                                                                                                                                                                             $182.6
                million; no borrowings on revolving credit facility
          ◼     Full availability of $75.0 million asset-based                                                                                                                                                                       $144.4

                revolving credit facility ($50.0 million accordion)
          ◼     Liquidity and strong cash flows support future                                                                                                                                               $81.4
                growth
          ◼     Disciplined growth and financial prudence                                                                                                  $39.7

                                                                                                                                                                                    $14.8
          ◼     Ability to quickly scale back growth capital
                expenditures                                                                                                                                2015                     2016                    2017                     2018               LTM Q3 2019

                        ◼     Minimal maintenance capex                                                                                    Net Capital Expenditures(2) ($ in millions)

          ◼     Full year 2019 estimated net capital expenditures                                                                                                                                                                   $68.2
                                                                                                                                                                                                                                  $68.2                       $65.6
                of $50 - $55 million
                                                                                                                                                                                                                                                           $51.5
                        ◼     Down from initial guidance of $60 - $65
                              million                                                                                                                                                                       $30.7
                                                                                                                                                                                                          $30.7
                                                                                                                                                          $23.4
                                                                                                                                                        $23.4
                                                                                                                                                                                   $17.4
                                                                                                                                                                                 $17.4
                        ◼     Majority directed toward rental
                              opportunities with increasing emphasis on
                              expansion of recent innovation fleet                                                                                         2015                     2016                    2017                     2018               LTM
                                                                                                                                                         2015                     2016                    2017                     2018               LTM Q3Q2 2019
                                                                                                                                                                                                                                                             2019

Source: Company filings.
1)    EBITDA and Adjusted EBITDA are non-GAAP financial measures. Cactus defines Adjusted EBITDA as EBITDA excluding (gain) loss on debt extinguishment, stock-based compensation, non-cash adjustments for the revaluation of the liability related to the tax receivable   21
      agreement, and equity offering expenses. The Appendix at the back of this presentation contains a reconciliation of EBITDA and Adjusted EBITDA to net income, the most comparable financial measure calculated in accordance with GAAP.
2)    Net Capital Expenditures equals net cash flows from investing activities.
Continued Outperformance in 2019
  Third Quarter Performance
 ◼   Product revenue continued to outperform the
     trajectory of the U.S. onshore rig count
 ◼   Improved margins in Rental business despite reduced
     completion activity from customers
 ◼   Increased cash position by over $36mm during the
     quarter

  Outlook
 ◼   Q4 2019 revenues expected to be down sequentially
     ◼   Product revenues impacted by reduced industry
         drilling activity and demand for production trees
     ◼   Rental revenue driven by level of completions activity
         onshore in North America with some offset from
         recent rental innovations
 ◼   Product margins impacted by Section 301 tariffs,
     although likely able to offset a large portion of these
     cost increases
 ◼   Recent innovations expected to represent increasing
     portion of Rental revenue over coming quarters
 ◼   Cautious regarding E&P spending toward the end of the
     year given expected budget exhaustion                        22
Additional Growth Avenues with Modest Capital
Requirements

◼   Product
      ◼   Continued market share gains
      ◼   Continued gains in rig efficiency (wells drilled
          per rig)
      ◼   New features and technology for wellhead
          systems
      ◼   Shift to higher pressure wellhead systems
◼   Rental
      ◼   Continued deployment of recent rental
          innovations
      ◼   Introduction of additional completion
          technologies currently in development
◼   Other
      ◼   Growth in Australian business
      ◼   Expansion into new international markets

                                                             23
Appendix
Company Organizational Structure
     Company Profile                                                                                       Organizational Structure (1)

        Ticker                                                                                WHD (NYSE)
        Class A Shares Outstanding                              (1)                           47.1mm
                                                                                                                       CW Unit                                             Public
        Class B Shares Outstanding                              (1)                           28.0mm                   Holders                                           Investors
        Total Shares Outstanding                         (1)                                  75.1mm
        Market Capitalization                    (2)                                          ~$2.3bn                          Class B Common Stock           Class A Common Stock
                                                                                                                                (37.3% voting power)           (62.7% voting power)

        Debt & Finance Leases (3)                                                             $12.7mm
                                                                                                                                              Cactus, Inc.
        Cash and Cash Equivalents                              (3)                            $167.5mm
                                                                                                                                             (NYSE: WHD)
        Quarterly Dividend Per Share                                                          $0.09
                                                                                                                      28.0mm CW Units           47.1mm CW Units
        Annual Dividend Yield                     (2)                                         1.2%                 (37.3% economic rights)   (62.7% economic rights)

                                                                                                                                       Cactus Wellhead, LLC
     Ownership Profile (4)                                                                                                             (operating subsidiary)
                     Cadent Energy Partners
                             11%                                                                                                                       100%

                                                                                                                                              Subsidiaries
                      Management &
                       Employees
                          26%                                                          Float
                                                                                       63%

                                   Class A & Class B Shareholders Have Equal Voting Rights
Source: Company filings.
1.    As of November 8, 2019. Excludes effect of dilutive securities.
2.    As of November 8, 2019 utilizing total shares outstanding.                                                                                                                      25
3.    As of September 30, 2019; debt not inclusive of operating leases.
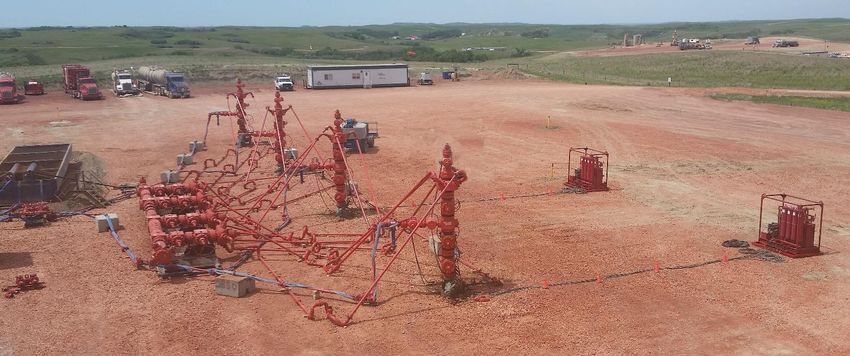
4.    As of November 8, 2019. Management and employees made up of Cactus WH Enterprises and Lee Boquet.
Cactus Equipment Positioned on a 4-Well Pad

                                                                                                                           1

                                                                       2

                                                                                                      4
             4

                      3

                                                           4       1

 1       Product Sold        2    Equipment Rented             3    Equipment Rented          4    Services Provided                    Product Sold

 ▪ Wellheads are required    ▪ Frac stacks are                 ▪ Zipper manifolds used        ▪ Variety of equipment to        ▪ Production trees (not
   by each well over           connected to the                  during the                     install and service              pictured above) are
   production life             wellhead for the                  fracturing process             pressure control                 installed on the wellhead
                               fracturing phase                                                 equipment, such as               after the frac stacks are
 ▪ One of the first pieces     of a well                       ▪ Allow fracing to               high-pressure flow iron,         removed
   of equipment to                                               seamlessly shift from well     closing units, crane
   be installed              ▪ Must reliably withstand           to well without                trucks, grease units and       ▪ Manage the production
                               all liquids and proppants         connecting and                 testing units                    flow over the life of the
 ▪ Cactus wellheads            that are pumped                   disconnecting high-                                             well
   installed below surface     downhole                          pressure equipment
                               to fracture

                                                                                                                                                             26
Non-GAAP Reconciliation

                                                      LTM                                          Year Ended                                                         Three Months Ended
      ($ in thousands)                           September 30,         December 31,       December 31,    December 31,          December 31,          September 30,         June 30,     September 30,
                                                     2019                  2018               2017            2016                  2015                  2019                2019           2018
      Net income (loss)                              $163,712              $150,281            $66,547         ($8,176)              $21,224               $35,833             $40,750        $43,648
      Interest expense, net                               (264)               3,595             20,767          20,233                21,837                  (373)                (93)           270
      Income tax (benefit) expense                      26,997               19,520              1,549             809                   784                12,221              10,793          8,215
      EBIT                                             190,445              173,396             88,863          12,866                43,845                47,681              51,450         52,133
      Depreciation and amortization                     36,588               30,153             23,271          21,241                20,580                10,007               9,376          7,841
      EBITDA                                          $227,033             $203,549           $112,134         $34,107               $64,425               $57,688             $60,826        $59,974
      Revaluation of tax receivable agreement             (558)                   --                 --              --                    --                ($558)                  --             --
      Secondary offering related expenses                1,042                    --                 --              --                    --                    --                  --             --
      (Gain) loss on debt extinguishment                     --               4,305                  --         (2,251)               (1,640)                    --                  --             --
      Stock-based compensation                           6,577                4,704                  --            361                   359                 1,689               1,892          1,287
      Adjusted EBITDA                                 $234,094             $212,558           $112,134         $32,217               $63,144               $58,819             $62,718        $61,261

      Revenue                                          $628,000              $544,135           $341,191           $155,048           $221,395             $160,808           $168,493           $150,658
      Adjusted EBITDA Margin                              37.3%                 39.1%              32.9%              20.8%              28.5%                36.6%              37.2%              40.7%

*For the year ended December 31, 2014, we had EBITDA of $88.8 million, representing net income of $59.1 million, excluding net interest expense of $11.2 million, income tax expense of $0.3 million and depreciation
and amortization of $18.2 million. There was no early extinguishment of debt in 2014. Stock-based compensation was $1.3 million in 2014. Adjusted EBITDA was equal to $90.1 million. Revenue was $259.5 million and
Adjusted EBITDA Margin was 34.7%.

Important Disclosure Regarding Non-GAAP Measures

EBITDA and Adjusted EBITDA are not measures calculated in accordance with GAAP. EBITDA and Adjusted EBITDA are supplemental non-GAAP financial measures that are used by
management and external users of our consolidated financial statements, such as industry analysts, investors, lenders and rating agencies. We define EBITDA as net income excluding net
interest, income tax and depreciation and amortization. We define Adjusted EBITDA as EBITDA excluding (gain) loss on debt extinguishment, stock-based compensation, and equity offering
expenses. We define Adjusted EBITDA Margin as Adjusted EBITDA as a percentage of Revenue.

Our management believes EBITDA and Adjusted EBITDA are useful, because they allow management to more effectively evaluate our operating performance and compare the results of our
operations from period to period without regard to financing methods or capital structure, or other items that impact comparability of financial results from period to period. EBITDA and
Adjusted EBITDA should not be considered as alternatives to, or more meaningful than, net income or any other measure as determined in accordance with GAAP. Our computations of
EBITDA and Adjusted EBITDA may not be comparable to other similarly titled measures of other companies. We present EBITDA and Adjusted EBITDA because we believe they provide
useful information regarding the factors and trends affecting our business.

                                                                                                                                                                                                                        27
Investor Relations Contact

              John Fitzgerald
  Director of Corporate Development &
            Investor Relations
               713-904-4655
          IR@CactusWHD.com

                                        28
You can also read