REITWORLD 2019 INVESTOR PRESENTATION - November 2019 - Ventas
←
→
Page content transcription
If your browser does not render page correctly, please read the page content below

REITWORLD 2019
       INVESTOR
       PRESENTATION

November 2019
Forward-Looking Statements: Non-GAAP Financials
This presentation contains “forward-looking statements” within the meaning of Section 27A of the Securities Act of 1933, as amended, and
Section 21E of the Securities Exchange Act of 1934, as amended. These forward-looking statements include, among others, statements of
expectations, beliefs, future plans and strategies, anticipated results from operations and developments and other matters that are not historical
facts. The forward-looking statements are based on management’s beliefs as well as on a number of assumptions concerning future events.
Readers of these materials are cautioned not to put undue reliance on these forward-looking statements, which are not a guarantee of
performance and are subject to a number of uncertainties and other factors that could cause actual events or results to differ materially from
those expressed or implied by the forward-looking statements. The most important factors that could prevent the Company from achieving its
stated goals include, but are not limited to: (a) the ability and willingness of the Company’s tenants, operators, borrowers, managers and other
third parties to satisfy their obligations under their respective contractual arrangements with the Company, including, in some cases, their
obligations to indemnify, defend and hold the Company harmless from and against various claims, litigation and liabilities; (b) the ability of the
Company’s tenants, operators, borrowers and managers to maintain the financial strength and liquidity necessary to satisfy their respective
obligations and liabilities to third parties, including without limitation obligations under their existing credit facilities and other indebtedness; (c) the
Company’s success in implementing its business strategy and the Company's ability to identify, underwrite, finance, consummate and integrate
diversifying acquisitions and investments, including investments in different asset types and outside the United States; (d) macroeconomic
conditions such as a disruption of or a lack of access to the capital markets, changes in the debt rating on U.S. government securities, default or
delay in payment by the United States of its obligations, and changes in the federal or state budgets resulting in the reduction or nonpayment of
Medicare or Medicaid reimbursement rates; (e) the nature and extent of future competition, including new construction in the markets in which
the Company’s senior housing communities and medical office buildings are located; (f) the extent and effect of future or pending healthcare
reform and regulation, including cost containment measures and changes in reimbursement policies, procedures and rates; (g) increases in the
Company’s borrowing costs as a result of changes in interest rates and other factors; (h) the ability of the Company’s tenants, operators and
managers, as applicable, to comply with laws, rules and regulations in the operation of the Company’s properties, to deliver high-quality services,
to attract and retain qualified personnel and to attract residents and patients; (i) the Company’s ability and willingness to maintain its qualification
as a REIT in light of economic, market, legal, tax and other considerations; (j) the ability and willingness of the Company’s tenants to renew their
leases with the Company upon expiration of the leases, the Company’s ability to reposition its properties on the same or better terms in the event
of nonrenewal or in the event the Company exercises its right to replace an existing tenant or manager, and obligations, including indemnification
obligations, the Company may incur in connection with the replacement of an existing tenant or manager; (k) consolidation activity in the senior
housing and healthcare industries resulting in a change of control of, or a competitor’s investment in, one or more of the Company’s tenants,
operators, borrowers or managers or significant changes in the senior management of the Company’s tenants, operators, borrowers or
managers; and (l) the other factors set forth in the Company‘s periodic filings with the Securities and Exchange Commission.

This presentation contains certain non-GAAP financial measures. You can find a reconciliation of these non-GAAP financial measures in the
Investors Relations section of the Company’s website: https://www.ventasreit.com/investor-relations/non-gaap-financial-measures.

                                                                                                                                                            2
Table of Contents

    Executive Summary                    4

    Enterprise Overview                  5

    Senior Housing                   6 - 14

    Building on Strengths           15 - 31

        Office Excellence           15 - 27

        Capital Markets & ESG       28 - 29

        External Growth             30 - 31

    Normalized FFO Considerations       32

                                              3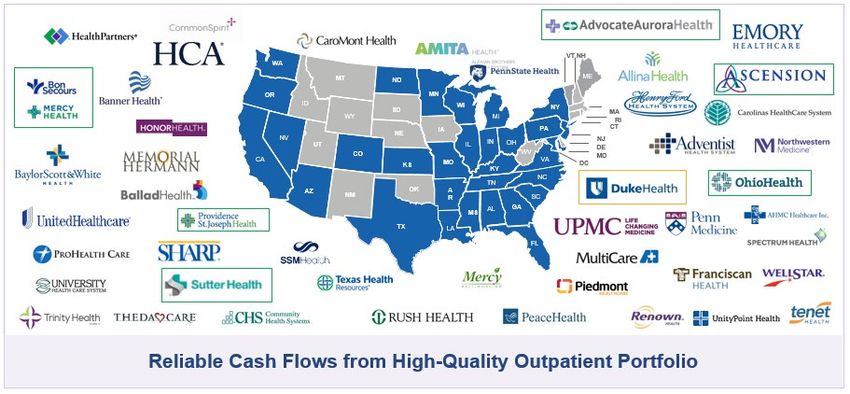
Executive Summary

• Strong enterprise-level results in 3Q driven by diverse portfolio, including robust
  performance in office and accretive investment activity

• Maintained midpoint of our normalized FFO per share guidance, consistent with the
  upper half of the original Feb-19 provided range

• Given challenging market conditions, U.S. SHOP business (25% of NOI) did not
  perform consistent with our expectations in Q3; trends expected to continue in Q4,
  with significant implications for “starting point” for 2020

• Because of senior housing trends, we have concluded that enterprise growth will be
  deferred until after 2020

• $0.91 implied Q4 2019 at midpoint of updated guidance; Q4 2018 ($0.96) annualized
  within 2019 FY normalized FFO per share guidance range

• Will provide 2020 reliable guidance in Q1 2020, with the benefit of additional
  information

• The team is resolute and focused on delivering solid 2019 enterprise results, making
  necessary adjustments and decisions to improve performance, and redoubling our
  efforts to provide the best 2020 possible

                                                                                         4
Enterprise Overview

                                                           International Hospitals 1%
                                                                      Skilled Nursing 1%               Loans

                                                                    IRFs & LTACs
                                                                                                         4%

                                                                                                  7%
                                                     Health Systems

                                                                                   6%
                                                                                                                        33%
                                                                                                                                  Senior Housing
                                                                                                                                   (Operating)

                                                                                                   ~$2B NOI

                                                                                 27%
                                                             Office

                                                                                                               21%

                                                                                                                     Senior Housing
                                                                                                                         (NNN)

                                         Strong enterprise-level results in 3Q driven by diverse portfolio, including robust
                                                     performance in office and accretive investment activity

1: Data per Q3 2019 press release, supplemental, and earnings conference call dated 10/25/2019.
                                                                                                                                                   5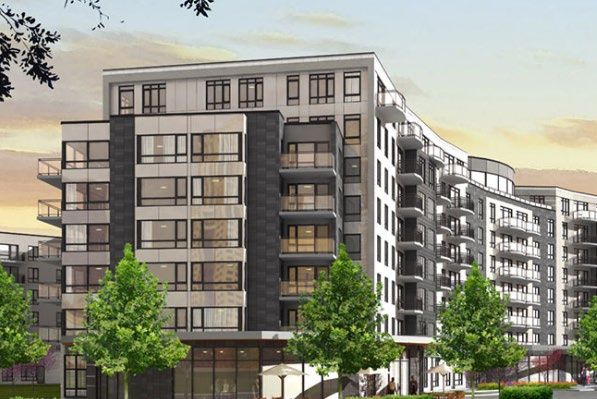
Ventas Senior Housing Situation Assessment

                                                  Senior Housing
                     Operating                                                     NNN
•   Ventas Q3 results within market comparables            •   Well diversified portfolio with rent paying ability
                                                               from significant tenants
•   Dynamic operating conditions during 3Q
                                                           •   ~$10M 2019 net NOI impact from proactively
•   3Q occupancy and RevPOR softened,
    notably in September                                       addressing leases with select lower credit
                                                               operators
•   Q3 trends expected to continue into Q4
                                                           •   2020 carryover for NNN senior housing 2019
•   YoY October occupancy gap widened                          impact nearly double 2019 impact; outside same
    consistent with guidance range provided on                 store
    Q3 earnings call

•   Q3 / Q4 2019 trends have significant                   •   2020 NNN senior housing outlook will be
    implications for 2020                                      predicated on senior housing market
                                                               fundamentals, coverage, credit and portfolio
•   We are resolute and focused on actions to                  performance
    improve our position

•   National leading indicators of supply and
    demand continue to improve, giving us
    confidence in the powerful upside that lies
    ahead

           Given the dynamic senior housing market, we will provide reliable 2020 guidance with
                                         all components in Q1

                                                                                                                     6
Ventas SHOP Results in Context of a Challenging
                    Market

                                                     Q3 2019 Senior Housing Operating SS Cash NOI Growth
                                                                        Year-Over-Year

                                                                                                     13.3%

                                                      2.8%
                                                                                                                                                      (0.8%)

                              VTR                    WELL                     HCP                    SBRA                      SNH                     SNR                     BKD                     CSU

                             (5.0%)
                                                                             (7.4%)
                                                                                                                                                     AL/MC:                   (9.3%)
                                                                                                                                                     (10.0%)

                                                                                                                                                                                                     (15.1%)
                                                                                                                             (17.5%)

                                               Headline results NOT comparable due to multiple material differences in
                                                               methodology, definitions and application

Source: Public filings as of Q3 2019. For HCP, core senior housing same-store performance is shown, which excludes assets in transition. For SNR, total same-store performance was (0.8%) and (10%) for their AL/MC portfolio.
For SBRA, total growth of managed portfolio (including both wholly-owned and Sabra’s share of unconsolidated JV). For FVE, represents performance of leased communities.                                                         7
3Q Occupancy Gap Accelerated in Late
                  September - Particularly in Secondary Markets
                                                              Monthly Same-Store1 VTR SHOP Occupancy

                      VTR US SHOP Portfolio2                                                                                                         VTR US SHOP Trend by Market3

                                                                                                                                 88.5%
88.5%

                                                                                                                                 87.5%
87.5%

                                                                                                                                                                                                                    Secondary
                                                                                                                                                                                                                    markets led
                                                                                     Occupancy                                   86.5%                                                                              occupancy
86.5%
                                                                                     gapped out                                                                                                                      decline
                                                                                        Y/Y in
                                                                                     September
                                                                                      (130bps)
                                                                                                                                 85.5%
85.5%
                                                             (60bps) in
                                                                July                         Q4 Ending Occ
                                                                                             critical to 2020

84.5%                                                                                                                            84.5%
            Jan     Feb Mar          Apr May Jun              Jul     Aug Sep          Oct     Nov Dec                                         Jan        Feb       Mar        Apr        May        Jun      Jul    Aug    Sep

                                       2017             2018             2019                                                                                             Primary              Secondary

                                    VTR US SS YoY RevPOR Growth                                                                                               VTR SS YoY RevPOR Growth by Market
                          1Q19                 2Q19             3Q19                                                                                        1Q19            2Q19             3Q19
National                  0.2%                  0.4%            0.3%                                                           Primary                      0.1%             0.5%            0.6%
                                                                                                                               Secondary                    0.3%             0.2%            -0.4%

 1: Excludes sold assets, Assets Intended for Disposition, unconsolidated joint ventures, development properties not yet operational and land parcels (consistent with Q3 Supplemental = 299 US properties)
 2: 2017 occ. % = 2018 US SS Pool (229 properties)
 3: Primary (31 MSAs) and Secondary (68 MSAs) Markets classifications as defined by NIC                                                                                                                                           8
Outsized NOI impact in secondary markets

                                                       VTR US SS SHOP Portfolio                                                                                                           Key Messages
                                                                                                                                                                  1)       Secondary markets represent 21% of
                                                     Baseline                                                     Change                                                   US SS NOI and 44% of NOI YoY
                                                    3Q18 NOI                                                    3Q19 YOY                                                   dollar decline (-$3.7M) in 3Q19.
                                                     $132.7M                                                     -$8.4MM
                 100%
                                                                                                                                                                  2)       Double digit supply increase in the
                                                                                                                                                                           last 24 months widely impacted the
                                                                                                                      40%
                                                                                                                                                                           competitive environment in the
                                                                                                                                                                           secondary markets in Q3
                         Primary
                         Markets                       70%                                                                                                        3)       Price competition accelerated in Q3
                                                                                                                                                                           in pursuit of new residents
                  50%
                                                                                                                                                                  4)       Atria, Sunrise & ESL all experienced
                                                                                                                      44%                                                  revenue pressure in Secondary
                                                                                                                                                                           Markets

                     Secondary                                                                                                                                    5)       Operational recovery plans in
                                                       21%
                       Markets                                                                                                                                             progress
                                                                                                                      16%
                             Other                      8%                                                                                                        6)       Overall, expect new deliveries to be
                    0%
                                                                                                                                                                           more favorable in secondary markets
                                                                                                                                                                           in 2020 vs 2019

1: Excludes sold assets, Assets Intended for Disposition, unconsolidated joint ventures, development properties not yet operational and land parcels (consistent with Q3 Supplemental = 299 US properties)
2: Primary (31 MSAs) and Secondary (68 MSAs) Markets classifications as defined by NIC. VTR SS SHOP Properties are in 36 of 68 Secondary Markets                                                             9
SHOP Action Plans to Improve Performance

    Operational Recovery                                         Tactical and Strategic
                                  Capital Deployment
    Plans with Operators                                           Portfolio Moves

•    Ventas has a long history and track record, commencing in 2007, of successful SHOP
     asset management and forecasting

•    Continuing to adapt and improve in the current market environment

•    Three levers under continuous review to improve our position and to capitalize on the
     powerful upside that lies ahead

                                                                                             10
National Leading Indicators of Supply and Demand
Continue to Improve
Primary Markets: NICMAP Starts & Absorption Trends
30,000
25,000
Supply
20,000 3Q19 starts at
lowest level in
15,000
9 yrs
10,000
5,000
0
4Q06 4Q07 4Q08 4Q09 4Q10 4Q11 4Q12 4Q13 4Q14 4Q15 4Q16 4Q17 4Q18 Demand
TTM Absorption (Primary) TTM Starts (Primary) 3Q absorption
at highest level
on record for
Secondary Markets: NICMAP Starts & Absorption Trends primary
18000 markets
16000
14000
12000
10000
8000 NOI is a
6000 lagging
4000 indicator
2000
0
4Q06 4Q07 4Q08 4Q09 4Q10 4Q11 4Q12 4Q13 4Q14 4Q15 4Q16 4Q17 4Q18
TTM Absorption (Secondary) TTM Starts (Secondary)
Source: NIC data as of 3Q 2019 for primary and secondary markets.
11Favorable Supply Expectations Unchanged
Proprietary Supply Analytics Visibility into Multi-Year Pipeline (U.S. VTR SHOP)
3-Year Pipeline
Datasets Key Variables
Ongoing tracking of
Under
on-the-ground activity Delivery Date
Construction and progress
Ongoing scan of all
Probability of
Pre- public information 75%
Breaking Ground /
Construction (zoning, permits,
Delivery Date
transactions)
Historical start and Submarket-level
Future Projects delivery trends by trends and
submarket scenarios
Visibility into 3-year Pipeline at Project Level
12Aging Demographics Primary Driver of Demand
Upside
Demographic Profile – Age Cohorts Resident Profile Population Growth
US VTR SHOP Resident by move-in age1 US VTR SHOP Submarkets projected population growth2
% of total residents CAGR
~50% below 85
7%
~2%
6% 3.2%
< 75
5%
3.2% 75 - 84
~20% below 80
4%
85+
3% 0.9%
~10% below 75
2%
1%
0%
50 60 70 80 90 100 110 2019 2024
AgeSenior Housing NNN Portfolio
Senior Housing NNN Portfolio, 21% of Total NOI1
Operators: 29
Generates: $426M in NOI2
– Brookdale: $173M2, supported by liquidity ($455M as of 3Q19)3 + access
to capital
– Holiday: $62M2, supported by tenant and guarantor fixed charge coverage
of 1.12x4
– Other SH tenants: 40 states & U.K. Brookdale Holiday
9% 3%
– Diverse portfolio of operators with strong credit profiles
Large, diversified NNN senior housing portfolio; 2020 NNN senior housing outlook will be predicated on senior
housing market fundamentals, coverage, credit and portfolio performance
1: GAAP; Data per Q3 2019 press release and supplemental dated 10/25/2019.
2: Represents forecast FY19 total consolidated NNN asset pool, excluding assets intended for disposition, transition and held for sale.
3: As of BKD 3Q19 public filings dated 11/04/2019; excludes security deposit. 14
4: Denotes fixed charge coverage ratio as of 3Q19.Ventas’s Attractive Office Portfolio
International Hospitals 1%
Skilled Nursing 1% Loans
IRFs & LTACs • Core businesses with reliable cash flows
4%
Health Systems
7% • Narrowed and raised 2019 guidance to
2.0%-2.5% 2019 same-store cash NOI growth
6%
• Strong, increasing demand driven by
demographics and growing outpatient
trends
~$2B NOI • Leading position to capture upside between
54%
adjacent MOB, academic medical and R&I
businesses
OFFICE
• Exclusive partnerships with leading
27% developers (PMB, Wexford)
• Exceptional performance and achievements
Senior year-to-date
Housing
(Operating
& NNN)
Data per Q3 2019 press release and supplemental dated 10/25/2019.
15Exceptional University-Based R&I Performance
Growing Cash Flows Since Initial Acquisition1 Robust R&I Development Execution
Total University R&I Cash NOI ($M)
$0.9B+ of $1.5B R&I development pipeline
$42
announced year-to-date with
$35 $35 o Upsized 100% pre-leased to Drexel: 450K SF
$32 $32 $32
with an anticipated nearly 10% GAAP yield on
$31
$28
$270M project
$25 $26
$24
$25 Active on remainder of $1.5B R&I development
pipeline
• Strong portfolio performance since acquisition
Q4'16 Q1'17 Q2'17 Q3'17 Q4'17 Q1'18 Q2'18 Q3'18 Q4'18 Q1'19 Q2'19 Q3'19
⁃ Same-store growth of 10.6% in Q3 2019, driven
Same-Store Growth and Outperformance by continued leasing success
⁃ Strong 97% same-store occupancy
Y-O-Y Same Store Case NOI Growth & Occupancy
⁃ 3Q 2019 portfolio results include a $4.7M cash
lease termination fee, which was not included in
Same-Store NOI Growth
Occupancy (Same-Store) 97%
same-store results
12.4% 12.6%
10.6%
• Total R&I portfolio 2018 year-over-year NOI growth of
8.6% 21%
4.6%
⁃ Fueled by new projects at WashU, Duke, Penn
and Brown
Q3'18 Q4'18 Q1'19 Q2'19 Q3'19
Note: Data per Q3 2019 filings, press release, supplemental and earnings conference call dated 10/25/2019, unless otherwise noted.
1: Based on total university-based research & innovation cash NOI, as reported in each respective quarterly supplemental. 3Q19 includes $4.7M cash lease termination fee (not included in same-store results) 16Strong Demand Drivers for University–Based R&I
Aging & Higher Acuity Boosts Drug Demand Increases in NIH Funding
US Patients With Chronic Conditions (MS) Avg. Funding Per University ($) Funding 10-yr
577M source CAGR
2030 171
208M
2025 164 (36%)
NIH 1.9%
392M
2020 157 138M
173M
(24%) Other
2015 149 (44%) 3.1%
federal
132M
2010 141 102M (26%)
(23%) University
67M (17%) 7.0%
2005 133 self- funded
2000 125 2006 2016
1995 118 ~$2B Increase to NIH Funding in 2019 Represents 5% YoY
Increase and 30% Increase over 4 Years
Scientific Breakthroughs Driving Wealth Creation Key Highlights
Biotech Market Value & Biotechs with >$1B • Growing aging, higher-acuity population
$900
Biotechs >$1B (Count) $803 − 171M U.S. individuals with 1+ chronic conditions
by 2030E
140
$800
$700
Total Mkt. Value ($B) 120
112 • Aging population drives drug demand and drug
$600 100
$327
$500
$308
80
$400
$300
60
discovery
40
• $2B 2019 NIH funding increase (+5% year-over-year
$200
$100
33 38 20
$0 0
and +30% over 4 years)
2006 2012 2018
− Higher university self-funding drives monetize R&D
need
Sources: California Healthcare Foundation, Genome.gov; BTIG Equity Research: The State of Genomics; Discovery Medicine, 2014; National Science Foundation. 17Strong Demand Creates Releasing and M&A
Outperformance Opportunities
Robust demand increasing M&A activity with high
portfolio occupancy with valuations leading to improved
strong tenants tenant credit
95.9%
94.1% 74% 79%
4Q16 3Q19 4Q16 3Q19
Original Portfolio1 Excellent Credit Tenants2
1: Represents same store portfolio of 23 properties since R&I portfolio acquisition in 2016
2: Excellent Credit defined as investment Grade tenants or tenants with $1B+ market cap as of Q3 2019 for current portfolio
18Excellent Credit University Partners
University partners demonstrate strong creditworthiness and strong value proposition
of Research & Innovation sector
Percentile of 2018 NIH Funding 1
Substantially all Ventas university partners above 95th
percentile of NIH funded institutions
Pitt WashU Yale
Duke
99th VCU
Miami
Drexel
Penn
Maryland >99th
ASU Brown
Wake Forest Penn St
80th
Ventas partners
with strong credit
and high NIH
97th-98th
funding rank
//
95th-96th
0th Baa2 Baa1 A3 A2 A1 Aa3 Aa2 Aa1 Aaa
Credit rating
100,000 sq. ft. associated in VTR R&I portfolio
1: 2018 NIH funding, by institution (ranking of ~2,800 awardee institutions including universities, nonprofits, and corporations)
19R&I: Announced Five Specific Projects To Date
($0.9B+) of $1.5B Near-Term Pipeline
Pitt Immune Transplant Cortex Innovation Tower One uCity ASU Phoenix Biomedical College of Nursing and Health
&Therapy Center Iconic development in response to Expanding a thriving life science Campus Professions, Drexel University
Research, academic medicine and strong demand in supply ecosystem adjacent to top Class-A, fully lab-enabled research & Creating state of the art health
innovation hub anchored by Pitt to constrained innovation district universities and health institutions innovation center anchored by education facility; will be a magnet for
house groundbreaking Arizona State University and focused recruiting faculty and students
immunotherapy research in on biomedical discovery and
collaboration with UPMC and co- innovation in health outcomes
located with UPMC Shadyside Post-3Q: Drexel increased
Hospital development size to 450K sq.
ft. (100% pre-leased) at nearly
10% GAAP yield;
total cost of $270M
1.7M >45% +7% Cash 2020 to 2022 2022 to 2024
Total SF Pre-Leased Yield delivery stabilization
Note: Data per Q3 2019 filings, press release, supplemental and earnings conference call dated 10/25/2019
20Opportunity to Expand Existing
Relationships…
Additional University-
Controlled Land
$3.6B*
Real Estate
Value of
VTR Land Bank
Land
Bank
Additional Opportunities:
• In 3Q19, Ventas acquired land and other
assets in the thriving Philadelphia uCity
submarket, supporting an additional 450K
sq. ft. of developable space
• Land controlled by our university
partners
* VTR controlled land bank measures roughly 6.2M SF. Potential value is an estimate.
21… As Well As Large Opportunity For New University
Relationships
Today, our university partners
represent 10% of NIH funding Opportunity to Expand our Presence in the West and Midwest
With many research leaders still untapped1
Current presence
1: Top schools by NIH funding that VTR does not currently have a relationship with
22Leading National Medical Office (MOB) Portfolio
$397M 359 20M >160 33
NOI Hospital + Health
MOBs Outpatient Sq. Ft. States
(19% VTR NOI) System Affiliations
= Top tenant by base rent
= New MOB affiliation
Note: Data as of Q3 2019, unless otherwise noted; brand names shown are not all-inclusive. Blue states represent states where VTR owns MOB properties. 23Robust Medical Office Market Fundamentals
US Healthcare Spending Increasing Outpatient % Increase of Health System Revenue
National Healthcare Spending ($B) Outpatient Share of Gross Hospital Revenue (%)
2026 100
2024
2022 50.0 49.4 49.0 48.2 Inpatient
51.5
2020 Stays
2018
50
2016
Outpatient Visits
2014
51.6 (Including OP
2012 48.1 49.6 50.6 51.0
Care Provided in
2010 Hospital & MOBs)
2008 0 2,000 4,000 0
$2B $4B 2013 2014 2015 2016 2017
Strong, Stable Industry Occupancy Growing MOB Industry Cash Flows
Average NOI Per Occupied Sq. Ft.
92.4% 92.3% 92.5% 92.5% 92.3% $21.5
92.1% 92.0% $20.9
91.8% 91.9% $20.4 $20.4
91.6% 91.6% $20.1
$19.7
$19.3
$18.9
Q1’14
Q2’14
Q3’14
Q4’14
Q1’15
Q2’15
Q3’15
Q4’15
Q1’16
Q2’16
Q3’16
Q4’16
Q1’17
Q2’17
Q3’17
Q4’17
Q1’18
Q2’18
Q3’18
Q4’18
Q1’19
Q1’14
Q2’14
Q3’14
Q4’14
Q1’15
Q2’15
Q3’15
Q4’15
Q1’16
Q2’16
Q3’16
Q4’16
Q1’17
Q2’17
Q3’17
Q4’17
Q1’18
Q2’18
Q3’18
Q4’18
Q1’19
Source: Centers for Medicare & Medicaid Services, Office of the Actuary; Moody's Investors Service, Medians report; Revista
24Industry Leading MOB Portfolio Validated
Against 5 Critical Quality Measures
HH income
+10%
Market attractiveness higher than US
Local demographic trends to support healthcare demand average
& payer quality 86%
of NOI affiliated
Strategic positioning with investment
Highly rated health system with strong market position grade health
96% system
of hospitals
Hospital strength considered
Strong financial performer with leading market position “very strong” to
“stable”
87%
Tenant quality of physician
Care mix focused on high growth specialties, ambulatory leased space is
surgery & imaging specialty
96%
Asset strength On-campus &
On-campus & off-campus, hospital / health system off-campus
affiliated asset affiliated
25Strong VTR Outpatient Positioning
High-Quality Diversified Tenant Mix On-Campus/Affiliated With Leading Health Systems
% ANN. TENANT
BASE RENT CREDIT
Ascension Health 5% AA+
Advocate Aurora Health 4% AA
97%
Providence St. Joseph
4% AA-
Health
96%
Sutter Heath 3% AA- On-Campus/
Bon Secours Mercy Affiliated
2% A+
Health
Ohio Health 2% AA+
Remaining Tenants 80%
~70% NOI fromSegmentation Drives Resource Allocation Strategy
and Tactical Execution Drives Growth
Portfolio Segmentation Determines Resource …and Informs Customized, Tactical Plan for Each Asset
Allocation Strategy…
Capital allocation priority
Enhance
High
Reposition
Position
Leverage
Low
Innovate Strength
Value-add Core
Asset profile
27Strong Capital Markets Execution in 2019
Extended maturity profile and managed interest rate risk by issuing $650M of 3.00% Senior Notes due 2030 in August 2019
Retired $600M of 4.25% Senior Notes due 2022
Managed currency risk by closing a C$500M unsecured term loan in September 2019
Attractively priced at CDOR + 90 bps and matures in January 2025
Issued second largest bond deal to date in the Canadian real estate sector in November 2019
C$900M raised across two tranches:
C$300M floating rate note maturing 2021; largest floating rate note tranche priced in the Canadian real estate sector
C$600M fixed rate tranche maturing 2024; second largest tranche priced in the Canadian real estate sector
Well-Staggered Maturity Profile1,2
$1.7B
$1.6B $1.6B $1.5B
Year-End
2018 Maturity $1.1B
$1.0B
Chart
$0.8B
$0.7B
$0.5B
$0.4B
$0.3B
$0.1B
2019 2020 2021 2022 2023 2024 2025 2026 2027 2028 2029 2030+
USD Senior Notes CAD Senior Notes Secured Debt USD Term Loan CAD Term Loan
1: Maturities are as of Q3 2019 supplemental pro forma for November C$900M 2019 Canadian bond issuance (C$300M two-year floating rate note maturing 2021 and C$600M fixed rate note maturing 2024).
2: Balances exclude normal monthly principal amortization and Ventas’s share of unconsolidated debt as well as the company’s revolving credit facility, commercial paper balance and secured credit facility
28Leadership in Corporate Responsibility
Achievements in Major Sustainability Ratings &
Industry Leadership & Reputation
Rankings
Maintained 1st Place Ranking among Company Leadership Recognitions
three listed Healthcare Real Estate HBR 100 Best Performing CEOs in the
participants in 2019 GRESB ESG World; Modern Healthcare 100 Most
Assessment, achieving a 4-star rating Influential People in Healthcare;
and improving our performance Elected Chair of the Real Estate
Roundtable
Achieved CDP “Leadership” level
(A-) in 2018, performing significantly Environmental, Social and
better than the sector average of B-, Governance
and the North America average of C
• Published 2019 Corporate
Nareit Leader in the Light: Nareit Sustainability Report in accordance
Leader in the Light for the second with international gold standard
consecutive year in 2018 (Global Reporting Initiative)
Report is organized around three key pillars: people,
performance & planet, based on a materiality
Continued “Top Quartile” inclusion assessment with key internal & external stakeholders
in Dow Jones Sustainability North
America Index of Public Real Estate • First REIT to join the CEO Action
Companies in 2018 for Diversity & Inclusion Pledge
Source: Ventas financial disclosures and press releases.
29$3.8B Gross Investments Year-to-Date: Disciplined Strategy
with Recent Proof Points Across 3 Opportunity Segments
60%-75% of Investments
Attractive Senior
High-Quality, Low Cap-Rate, Private Pay
Housing and Medical Higher-Yielding
Assets
Office
Cambridge Life Academic Senior Housing – Colony Announced
Science – 1030 Medicine – Le Groupe Debt R&I
Mass. Ave. Duke Health Maurice Investment Developments
Acquisition Acquisition Acquisition
$128M $80M $1.8B $490M ~$900M+
Investment Investment Canadian Senior Investment Development
Housing Portfolio Projects
~5% ~5% ~5.5% ~9% ~7%
Initial Unlevered Initial Unlevered Expected Stabilized Cash Yield Stabilized Unlevered
Cash Yield with Cash Yield with Unlevered Yield with Upside Cash Yield
Upside from Below Upside from In-Place
Market Rents Lease Escalators
Balanced Approach Drives Reliable, Growing Cash Flow and Earnings Accretion
30Expanding High-quality Canadian Senior Housing Footprint
with Le Groupe Maurice Acquisition; Off to a Strong Start
Operating Developments
• Completed $1.8B gross investment in Class A
portfolio of apartment-like seniors housing assets in
attractive Quebec market
Les Jardins Millen Ékla IVVI
• Equity partnership with Le Groupe Maurice, a best-
in-class, fully-integrated designer and developer of
senior housing
• Further diversifies Ventas’s portfolio, business model,
geographic and operator base
Caléo Le 22 Vast
• Growth expected from lease-up assets, in-progress
developments and exclusive rights to future
developments
• Establishes new platform for growth with Le
Groupe Maurice building on Ventas’s successful
Boréa Floréa Elogia II
strategy with leading operators
• Expected to be accretive to normalized FFO in 2020
31Normalized FFO Considerations
Implied Q4 2019 Normalized FFO = $0.91 at midpoint1
$3.81-$3.85
2019E Normalized Note: 2018 Q4 ($0.96) annualized within 2019 Normalized FFO
FFO/sh Guidance expectations of $3.81 - $3.85
2020 Considerations2
Q4 Implied
Guidance
Midpoint1
at FY
$0.91
1. Senior Housing:
• 2H 2019 SHOP trends have significant implications for 2020
• 2020 carryover for NNN senior housing 2019 impact nearly
double 2019 impact
• Any incremental NNN senior housing impact dependent on
$2.92 market conditions
Q1-Q3 Actuals
2. Other Property:
• Stable growth with GAAP same-store NOI growth typically 100
bps below cash
• R&I development NOI is largely expected to come online 2021/22
and beyond
3. Other Considerations:
2019E Normalized FFO/Sh • Carryover impact of LGM investments
• Carryover impact of late 2019 dispositions
• Excludes new unannounced investments or capital markets
activity
1: Data per Q3 2019 press release, supplemental, and earnings conference call dated 10/25/2019.
2: Excludes the impact of unannounced new investments. 32You can also read