CAPITALAND MALL TRUST - Singapore's First & Largest REIT USA Non-Deal Roadshow - CapitaLand Integrated ...
←
→
Page content transcription
If your browser does not render page correctly, please read the page content below
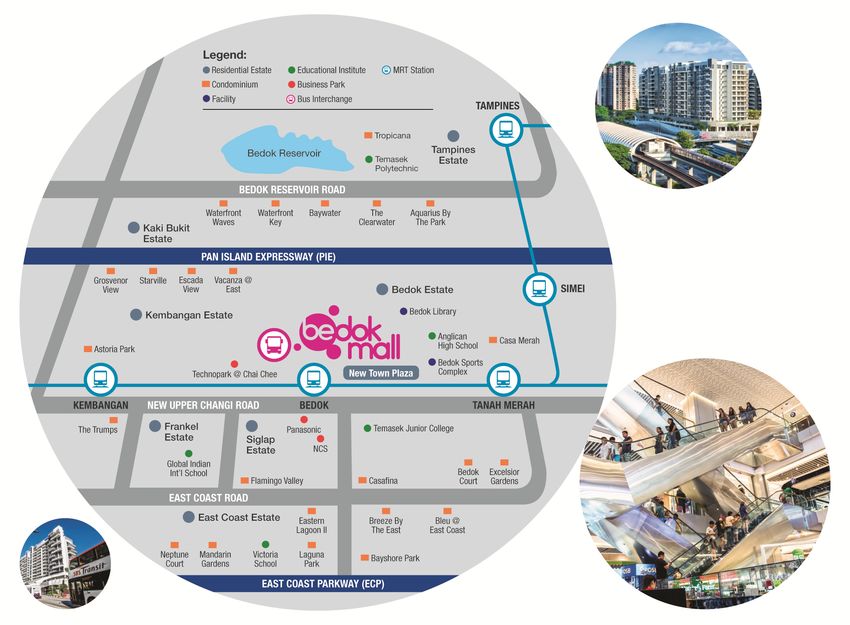
Photo Credit: Kwek Swee Seng, Singapore

                                                                                  Photo Credit: Kwek Swee Seng, Singapore
    CAPITALAND MALL TRUST
     Singapore’s First & Largest REIT

        USA Non-Deal Roadshow
               14 - 17 September 2015
1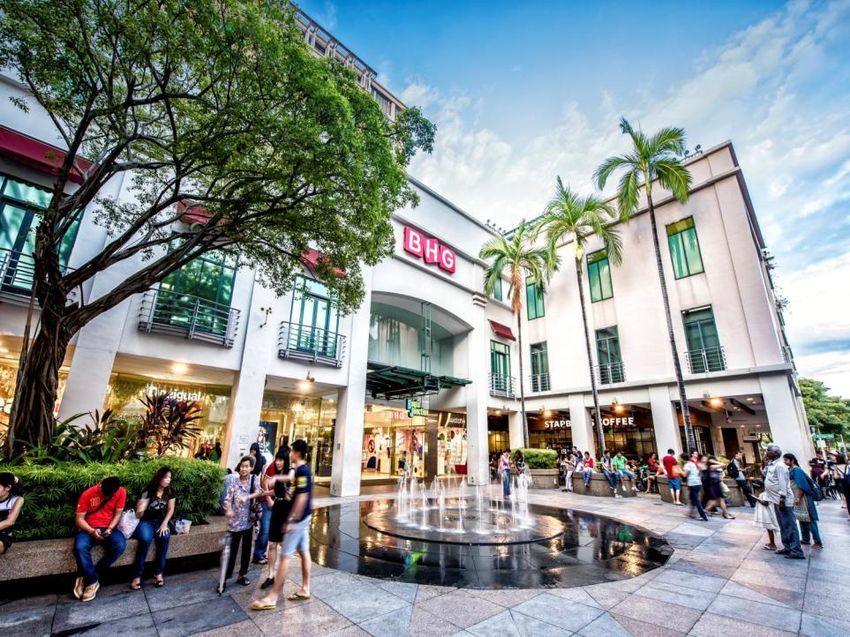
Disclaimer
    This presentation may contain forward-looking statements that involve assumptions, risks and uncertainties. Actual future
    performance, outcomes and results may differ materially from those expressed in forward-looking statements as a result
    of a number of risks, uncertainties and assumptions. Representative examples of these factors include (without
    limitation) general industry and economic conditions, interest rate trends, cost of capital and capital availability,
    competition from other developments or companies, shifts in expected levels of occupancy rate, property rental
    income, charge out collections, changes in operating expenses (including employee wages, benefits and training
    costs), governmental and public policy changes and the continued availability of financing in the amounts and the
    terms necessary to support future business. You are cautioned not to place undue reliance on these forward-looking
    statements, which are based on the current view of management on future events.

    The information contained in this presentation has not been independently verified. No representation or warranty
    expressed or implied is made as to, and no reliance should be placed on, the fairness, accuracy, completeness or
    correctness of the information or opinions contained in this presentation. Neither CapitaLand Mall Trust Management
    Limited (the ‘Manager’) or any of its affiliates, advisers or representatives shall have any liability whatsoever (in
    negligence or otherwise) for any loss howsoever arising, whether directly or indirectly, from any use, reliance or
    distribution of this presentation or its contents or otherwise arising in connection with this presentation.

    The past performance of CapitaLand Mall Trust (‘CMT’) is not indicative of the future performance of CMT. Similarly, the
    past performance of the Manager is not indicative of the future performance of the Manager.

    The value of units in CMT (‘Units’) and the income derived from them may fall as well as rise. Units are not obligations of,
    deposits in, or guaranteed by, the Manager or any of its affiliates. An investment in Units is subject to investment risks,
    including the possible loss of the principal amount invested.

    Investors should note that they will have no right to request the Manager to redeem or purchase their Units for so long as
    the Units are listed on the Singapore Exchange Securities Trading Limited (the ‘SGX-ST’). It is intended that unitholders of
    CMT may only deal in their Units through trading on the SGX-ST. Listing of the Units on the SGX-ST does not guarantee a
    liquid market for the Units.

    This presentation is for information only and does not constitute an invitation or offer to acquire, purchase or subscribe
    for Units.

2                                                 USA Non-Deal Roadshow *September 2015*
Contents
Key Highlights and Financial Results
Portfolio Updates
Asset Enhancement Initiatives
Acquisitions & Development
Looking Forward
Annexes
3 USA Non-Deal Roadshow *September 2015*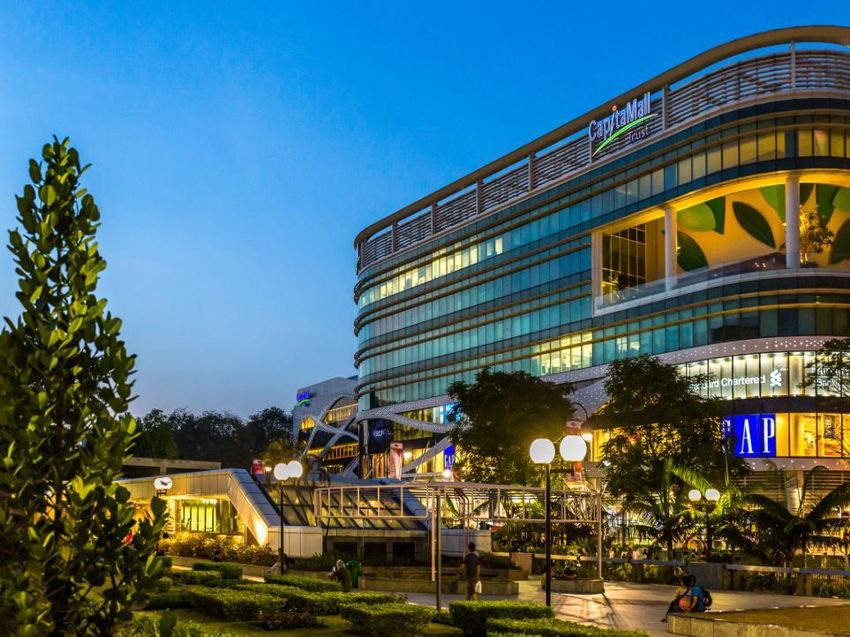
Key Highlights and
        Financial Results

4                 USA Non-Deal Roadshow *September 2015*
                                                           Bugis Junction
Key Highlights of 2Q 2015
    • Operational performance (year-to-date)
      – 355 new leases/renewals achieved with 4.6% positive rental reversion
      – Shopper traffic increased by 3.4% year on year
      – Tenants’ sales per square foot (‘psf’) increased by 2.9% year on year
      – 96.4% portfolio occupancy rate as at end-June 2015

    • Update on AEIs
      – Clarke Quay: Reconfiguration works at Block C to house new
        entertainment and food and beverage (F&B) tenants
      – Plaza Singapura: Proposed rejuvenation works for its interior to
        enhance shoppers’ experience

    • Proactive capital management
      – US$500.0 million 4.321% fixed rate notes, swapped to S$699.5 million at
        fixed rate of 3.794%, had been repaid upon maturity on 8 April 2015

5                               USA Non-Deal Roadshow *September 2015*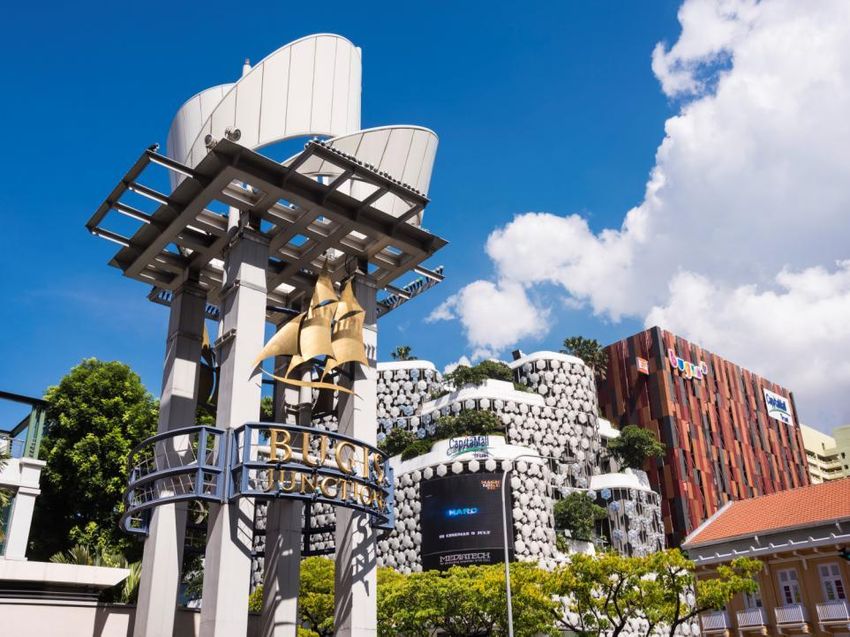
1H 2015 Distributable Income Up 2.4% Y-o-Y
                                              (1)                                                    Distributable Income (S$ mil)
     Distributable Income                           Distribution Per Unit (DPU)                          186.9
                                                                                                                 (1)
                                                                                                                                 182.5
                                                                                                                                         (2)

       S$186.9                                         5.39
       million                                         cents
              2.4% Y-o-Y                                   2.5% Y-o-Y                                  1H 2015                  1H 2014

                      DPU (cents)
                                                          Annualised DPU                              Annualised Distribution
              5.39                     5.26
                                                                                                               Yield

                                                           10.87                                         4.99
                                                           cents                                         %
                                                                                                      (Based on closing unit price of
            1H 2015                  1H 2014                      2.5% Y-o-Y                          S$2.180 on 21 July 2015)
    (1) For 1H 2015, CMT had retained S$8.0 million of its taxable income available for distribution to Unitholders for distribution in FY 2015.
        Capital distribution and tax exempt income of S$5.9 million received from CapitaLand Retail China Trust ('CRCT') in 1Q 2015 had also
        been retained for general corporate and working capital purposes.
    (2) In 1H 2014, CMT had retained S$11.2 million of its taxable income available for distribution to Unitholders for distribution in 4Q 2014.
        Capital distribution and tax exempt income of S$5.3 million received from CRCT in 1Q 2014 had also been retained for general
        corporate and working capital purposes.

6                                                         USA Non-Deal Roadshow *September 2015*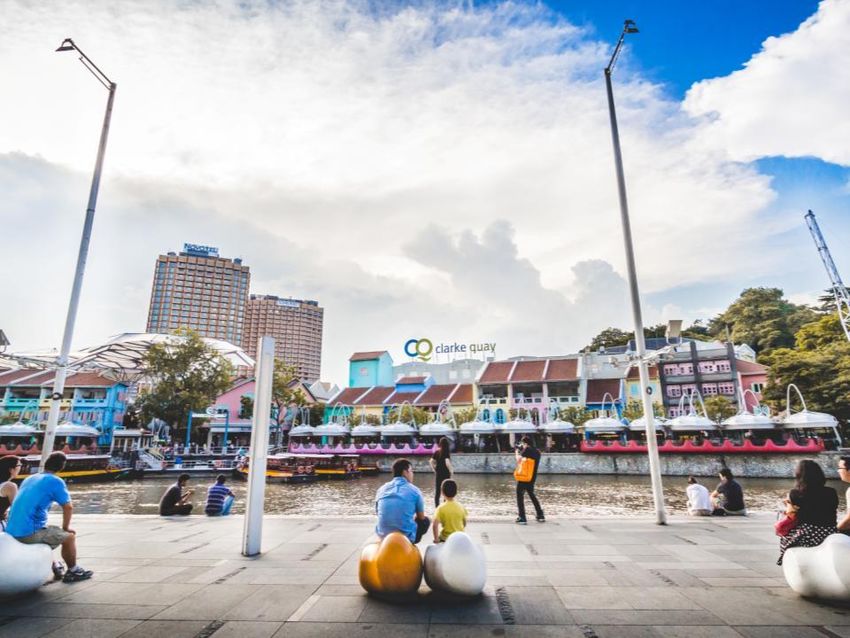
1H 2015 Financial Performance
       Gross Revenue                              Net Property Income                         Distributable Income

            S$326.9                                   S$227.2                                      S$186.9                (1)

            million                                   million                                      million
                0.6% Y-o-Y                                    0.5% Y-o-Y                                 2.4% Y-o-Y

     S$ million
                                                                                                  1H 2015         1H 2014
                  326.9        329.0

                                                          227.2        228.3                               (1)           (2)
                                                                                                  186.9          182.5

                 Gross Revenue                       Net Property Income                     Distributable Income
    (1) For 1H 2015, CMT retained S$8.0 million of its taxable income available for distribution to Unitholders for distribution
        in FY 2015. Capital distribution and tax exempt income of S$5.9 million received from CRCT in 1Q 2015 had also
        been retained for general corporate and working capital purposes.
    (2) For 1H 2014, CMT retained S$11.2 million of its taxable income available for distribution to Unitholders for distribution
        in 4Q 2014. Capital distribution and tax exempt income of S$5.3 million received from CRCT in 1Q 2014 had also
        been retained for general corporate and working capital purposes.

7                                                    USA Non-Deal Roadshow *September 2015*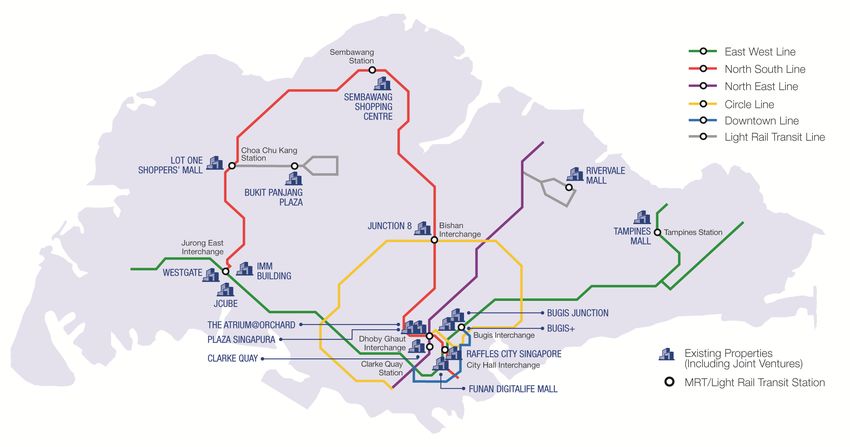
(1)
                            Debt Maturity Profile as at 30 June 2015
                 600

                 500
                                                                                                                                                                 450.0
                                            414.0           (3)                                                        412.0
                 400                                     14.0
                                                  (4)
                                    (2)
                                           80.0
    S$ million

                 300                                                                                   286.9
                                                                                                                                                                  300.0
                                                            250.0               (6)
                                                                                                                                                   240.0
                                                                        505.2
                                                                                                                       350.0
                                                                                                       100.0
                 200                                                                                                                                     (12)
                                                   (5)      100.0                                                                                 100.0
                                          320.0
                                                                                                                (8)

                 100              (2)                                                                  126.0                              (11)                                                                  (15)
                            185.6
                            185.6                                                             (7)                                  190.1                (13)                                                192.8
                                                                                       157.6                                                      140.0
                                                           150.0                                                (9)         (10)                                  150.0       108.3
                                                                                                                                                                                     (14)

                                                                                                        60.9           62.0                                                       (11)               (12)
                   0
                            2015           2016            2017          2018           2019           2020            2021         2022           2023          2024           2025          2026          2027
                              Unsecured Banking Facilities                                                                         Secured Banking Facilities - 30.0% interest in Infinity Trusts
                              Notes issued under US$ Euro-Medium Term Note ('EMTN') Programme                                      Notes issued under S$ Medium Term Note ('MTN') Programme
                              Secured CMBS from Silver Oak - 40.0% interest in RCS Trust                                           Secured term loan from Silver Oak - 40.0% interest in RCS Trust
                              Secured revolving credit facility from Silver Oak - 40.0% interest in RCS Trust                      Retail Bonds due 2021 at fixed rate of 3.08% p.a.

                                  Silver Oak: Silver Oak Ltd            CMBS: Commercial mortgage backed securities                                                             Debts with secured assets

                  (1)    Includes CMT’s share of borrowings in RCS Trust (40.0%) and Infinity Office Trust and Infinity Mall Trust (collectively known as 'Infinity Trusts')(30.0%).
                  (2)    S$618.6 million secured banking facilities by Infinity Trusts due in October 2015. CMT’s 30.0% share thereof is S$185.6 million.
                  (3)    Drawdown of S$35.0 million under Silver Oak from the S$300.0 million revolving credit facility. CMT’s 40.0% share thereof is S$14.0 million.
                  (4)    S$200.0 million 5-year term loan under Silver Oak. CMT’s 40.0% share thereof is S$80.0 million.
                  (5)    US$645.0 million in principal amount of Class A Secured Floating Rate Notes with expected maturity on 21 June 2016 issued pursuant to the S$10.0 billion Multicurrency
                         Secured Medium Term Note Programme established by Silver Oak and are secured by its rights to Raffles City Singapore. The proceeds have been swapped into S$800.0
                         million. CMT’s 40.0% share thereof is S$320.0 million.
                  (6)    US$400.0 million 3.731% fixed rate notes ('EMTN Series 2') were swapped to S$505.2 million at a fixed rate of 3.29% p.a. in March 2012.
                  (7)    ¥10.0 billion 1.309% fixed rate notes ('EMTN Series 4') were swapped to approximately S$157.6 million at a fixed rate of 2.79% p.a. in October 2012.
                  (8)    ¥10.0 billion 1.039% fixed rate notes ('MTN Series 10') were swapped to S$126.0 million at a fixed rate of 3.119% p.a. in November 2013.
                  (9)    Drawdown of S$60.9 million unsecured banking facilities in March 2015.
                  (10)   ¥5.0 billion floating rate (at 3 months JPY LIBOR + 0.48% p.a.) notes ('MTN Series 12') were swapped to S$62.0 million at a fixed rate of 3.148% p.a. in February 2014.
                  (11)   HK$1.15 billion 3.76% fixed rate notes ('EMTN Series 3') were swapped to S$190.1 million at a fixed rate of 3.45% p.a. in June 2012.
                  (12)   ¥8.6 billion floating rate (at 3 months JPY LIBOR + 0.25% p.a.) notes ('MTN Series 16') were swapped to S$100.0 million at a fixed rate of 2.85% p.a. in February 2015.
                  (13)   HK$885.0 million 3.28% fixed rate notes ('EMTN Series 5') were swapped to S$140.0 million at a fixed rate of 3.32% p.a. in November 2012.
                  (14)   HK$650.0 million 3.25% fixed rate notes ('MTN Series 14') were swapped to S$108.3 million at a fixed rate of 3.25% p.a. in November 2014.
                  (15)   HK$1.104 billion 2.77% fixed rate notes ('MTN Series 15') were swapped to S$192.8 million at a fixed rate of 3.25% p.a. in February 2015.

8                                                                                             USA Non-Deal Roadshow *September 2015*
Key Financial Indicators
                                                                                 As at                         As at
                                                                             30 June 2015                  31 March 2015

     Unencumbered Assets as % of Total Assets                                    100.0%                          100.0%
                                      (1,2)
     Aggregate Leverage                                                           33.7%                           33.8%

     Net Debt / EBITDA (3)                                                         5.5x                            5.2x
                                (4)
     Interest Coverage                                                             4.6x                            4.5x

     Average Term to Maturity (years)                                               6.1                             5.1

     Average Cost of Debt (5)                                                      3.3%                           3.4%
     CMT’s Issuer Rating (6)                                                                                       ‘A2’

    (1) In accordance to Property Funds Appendix, CMT’s proportionate share of its joint ventures borrowings and total deposited
        property are included when computing the aggregate leverage.
    (2) Funds raised ahead of the maturity of the existing borrowings of CMT are excluded from both borrowings and total deposited
        property for the purpose of computing the aggregate leverage as the funds are set aside solely for the purpose of repaying the
        existing borrowings of CMT.
    (3) Net Debt comprises gross debt less temporary cash intended for refinancing and capital expenditure. EBITDA refers to earnings
        before interest, tax, depreciation and amortisation.
    (4) Ratio of net investment income at CMT Group before interest and tax over interest expense from 1 January 2015 to 30 June 2015.
    (5) Ratio of interest expense over weighted average borrowings.
    (6) Moody’s Investors Service has affirmed the ‘A2’ issuer rating of CMT on 16 July 2015.

9                                                  USA Non-Deal Roadshow *September 2015*
Prudent Capital Management
                                                             Aggregate Leverage (%)(1,2)
                                         39.0                   38.4
                                         38.0
                                                                           36.7
                                         37.0
                                                    35.9
                                         36.0                                           35.3
                                         35.0
                                                                                                  33.8       33.7
                                         34.0
                                         33.0
                                         32.0
                                         31.0
                                                   2010         2011      2012          2013      2014     1H 2015

                     Net Debt / EBITDA (times)(3)                                                Interest Coverage (times)(4)
      6.0      5.4       5.4       5.4                           5.5              6.0
                                             4.9       5.1                                                                5.0
      5.0                                                                         5.0      4.5                                       4.5       4.6
                                                                                                     4.2
      4.0                                                                         4.0                           3.6

      3.0                                                                         3.0

      2.0                                                                         2.0

      1.0                                                                         1.0

      0.0                                                                         0.0
              2010      2011      2012      2013      2014     1H 2015                    2010      2011       2012      2013       2014    1H 2015
     (1) In accordance to Property Funds Appendix, CMT’s proportionate share of its joint ventures borrowings and total deposited property are included when
         computing the aggregate leverage.
     (2) Funds raised ahead of the maturity of the existing borrowings of CMT are excluded from both borrowings and total deposited property for the purpose
         of computing the aggregate leverage as the funds are set aside solely for the purpose of repaying the existing borrowings of CMT.
     (3) Net Debt comprises gross debt less temporary cash intended for refinancing and capital expenditure. EBITDA refers to earnings before interest, tax,
         depreciation and amortisation.
     (4) Ratio of net investment income at CMT Group before interest and tax over interest expense from 1 January 2015 to 30 June 2015.

10                                                            USA Non-Deal Roadshow *September 2015*
Valuations and Valuation Cap Rates
Valuation Valuation
Valuation Valuation Valuation
Variance Cap Rate Cap Rate
as at 30 Jun 15 as at 31 Dec 14 as at 30 Jun 15
as at 30 Jun 15 as at 31 Dec 14
S$ million S$ million S$ million S$ per sq ft NLA % %
Tampines Mall 953.0 922.0 31.0 2,682 5.35 5.35
Junction 8 691.0 662.0 29.0 2,734 5.35 5.35
Funan DigitaLife Mall 367.0 361.0 6.0 1,228 5.50 5.50
Retail: 6.50 Retail: 6.50
(1)
IMM Building 606.0 603.0 3.0 633 Office: 6.25 Office: 6.25
Warehouse: 7.50 Warehouse: 7.50
Plaza Singapura 1,235.0 1,223.0 12.0 2,555 5.00 5.00
Bugis Junction 990.0 951.0 39.0 2,492 5.35 5.35
JCube 288.0 335.0 (47.0) 1,393 5.50 5.60
Lot One Shoppers’ Mall 505.0 503.0 2.0 2,297 5.35 5.35
Bukit Panjang Plaza 298.0 292.0 6.0 1,815 5.45 5.45
Retail: 5.25 Retail: 5.25
The Atrium@Orchard 733.0 728.0 5.0 1,886 (1)
Office: 4.00 Office: 4.00
Clarke Quay 373.0 371.0 2.0 1,283 5.50 5.50
Bugis+ 340.0 337.0 3.0 1,587 5.70 5.70
Other assets (2) 225.0 222.0 3.0 1,004 5.55 – 5.60 5.55 – 5.60
Total CMT Portfolio excluding Raffles
7,604.0 7,510.0 94.0 - -
City Singapore and Westgate
Less additions during the period (40.8)
Net increase in valuations 53.2
Retail: 5.25 Retail: 5.25
Raffles City Singapore (40.0% (3)
1,248.6 1,243.8 4.8 N.M. Office: 4.25 Office: 4.25
interest)
Hotel: 5.13 Hotel: 5.25
Westgate (30.0% interest) 319.2 328.2 (9.0) 2,595 5.20 5.35
Share of Joint Ventures’ investment
1,567.8 1,572.0 (4.2)
properties
Less additions during the period (1.9)
Net decrease in valuations (6.1)
(1) Reflects valuation of the property in its entirety.
(2) Includes Sembawang Shopping Centre and Rivervale Mall.
(3) Not meaningful because Raffles City Singapore comprises retail units, office units, hotels and convention centre.
N.M. – Not Meaningful USA Non-Deal Roadshow *September 2015*
11Healthy Balance Sheet
As at 30 June 2015
S$’000
Non-current Assets 8,847,857 Net Asset Value/Unit
S$1.84
(as at 30 June 2015)
Current Assets 659,395
Adjusted Net Asset Value/Unit
Total Assets 9,507,252 S$1.81
(excluding distributable income)
Current Liabilities 206,971
Non-current Liabilities 2,932,739
Total Liabilities 3,139,710
Net Assets 6,367,542
Unitholders’ Funds 6,367,542
Units in Issue (’000 units) 3,463,595
12 USA Non-Deal Roadshow *September 2015*Portfolio Updates
13 USA Non-Deal Roadshow *September 2015*
Bugis Junction and Bugis+(1)
Shopper Traffic
1H 2015 Increased by 3.4% Y-o-Y
150,000
140,000
Shopper Traffic (‘000)
130,000
120,000
110,000
100,000
90,000
80,000
1H 2015 1H 2014
Source: CapitaLand Mall Trust Management Limited (CMTML)
(1) For comparable basis, this includes the entire CMT portfolio of malls, except Bugis Junction which
underwent phase two AEI from March 2014 to September 2014.
14 USA Non-Deal Roadshow *September 2015*(1)
Portfolio Tenants’ Sales psf per month
1H 2015 Increased by 2.9% Y-o-Y
90
Tenants’ Sales ($ psf/mth)
80
70
60
50
40
1H 2015 1H 2014
Source: CMTML
(1) For comparable basis, this includes the entire CMT portfolio of malls, except Bugis Junction which
underwent phase two AEI from March 2014 to September 2014.
15 USA Non-Deal Roadshow *September 2015*Tenants’ Sales by Trade Categories in 1H 2015
Improved Consumer Spending
Y-o-Y Variance of Tenants’ Sales $ psf/mth (%)
15 10.7 10.4
10 8.1 6.8 5.7
4.1 3.4 3.1
5 1.9 1.5 1.2 0.2
0
(0.3) (1.4) (1.4)
-5
(4.3) (4.4)
-10
-15
-20
-25
(24.3)
(1)
-30
Supermarket
Services
Information Technology
Gifts & Souvenirs
Fashion
Telecommunications
Books & Stationery
Music & Video
Beauty & Health
Electrical & Electronics
Leisure & Entertainment
Department Store
Food & Beverage
Sporting Goods
Home Furnishing
Jewellery & Watches
Shoes & Bags
Toys & Hobbies
Source: CMTML
(1) Services includes convenience stores, bridal shops, optical shops, film processing shops, florists, magazine
stores, pet shops, travel agencies, cobblers/ locksmiths, laundromats and clinics.
16 USA Non-Deal Roadshow *September 2015*Rental Reversions
From 1 January to 30 June 2015 (Excluding Newly Created and Reconfigured Units)
Net Lettable Area Increase in Current
Rental Rates vs
Preceding Rental
No. of Retention
Percentage Rates
Property Renewals / Rate Area
of Mall (typically
New Leases (%) (sq ft)
(%) committed three
years ago)
(%)
Tampines Mall 35 82.9 20,105 5.7 6.8
Junction 8 16 81.3 10,637 4.2 9.9
Funan DigitaLife Mall 51 96.1 80,111 26.8 2.3
IMM Building 8 87.5 3,793 0.9 4.8
Plaza Singapura 42 81.0 47,128 9.8 5.4
Bugis Junction 28 75.0 20,797 5.2 6.8
JCube 16 81.3 21,399 10.3 (13.5)
Raffles City Singapore 40 77.5 61,484 14.6 1.6
Lot One Shoppers’ Mall 28 71.4 47,020 21.4 6.2
Bukit Panjang Plaza 9 66.7 20,417 12.5 7.0
The Atrium@Orchard 5 100.0 6,792 5.0 2.6
Clarke Quay 16 87.5 41,675 16.0 23.8
Bugis+ 38 81.6 80,151 37.4 5.9
(1)
Other assets 23 78.3 42,659 19.0 2.3
CMT Portfolio 355 82.0 504,168 12.4 4.6
(1) Includes Sembawang Shopping Centre and Rivervale Mall.
17 USA Non-Deal Roadshow *September 2015*(1)
Renewals Achieved for CMT Portfolio
Net Lettable Area Increase in Current Rental Rates vs
Preceding Rental
No. of Rates
Year (2) Renewals / Forecast Rental
Area % of Total (typically
New Leases Rates (3)
(sq ft) NLA committed
(%)
three years ago)
(%)
1H 2015 355 504,168 12.4 N.A.(4) 4.6
2014 490 898,826 22.2 N.A.(4) 6.1
2013 629 942,737 24.4 N.A.(4) 6.3
2012 446 623,388 16.9 N.A.(4) 6.0
2011 503 686,143 18.4 N.A.(4) 6.4
2010 571 898,713 25.4 2.2 6.5
2009 614 971,191 29.8 N.A.(4) 2.3
2008 421 612,379 19.0 3.6 9.6
2007 385 806,163 25.6 5.8 13.5
2006 312 511,045 16.0 4.7 8.3
(1) For IMM Building and Raffles City Singapore, only retail units were included in the analysis.
(2) As at 30 June 2015 for 1H 2015 and 31 December for 2006 to 2014.
(3) Based on the respective yearly financial results presentation slides available at the investor relations section of
CMT’s website at http://www.cmt.com.sg
(4) Not applicable as there was no forecast for 2009, 2011, 2012, 2013, 2014 and 1H 2015.
18 USA Non-Deal Roadshow *September 2015*Portfolio Lease Expiry Profile (1)
as at 30 June 2015
Weighted Average Expiry by Gross Rental Income 2.2 Years
(2)
Gross Rental Income per Month
Number of Leases S$’000 % of Total
(3)
2015 446 6,604 11.8
2016 943 15,612 28.0
2017 864 14,932 26.7
2018 575 11,340 20.3
2019 & Beyond 90 7,376 13.2
Total 2,918 55,864 100.0
(1) Based on committed leases.
(2) Includes CMT’s 40.0% interest in Raffles City Singapore (office and retail leases, excluding hotel lease)
and CMT’s 30.0% interest in Westgate. Based on the month in which the lease expires and excludes
gross turnover rent.
(3) Of which 355 leases are retail leases.
19 USA Non-Deal Roadshow *September 2015*High Occupancy Maintained
31 Dec 31 Dec 31 Dec 31 Dec 31 Dec 31 Dec 31 Dec 31 Dec 31 Dec 30 Jun
(%, As at)
2006 2007 2008 2009 2010 2011 2012 2013 2014 2015
Tampines Mall 100.0 100.0 100.0 100.0 100.0 100.0 100.0 100.0 99.5 100.0
Junction 8 100.0 100.0 100.0 100.0 100.0 100.0 99.6 99.4 100.0 100.0
Funan DigitaLife Mall 99.6 99.7 99.8 99.3 100.0 100.0 100.0 98.2 97.9 96.2
(2) (2)
IMM Building (1) 99.0 99.9 100.0 99.7 100.0 100.0 98.1 99.0 96.0 89.0
Plaza Singapura 100.0 100.0 99.8 100.0 100.0 100.0 91.3 100.0 100.0 100.0
Bugis Junction 100.0 100.0 100.0 100.0 100.0 100.0 100.0 100.0 100.0 100.0
(2)
Other assets (3) 100.0 100.0 100.0 99.8 99.8 80.9 100.0 100.0 100.0 98.7
(1) 99.3 100.0 100.0 100.0 99.6 100.0 100.0 100.0 100.0 100.0
Raffles City Singapore
(2)
Lot One Shoppers' Mall 92.7 99.3 99.9 99.6 99.7 99.8 100.0 100.0 99.7
(2)
Bukit Panjang Plaza 99.9 100.0 99.8 100.0 100.0 100.0 99.8 100.0 98.2
(4) (2)
The Atrium@Orchard 98.0 99.1 93.5 65.5 95.3 99.5 99.9 98.5
Clarke Quay 100.0 100.0 97.9 100.0 95.9 85.2
(2)
JCube 99.6 100.0 96.0 82.3
Bugis+ 99.5 100.0 100.0 97.3
Westgate 85.8 97.7 96.4
CMT Portfolio 99.5 99.6 99.7 99.8 99.3 94.8 98.2 98.5 98.8 96.4
(3.6)
(1) Based on retail leases only.
(2) Lower occupancy rates were mainly due to asset enhancement works.
(3) Other assets include:
a) Sembawang Shopping Centre, except for 2007 and 2008 when it underwent an AEI;
b) Rivervale Mall;
c) Hougang Plaza, until it was sold in 2012;
d) JCube, except from 2008 to 2011 when it underwent an AEI. The asset was classified separately from 2012 onwards; and
e) Bugis+, which was acquired in 2011 and subsequently underwent an AEI from November 2011 to July 2012.
The asset was classified separately from 2012 onwards.
(4) Includes retail and office leases.
20 USA Non-Deal Roadshow *September 2015*Asset Enhancement Initiatives
Koh Meng Hua, CapitaLand ‘Building People’ Photography Competition 2014
21 USA Non-Deal Roadshow *September 2015*
WestgateAsset Enhancements Initiatives(1)
About S$100.0 million Spent Per Year(2)
IMM Building JCube Plaza Singapura
Bukit Panjang Plaza Junction 8 Clarke Quay
(1) Includes regular capital expenditures.
(2) Based on the average amount spent over the past five years (2010-2014) and excludes joint ventures.
22 USA Non-Deal Roadshow *September 2015*On-going AEIs
Kwek Swee Seng (Singapore) Artist’s Impression
Malls IMM Building Tampines Mall Clarke Quay Bukit Panjang Plaza Singapura
Plaza
Target Completion - 4Q 2015 4Q 2015 3Q 2016 4Q 2016
Date
Estimated Capital - S$36.00 mil (1) - S$18.49 mil (2) S$38.0 mil
Expenditure
Area of work Phase 2 Converting L5 roof Reconfiguration of Expansion of CSFS Upgrading of floor
reconfiguration area into new Block C to house space on L4, finishes,
works to house leasable space, new create a new 2- railings/atrium void
more outlet stores reconfiguration of entertainment and storey F&B block edges, ceilings,
and enhance the retail units at L2/ F&B tenants on L2, relocation corridor lighting
outlet shopping L3, rejuvenation of roof garden and design
experience works (new from L2 to L4, treatment of
facade, covered rejuvenation works escalators,
walkway from (new facade, upgrading of
Tampines MRT replacement of toilets and lift
station) skylight and lobbies, upgrading
upgrading of of existing nursing
escalators) rooms and
providing
additional nursing
rooms on Level 2
(1) Excludes capital expenditure of approximately S$29.22 mil for rejuvenation works.
(2) Excludes capital expenditure of approximately S$14.18 mil for rejuvenation works.
23 USA Non-Deal Roadshow *September 2015*IMM Building – Phase 2
Enhanced shopping experience More outlet stores
Setback shop fronts
New void to 2nd Storey Plan
improve visibility
24 USA Non-Deal Roadshow *September 2015*Tampines Mall
Modern facade Upgraded covered
Additional leasable
walkway from
BEFORE AFTER space on Level 5(1) MRT station(1)
Target completion date : 4Q 2015
Value creation
• Capital Expenditure(2): S$36.00 million
• Incremental Gross Revenue p.a.(3): S$3.4 million
• Incremental NPI p.a.(3): S$2.9 million
• Return on Investment(3): 8.0%
(1) Artist’s impression.
(2) Excludes capital expenditure of S$29.22 mil for rejuvenation works.
(3) Based on the Manager’s estimates on a stabilised basis, assuming 100.0% occupancy rate and excluding
rejuvenation works.
25 USA Non-Deal Roadshow *September 2015*Clarke Quay
Completion of the Reconfiguration of Space in Block A
On-going AEI works: Reconfiguration of Block C New entertainment options
• About 57,000 sq ft of space is
Before (Occupied by single tenant) After (Reconfigured into multiple units)(1)
being reconfigured to house
new entertainment and F&B
tenants
• Landlord works are being
carried out from 2Q 2015 to
4Q 2015 and units will be
Level 1 Level 1
handed over in phases
• Zouk – one of the world’s top
dance clubs – will take up
about 31,000 sq ft of space
and is targeted to open in
Level 2 Level 2
June 2016
Target completion date : 4Q 2015
(1) The plans are subject to change.
USA Non-Deal Roadshow *September 2015*
26Bukit Panjang Plaza
Completion of F&B block On-going AEI works
• Reconfiguration of space (Level 3
and the main entrance at Level 2)
• Relocation of roof garden from
Level 2 to Level 4
• Rejuvenation works (fresh facade,
replacement of skylight, upgrading
of single file escalators)
Value creation
• Capital Expenditure(1) : S$18.49 million
• Incremental NPI p.a.(2): S$1.48 million
• Return on Investment(2): 8.0%
Target completion date : 3Q 2016
(1) Excludes capital expenditure of S$14.18 mil for rejuvenation works.
(2) Based on the Manager’s estimates on a stabilised basis, assuming 100.0% occupancy rate and excluding
rejuvenation works.
USA Non-Deal Roadshow *September 2015*
27Plaza Singapura
Upgrading Amenities and Enhancing Shoppers’ Experience
Rejuvenation of its interior(1) Rejuvenation of its interior(1)
Joseph Don Tormes, CapitaLand ‘Building People’ Photography Competition 2013
Upgrading of toilets(1) Providing more nursing rooms(1)
• Upgrading of floor finishes, railings/atrium void edges, ceilings, corridor lighting and
design treatment of escalators
• Upgrading of toilets and lift lobbies
• Upgrading of existing nursing rooms and providing additional nursing rooms on Level 2
• Capital Expenditure: S$38.00 million Target completion date : 4Q 2016
(1) Artist’s impression.
USA Non-Deal Roadshow *September 2015*
28Chan Wai Meng, CapitaLand ‘Building People’ Photography Competition 2014
29 USA Non-Deal Roadshow *September 2015*
Plaza Singapura and The Atrium@OrchardAcquisition & Development Track Record
– From 3 to 16 Assets(1)
Investment criteria: Sources: - 13 Acquisitions
• potential growth in yield • 3rd party 1 Divestment
• rental sustainability • CapitaLand Limited 1 Greenfield Development
• potential for value creation • Greenfield developments
27.2% stake in CRS(2)
Divestment
Remaining 72.8% Hougang
Hougang stake in CRS (2) Plaza
Plaza(3)
2003 2005 2007 2010 2012
2002 2004 2006 2008 2011 2013
IPO The
Atrium@Orchard
(40.0% stake)
(1)
(30.0% stake)
(20.0% stake(4))
(1) 16 assets, after divestment of Hougang Plaza in June 2012 and commencement of mall operations in Westgate on 2 December 2013.
(2) Acquisition of Class “E” bonds issued by CapitaRetail Singapore Limited ("CRS") which owned Lot One Shoppers’ Mall, Bukit Panjang
Plaza (90 out of 91 strata lots) and Rivervale Mall.
(3) 92.4% stake purchase; 100% of the strata area was acquired in June 2006.
(4) 14.6% stake as at 30 June 2015.
30 USA Non-Deal Roadshow *September 2015*Proposed Acquisition of Bedok Mall
• The proposed acquisition of all the
units in Brilliance Mall Trust which
holds Bedok Mall
• The proposed issuance of 72.0
million new units as partial
consideration
• Duly approved by Unitholders at the
EGM on 10 September 2015
• Target date of completion –
Bedok Mall
Expected to be on 1 October 2015
31 USA Non-Deal Roadshow *September 2015*Acquisition of Bedok Mall
• Total acquisition outlay of approximately
S$795.0 million(1)
• Two independent valuers –
- Knight Frank : S$779.0 million
- DTZ : S$781.0 million
• Funded by 72.0 million consideration
units issued as partial consideration and
the remainder by debt financing
Bedok Mall
- Aligns the interests of CL with that of
CMT and its minority unitholders as well
as demonstrates CL’s commitment to
support CMT’s growth strategy
(1) Includes agreed value of Bedok Mall - S$780.0 million, other net assets - S$3.1 million, acquisition fee -
S$7.8 million and professional/other expenses - S$4.1 million
32 USA Non-Deal Roadshow *September 2015*Total Acquisition Outlay
S$’million (est.)
Approx. S$464.0 million
Purchase consideration(1) 180.0 payable to vendors through
consideration units and cash
Repayment of existing unitholders’ 284.0
loan owed by BMT(1) S$’million
(est.)
Repayment of bank loan owed by 319.1
BMT Agreed 780.0
market (equiv. to
Subtotal 783.1 value of S$3,506 per
Bedok sq ft of NLA)
Acquisition fee(2) 7.8
Mall(3)
Professional and other fees and 4.1
expenses Other net 3.1
Total acquisition outlay 795.0 assets
(est.)
(1) Prior to the completion date, BMT will capitalise a portion of the loans owed by BMT to each of the Vendors into units in BMT such that the existing
unitholders’ loans will be approximately S$284.0 million immediately prior to the completion date. The estimated purchase consideration of
approximately S$180.0 million is based on such aforementioned adjustments to take into account the capitalisation of BMT to be completed by the
completion date. The final purchase consideration payable to the vendors on completion will be subject to adjustments for BMT’s NAV on
completion date. Accordingly, the actual amount of the purchase consideration payable to the vendors will only be determined after the
completion date.
(2) Acquisition fee is computed based on 1.0% of the property value. As the acquisition will constitute an ‘interested party transaction’ under Appendix
6 of the Code on Collective Investment Schemes (the ‘Property Funds Appendix’) issued by the Monetary Authority of Singapore (‘MAS’), the
acquisition fee units, shall not be sold within one year from the date of issuance in accordance with Paragraph 5.6 of the Property Funds Appendix.
(3) In accordance with paragraph 5.1(d) of the Property Funds Appendix, Bedok Mall is acquired from the interested parties at a price not more than
the higher of the two assessed values.
33 USA Non-Deal Roadshow *September 2015*Demographics at Bedok
Higher Potential Spending Supported by Large Population
with a Relatively Higher Income
Top 10 Largest Estates in Singapore Distribution of Population by Monthly Income Bracket (1)
Resident
Planning Area
Population
National
Average
Bedok 294,519
Jurong West 267,524
Tampines 261,743
Woodlands 245,109 Bedok
Hougang 216,697
Yishun 185,214
0% 10% 20% 30% 40% 50% 60% 70% 80% 90% 100%
Ang Mo Kio 179,297
No Working Person Below $1,000 $1,000 - $1,999 $2,000 - $2,999
Choa Chu Kang 173,291 $3,000 - $3,999 $4,000 - $4,999 $5,000 - $5,999 $6,000 - $6,999
Sengkang 167,054 $7,000 - $7,999 $8,000 - $8,999 $9,000 - $9,999 $10,000 & Over
1. Monthly income bracket for resident working persons aged 15 years and over.
Bukit Merah 157,122
Source: Census of Population 2010, Singapore Department of Statistics.
Source: Census of Population 2010,
Singapore Department of Statistics.
34 USA Non-Deal Roadshow *September 2015*Location Map of Bedok Mall 35 USA Non-Deal Roadshow *September 2015*
Sectional Plan

                                         2

     Storey       Main Trade Categories
     Level 2      Food & Beverage
     Level 1      Fashion, Jewellery, Food & Beverage, Services
     Basement 1   Fashion, IT, Electronics, Home, Gifts, Casual Dining
     Basement 2   Books & Stationery, Services, Convenience Stores, Supermarket

36                              USA Non-Deal Roadshow *September 2015*
Bedok Mall
Site Area 268,045 sq ft and subterranean
space of 2,271 sq ft
Gross Floor Area 335,573 sq ft
Net Lettable Area 222,464 sq ft
Car Park Lots 265
Number of leases 201
Land Tenure 99-year lease with effect from
21 November 2011
Committed 99.3%
Occupancy
311 New Upper Changi Road
Average shopper 1.4 million per month Singapore 467360
traffic
Valuation (including Knight Frank Pte Ltd : S$779.0 million
fixed assets) DTZ Debenham Tie Leung (SEA) Pte
as at 30 June 2015 Ltd : S$781.0 million
Note: Above information based on 31 December 2014, except for shopper traffic and valuations.
Shopper traffic is for the first six months of 2015.
37 USA Non-Deal Roadshow *September 2015*Method of Financing
S$’million
(1)
Consideration units 151.2
Acquisition fee in units 7.8
Bank borrowings 636.0
Total acquisition outlay 795.0
(1) Based on the 72,000,000 new units to be issued as consideration units, and on an illustrative price of
S$2.10 per consideration unit (purely for illustrative purposes only), the consideration units would be
valued at approximately S$151.2 million. For reference, CMT’s volume weighted average price (‘VWAP’)
for the 10 business days immediately preceding the date of the unit purchase agreement is S$2.15 and
CMT’s VWAP for the 10 business days immediately preceding the Latest Practicable Date is S$2.06.
Accordingly, S$2.15 was used as an illustrative price in the announcement made on the SGXNet dated
14 July 2015, while an illustrative price of S$2.10 is used in this Circular.
38 USA Non-Deal Roadshow *September 2015*Method of Financing
1
Consideration Units
- 72.0 million consideration units (which is approximately 2.1% of the
total number of units in issue) to be issued as partial consideration to
the vendors (or the vendors’ nominees)
(~S$151.2(1) million based on illustrative price of S$2.10 per unit)
- Units will be priced at 10 business days VWAP immediately preceding
the date of completion
- Aligns the interests of CapitaLand (‘CL’) with that of CMT and its
minority unitholders
- Demonstrates CL’s commitment to support CMT’s growth strategy
2
Acquisition Fees in Units (1.0%)
- S$7.8 million to be paid in units to CMTML with 1-year moratorium(2)
(1) Based on the 72,000,000 new units to be issued as consideration units, and on an illustrative price of S$2.10 per consideration unit (purely for illustrative
purposes only), the consideration units would be valued at approximately S$151.2 million. For reference, CMT’s VWAP for the 10 business days
immediately preceding the date of the unit purchase agreement is S$2.15 and CMT’s VWAP for the 10 business days immediately preceding the Latest
Practicable Date is S$2.06. Accordingly, S$2.15 was used as an illustrative price in the announcement made on the SGXNet dated 14 July 2015, while an
illustrative price of S$2.10 is used in this Circular.
(2) As the Acquisition will constitute an ‘interested party transaction’ under Property Funds Appendix issued by MAS, the acquisition fee units shall not be
sold within one year from the date of issuance in accordance with Paragraph 5.6 of the Property Funds Appendix.
39 USA Non-Deal Roadshow *September 2015*Method of Financing
3 Remaining Balance (80.0% of the total acquisition outlay)
- For illustration purpose only, assuming remaining balance of the total
acquisition outlay (S$636.0 million(1)) financed by bank borrowings or
an equity placement and bank borrowings
Aggregate Leverage
37.1% 35.7%
33.7%
Illustration A: Illustration B:
As at 30 June 2015
Assuming 72.0 million Assuming 72.0 million
consideration units with the consideration units with the
remaining balance financed remaining balance financed
by bank borrowings by an equity placement and
bank borrowings
(1) After issuance of consideration units and units issued as payment for the S$7.8 million acquisition fee at the
illustrative unit price of S$2.10 (purely for illustrative purpose only).
40 USA Non-Deal Roadshow *September 2015*Rationale for and Benefits of the Acquisition
1
The Acquisition is in line with CMT’s investment strategy
2 Broadens CMT’s asset base with increased exposure to
the necessity shopping segment
3 Enables CMT to capitalise on the competitive strengths of
Bedok Mall and its location to strengthen its portfolio
4
Provides revenue diversification for CMT
5
Alignment of interests with the issuance of consideration units
41 USA Non-Deal Roadshow *September 2015*1 The Acquisition is in Line with CMT’s
Investment Strategy
CMT’s principal strategy of
investing in quality income-
producing assets which are
used, or predominantly used,
for retail purposes primarily in
Singapore
Unitholders will enjoy a higher
DPU due to the attractive
cash flows that Bedok Mall
generates
42 USA Non-Deal Roadshow *September 2015*1 The Acquisition is in Line with CMT’s
Investment Strategy
Property yield of approximately 5.2%(1)
DPU accretion of 1.7% and 1.0% for Illustration A and Illustration B
respectively
DPU for Forecast Period 2015 (annualised) (cents)
10.89 10.82
10.71
Existing
Portfolio
Enlarged
Portfolio
1.7% 1.0%
As at 30 June 2015 Illustration A: Illustration B:
Assuming 72.0 million Assuming 72.0 million
consideration units with the consideration units with the
remaining balance financed remaining balance financed
by bank borrowings by an equity placement and
bank borrowings
(1) Property yield is calculated as the annualised net property income (‘NPI’) for the forecast period from 1 October
2015 to 31 December 2015 (‘Forecast Period 2015’) over the Agreed Value of Bedok Mall.
43 USA Non-Deal Roadshow *September 2015*2 Broadens CMT’s Asset Base with Increased
Exposure to Necessity Shopping Segment
Further strengthen CMT’s position as the largest real estate investment trust
in Singapore(1)
Growth in the size of the total deposited property of CMT
S$11.0 billion
S$10.3 billion(1)
Pre-Acquisition Post-Acquisition
(1) As at 30 June 2015.
44 USA Non-Deal Roadshow *September 2015*2 Broadens CMT’s Asset Base with Increased
Exposure to Necessity Shopping Segment
Strengthen the asset profile by increasing exposure to necessity shopping malls,
which have shown resilience over the years
25.5% 23.8%
Existing Enlarged
Property Property
Portfolio Portfolio
74.5% 76.2%
(1)
Percentage of CMT’s Portfolio by FY2014 Gross Revenue
Necessity Shopping (2) Discretionary Shopping (3)
(1) Based on gross revenue for FY2014, except for Bedok Mall which is based on Bedok Mall’s annualised gross revenue for the
Forecast Period 2015.
(2) In relation to the existing property portfolio, necessity shopping malls comprise Tampines Mall, Junction 8, IMM Building, Plaza
Singapura, Bugis Junction, Sembawang Shopping Centre, Rivervale Mall, JCube, Lot One Shoppers’ Mall, Bukit Panjang
Plaza, The Atrium@Orchard and CMT’s 30.00% interest in Westgate. In relation to the enlarged property portfolio, necessity
shopping malls comprise the above mentioned malls and Bedok Mall.
45 (3) Comprises Funan DigitaLife Mall, Clarke Quay, USA Non-Deal
Bugis+ andRoadshow *September
CMT’s 40.00% interest2015*
in Raffles City Singapore.Enables CMT to Capitalise on the Competitive
3
Strengths of Bedok Mall and its Location to
Strengthen its Portfolio
Serves large and growing residential catchment
- Bedok is the largest estate in Singapore in terms of population
- Residential population likely to increase, in view of upcoming
private and public residential developments in the vicinity to be
completed over the next few years
- Bedok Residences obtained its temporary occupancy permit in
May 2015
- New amenities in Bedok. These include Bedok bus interchange,
new hawker centre, Bedok Town Plaza, Bedok Integrated Complex
and the Downtown Line MRT stations
46 USA Non-Deal Roadshow *September 2015*Enables CMT to Capitalise on the Competitive
3
Strengths of Bedok Mall and its Location to
Strengthen its Portfolio
Excellent Transport Connectivity
Integrated Bedok Bus Interchange
at Level 2
Underground pass to Bedok MRT
Station
Close proximity to both the Pan Island
Expressway and East Coast Parkway
47 USA Non-Deal Roadshow *September 2015*Enables CMT to Capitalise on the Competitive
3
Strengths of Bedok Mall and its Location to
Strengthen its Portfolio
Largest Mall in Bedok with Strong Operational Performance
High occupancy rate of 99.3% as at 31 December 2014
1H 2015 Average Shopper Traffic Approximately 1.4M/Month
(+22.4% Y-o-Y )
48 USA Non-Deal Roadshow *September 2015*4 Provides Revenue Diversification for CMT
Percentage Percentage
Contribution by Contribution by
Existing Property Enlarged Property
Improves revenue diversification Portfolio(1) to the Portfolio(1) to the
and reduces the reliance of the CMT Group’s Gross CMT Group’s Gross
Revenue Revenue
CMT group’s revenue stream on Tampines Mall 9.7% 9.0%
any single property Junction 8 7.4% 6.9%
- Maximum contribution to the Funan DigitaLife Mall 4.3% 4.0%
CMT group’s gross revenue by IMM Building 9.9% 9.2%
any single property will Plaza Singapura 11.5% 10.7%
decrease from 12.0% to 11.2% Bugis Junction 10.2% 9.5%
following the Acquisition Sembawang Shopping Centre
3.1% 2.9%
and Rivervale Mall
- Diversify revenue stream and
JCube 4.1% 3.9%
strengthen CMT’s market
Lot One Shoppers’ Mall 5.5% 5.2%
presence in the eastern region
Bukit Panjang Plaza 3.4% 3.2%
of Singapore
The Atrium@Orchard 6.8% 6.3%
Clarke Quay 5.0% 4.6%
40.00% interest in Raffles City
12.0% 11.2%
Singapore
Bugis+ 4.2% 3.9%
30.00% interest in Westgate 2.9% 2.7%
Bedok Mall - 6.8%
Total 100.0% 100.0%
(1) Based on gross revenue for FY2014, except for Bedok Mall which is based on Bedok Mall’s annualised
gross revenue for the Forecast Period 2015.
49 USA Non-Deal Roadshow *September 2015*5 Alignment of Interests with the Issuance of
Consideration Units
Issuance of consideration units to the Vendors (or the Vendors’
Nominees)
- Aligns the interests of CL with that of CMT and its minority
unitholders
- Also demonstrates CL’s commitment to support CMT’s
growth strategy
50 USA Non-Deal Roadshow *September 2015*51
Looking Forward
USA Non-Deal Roadshow *September 2015*
Clarke Quay
Lim King Chuan, CapitaLand ‘Building People’ Photography Competition 2014Looking Forward
1. Refresh. Rejuvenate. Reinforce
• Reinforce Clarke Quay’s position as a premier
nightspot destination
• Strengthen IMM Building’s position as Singapore’s
largest outlet mall
• Enhance shoppers’ experience at Plaza Singapura
IMM Building
• Rejuvenate through enhancement works at Bukit
Panjang Plaza and Tampines Mall
2. Explore new opportunities to strengthen our portfolio
• Acquisition of properties
• Greenfield developments
Bukit Panjang Plaza
3. Continue to reconstitute and optimise CMT’s portfolio
52 USA Non-Deal Roadshow *September 2015*Photo Credit: Kwek Swee Seng, Singapore
Photo Credit: Kwek Swee Seng, Singapore
Thank you
For enquiries, please contact: Ms Audrey Tan, Investor Relations,
Direct: (65) 6713 1507 Email: audrey.tan@capitaland.com
CapitaLand Mall Trust Management Limited (http://www.cmt.com.sg)
168 Robinson Road, #30-01 Capital Tower, Singapore 068912
53
Tel: (65) 6713 2888; Fax: (65) 6713 2999Annexes
USA Non-Deal Roadshow *September 2015*
Bugis JunctionCapitaLand Mall Trust
– Major REIT in CapitaLand Group
• Regional Investments 1
• CapitaLand Fund
Management
CapitaLand CapitaLand CapitaLand The Ascott
China Mall Asia Singapore 2 Limited
CapitaLand CapitaLand CapitaMalls CapitaLand Ascott
Retail China Trust Mall Trust Malaysia Trust Commercial Residence Trust
Trust
Group Managed Real Estate Assets* (as at 30 June 2015): S$73.1 billion
1 Include StorHub and businesses in Vietnam, Indonesia, Japan and others
2 Includes portfolio in Malaysia
* Refers to total value of all real estate managed by CapitaLand Group entities stated at 100% of property carrying value
2
55 USA Non-Deal Roadshow *September 2015*Singapore REIT Landscape
CMT: Largest S-REIT by Market Capitalisation(1) and Asset Size;
‘A2’ Issuer Rating
Total Assets
38 REITs and business trusts in Singapore
(S$ million)
(2)
12,000
10,000
CMT
Suntec
8,000
AREIT KREIT
CCT Fortune
6,000
MGCCT
MLT
ART MCT
4,000
MINT
SPH
Starhill
FEHT
CRCT CDREIT FCOT
FCT OUEHT
2,000
LippoMall
AIM AMP Parkway ASCHT
Ascendas India Cambridge
FIRT
0
20% 25% 30% 35% 40% 45% 50%
Total Debt / Total Assets
Source: Bloomberg and companies data
(1) Size of bubble denotes market capitalisation and balance sheet data as at 1 September 2015.
(2) As at 1 September 2015.
56 USA Non-Deal Roadshow *September 2015*Market Leadership in Singapore Retail
S$7.4b 16 S$10.3b 5.7m 12-year
Market Properties in Total Deposited sq ft NLA(3) Track Record
Capitalisation(1) Singapore Properties(1)(2)
Westgate (30% stake) Raffles City Singapore (40% stake) IMM Building JCube Rivervale Mall
Plaza Singapura Clarke Quay Tampines Mall Sembawang SC Bugis+
Bukit Panjang Plaza Junction 8 Funan DigitaLife Mall Bugis Junction Lot One Shoppers’ Mall The Atrium@Orchard
(1) Above information as at 30 June 2015.
(2) Including CMT’s share of the total deposited properties in RCS Trust (40.0%) and Infinity Trusts (30.0%).
(3) Based on total NLA, including retail, office and warehouse.
57 USA Non-Deal Roadshow *September 2015*Strategically Located Portfolio
- Close Proximity to Public Transport and Population Catchments
- Create and Offer Lifestyle Shopping Experiences
~3,000 leases(1)
~27 million mall visitors each month(1)
(1) Includes Westgate (30% stake) which commenced operations in December 2013 and excludes Bedok Mall.
58 USA Non-Deal Roadshow *September 2015*Consistent Performance Over Time
Gross Revenue (S$ million)
774.2
729.2
661.6 115.3
630.6 91.6
581.1 88.4 (1) 658.9
(1)
86.8 637.6
81.3 (1) 573.2
(1)
(1) 543.8
499.8
2010 2011 2012 2013 2014
(2)
CMT Joint ventures (For information only)
Distributable Income (S$ million) Distribution Per Unit (cents)
356.2 375.3 10.84
301.6 316.9 10.27
294.8
9.37 9.46
9.24
2010 2011 2012 2013 2014 2010 2011 2012 2013 2014
(1) With the adoption of Financial Reporting Standards 111 Joint Arrangements from 1 January 2014, CMT’s 40.0% interest in RCS Trust and 30.0% interest in Infinity
Mall Trust and Infinity Office Trust (collectively, the Infinity Trusts) are accounted for as investments in joint ventures using equity method. For comparison purpose,
2010 to 2013 have been restated to exclude CMT’s 40.0% interest in RCS Trust and CMT’s 30.0% interest in Infinity Trusts.
(2) Joint ventures refer to CMT’s 40.0% interest in RCS Trust and CMT’s 30.0% interest in Infinity Trusts. Westgate, which is owned by Infinity Mall Trust, commenced
operations on 2 December 2013.
59 USA Non-Deal Roadshow *September 2015*Loyalty Programmes
1 2 3
1
CapitaVoucher CapitaCard CAPITASTAR
S$325.6
S$59.2 million
card spend
654,000
million CAPITASTAR members
Launched in 2011
Sold 256,000
Launched in 2005
card members
Launched in 2006
(1) Above information as at 31 December 2014 or year ended 31 December 2014.
60 USA Non-Deal Roadshow *September 2015*Available Retail Floor Space
Retail Space at End-2014: 63.5 million sq ft, of which 45.8% is
estimated to be shopping centre floor space
Singapore Retail Floor Space Supply(1) (million sq ft)
8
61 USA Non-Deal Roadshow *September 2015*Fairly Resilient Retail Rentals
Suburban Retail Rentals Are Especially Resilient to Economic Downturns
Singapore Retail Rentals and Quarterly GDP Growth
8.0% 38
6.0%
36
4.0%
34
2.0%
0.0% 32
-2.0%
30
-4.0%
28
-6.0%
-8.0% 26
3Q07
1Q12
1Q04
3Q04
1Q05
3Q05
1Q06
3Q06
1Q07
1Q08
3Q08
1Q09
3Q09
1Q10
3Q10
1Q11
3Q11
3Q12
1Q13
3Q13
1Q14
3Q14
1Q15
GDP Growth (Q-o-Q) Orchard Retail Rent (S$ psf pm) Suburban Retail Rent (S$ psf pm)
Sources: CBRE and Singapore Department of Statistics
9
62 USA Non-Deal Roadshow *September 2015*Population Growth Drives Local Consumption
Singapore’s Population Estimated to Reach ~ 6.5 - 6.9 Million by 2030(1)
Singapore Population
'000 YoY change
6,000 6%
5%
5,000
4%
4,000
3%
3,000 2%
1%
2,000
0%
1,000
-1%
0 -2%
2001
2008
1983
1984
1985
1986
1987
1988
1989
1990
1991
1992
1993
1994
1995
1996
1997
1998
1999
2000
2002
2003
2004
2005
2006
2007
2009
2010
2011
2012
2013
2014
Non-Residents Singapore Residents % Growth Rate of Total Population
Source: Singapore Department of Statistics
(1) Singapore Population White Paper, January 2013
10
63 USA Non-Deal Roadshow *September 2015*11
64
0.0%
1.0%
3.0%
4.0%
5.0%
6.0%
2.0%
Jun-90
Dec-90
Jun-91
Dec-91
Source: Bloomberg
Jun-92
Dec-92
Jun-93
Dec-93
Jun-94
Dec-94
Jun-95
Dec-95
Jun-96
Dec-96
Jun-97
Dec-97
Jun-98
Dec-98
Jun-99
Average (2001 – 2Q 2015): 2.6%
Dec-99
Jun-00
Dec-00
Jun-01
Dec-01
Jun-02
Dec-02
Jun-03
Dec-03
Low Unemployment Rate
Jun-04
Dec-04
Jun-05
Dec-05
Jun-06
USA Non-Deal Roadshow *September 2015*
Dec-06
Jun-07
Singapore’s Overall Unemployment Rate
Dec-07
Jun-08
Dec-08
Jun-09
Dec-09
Jun-10
Dec-10
Jun-11
Dec-11
Jun-12
Dec-12
Jun-13
Dec-13
Jun-14
Dec-14
Singapore Has One of the Lowest Unemployment Rates Internationally
Jun-15Singapore Households Have Strong Balance Sheets
Singaporeans Have One of the Highest Percentages of Home
Ownership in the World
Household Assets & Liabilities
S$’bill
1,700
1,500
1,300
1,100
900
700
500
300
100
-100 2007 2008 2009 2010 2011 2012 2013 2014
Shares & Securities Insurance Funds CPF Balances
Cash & Deposits Property Total Liabilities
Source: Yearbook of Statistics Singapore, 2015 by Department of Statistics, Ministry of Trade & Industry,
Republic of Singapore
12
65 USA Non-Deal Roadshow *September 2015*STB Launching Global Marketing Campaign
to Boost Tourist Arrivals
Singapore Tourist Arrivals Upcoming Developments
million
15.1 (2015*)
18 –
15.5 15.1 15.5
16 14.5
14
12
Changi Terminal 4 (2017*) &
10 Project Jewel (2018*)
8
6
4 Global
Financial
2 SARS Crisis
Mandai Makeover (2020*)
-
2002
2003
2004
2005
2006
2007
2008
2009
2010
2011
2012
2013
2014
2015
Tourist Arrivals Forecast
Source: Singapore Tourism Board (STB), Speech by Mr S Iswaran, Second Minister for Trade and Industry, 6 March 2015
(2015 estimate tourist arrivals)
* Subject to change
66 USA Non-Deal Roadshow *September 2015*1H 2015 Gross Revenue (1)
decreased by 0.6% versus 1H 2014
On Comparable Mall Basis (2), 1H 2015 Gross Revenue Down 1.2% Y-o-Y
CMT Portfolio 326.9
37.7 329.0
Tampines Mall 37.2 0.6%
Junction 8 28.9
28.2
Funan DigitaLife Mall 16.9
16.6
36.4
IMM Building 39.2
Plaza Singapura 45.8
44.4 Mainly due to:
41.7 • Lower occupancy at Clarke Quay and
Bugis Junction
38.1 JCube
13.1
JCube 16.9 • Ongoing AEI at IMM Building and Bukit
21.7 Panjang Plaza
Lot One Shoppers' Mall 21.4
Bukit Panjang Plaza 12.7
13.3
The Atrium@Orchard 26.2
26.2
Clarke Quay 17.5
19.4
Bugis+ 16.3
(3)
16.2 1H 2015 1H 2014
Other Assets 12.0
11.9
S$ million
(1) Excluding JCube and Clarke Quay, 1H 2015 gross revenue increased by 1.2% Y-o-Y.
(2) Excludes IMM Building (which has been undergoing phase two AEI since July 2014) and Bugis Junction (which underwent
phase two AEI from March 2014 to September 2014).
(3) Includes Sembawang Shopping Centre and Rivervale Mall.
67 USA Non-Deal Roadshow *September 2015*1H 2015 Operating Expenses
(1)
decreased by 0.9% versus 1H 2014
On Comparable Mall Basis (2), 1H 2015 OPEX Up 1.6% Y-o-Y
CMT Portfolio 99.7
100.7 0.9%
Tampines Mall 10.1
9.9
Junction 8 8.1
7.8
Funan DigitaLife Mall 5.6
5.5
13.1
IMM Building 13.3 Mainly due to lower utilities expenses offset by
Plaza Singapura 11.5
11.6 higher marketing expenses
Bugis Junction 10.5
6.2 12.5
JCube 6.2
Lot One Shoppers' Mall 6.6
6.4
Bukit Panjang Plaza 4.7
4.4
The Atrium@Orchard 6.7
6.2
Clarke Quay 6.9
7.3
Bugis+ 5.0 1H 2015 1H 2014
5.0
(3)
Other Assets 4.7
4.6 S$ million
(1) Excluding JCube and Clarke Quay, 1H 2015 operating expenses decreased by 0.7% Y-o-Y.
(2) Excludes IMM Building (which has been undergoing phase two AEI since July 2014) and Bugis Junction (which underwent
phase two AEI from March 2014 to September 2014).
(3) Includes Sembawang Shopping Centre and Rivervale Mall.
68 USA Non-Deal Roadshow *September 2015*1H 2015 Net Property Income
(1)
decreased by 0.5% versus 1H 2014
On Comparable Mall Basis (2), 1H 2015 NPI Down 2.3% Y-o-Y
CMT Portfolio 227.2
27.6 228.3
Tampines Mall 27.3 0.5%
Junction 8 20.8
20.4
Funan DigitaLife Mall 11.3
11.1
23.3
IMM Building 25.9
Plaza Singapura 34.3
32.8
Bugis Junction 31.2
6.9 25.6
JCube 10.7
Lot One Shoppers' Mall 15.1
15.0
Bukit Panjang Plaza 8.0
8.9
The Atrium@Orchard 19.5
20.0
Clarke Quay 10.6
12.1
Bugis+ 11.3
11.2 1H 2015 1H 2014
Other Assets
(3) 7.3
7.3
S$ million
(1) Excluding JCube and Clarke Quay, 1H 2015 net property income increased by 2.0% Y-o-Y.
(2) Excludes IMM Building (which has been undergoing phase two AEI since July 2014) and Bugis Junction (which underwent
phase two AEI from March 2014 to September 2014).
(3) Includes Sembawang Shopping Centre and Rivervale Mall.
69 USA Non-Deal Roadshow *September 2015*(1)
1H 2015 Performance of Joint Ventures
1H 2015 Net Property Income Up 6.7% Y-o-Y
Gross Revenue (S$ million)
59.6
Total
57.1
Total
47.3 4.3%
Raffles City Singapore
46.4
12.3
Westgate
10.7
Operating Expenses (S$ million)
Total 16.0
16.2 Total
1.6%
Raffles City Singapore 12.4
12.4
Westgate 3.6
3.8
Net Property Income (S$ million)
43.6 Total
Total 6.7%
40.9
Raffles City Singapore 34.9
34.0
Westgate 8.7
6.9 Mainly due to higher occupancy at
Westgate
1H 2015 1H 2014
(Charts are of different scales)
(1) This relates to CMT’s 40.0% interest in Raffles City Singapore and 30.0% interest in Westgate.
70 USA Non-Deal Roadshow *September 2015*You can also read