AVENTUS RETAIL PROPERTY FUND - 15 FEBRUARY 2017 2017 - Aventus Group

Page created by Heather Lang
 
CONTINUE READING
AVENTUS RETAIL PROPERTY FUND - 15 FEBRUARY 2017 2017 - Aventus Group
2017
HALF YEAR
INVESTOR PRESENTATION
AVENTUS RETAIL PROPERTY FUND
15 FEBRUARY 2017
AVENTUS RETAIL PROPERTY FUND - 15 FEBRUARY 2017 2017 - Aventus Group
Contents

Jindalee Home, QLD           Belrose Super Centre, NSW

   03 Strategy                 25 Outlook
   04 Key Achievements         28 Appendix 1 – Portfolio Overview
   06 Portfolio Highlights     31 Appendix 2 – Industry Dynamics
   13 Financial Results
   18 Acquisitions             Speakers
   20 Development              Darren Holland, CEO
                               Lawrence Wong, CFO
AVENTUS RETAIL PROPERTY FUND - 15 FEBRUARY 2017 2017 - Aventus Group
Delivering on Strategy
                           The Fund is implementing its 4 key growth initiatives to drive long term
                                       value creation and sustainable earnings growth

                                                                                                                  Potential Benefits from
             Portfolio                         Development                  Consolidation                         Zoning and
             Management                        Pipeline                     Opportunities                         Planning Reforms

             Optimise and broaden the          Identify and deliver value   Selective acquisitions to             Take advantage of regulatory
Initiative

             tenancy mix through               enhancing development        enhance the Fund’s portfolio          reforms in zoning and planning
             proactive leasing, leveraging     opportunities within the     and entrench the Fund as the          regimes for the existing portfolio
             retailer relationships and        existing portfolio           largest pure-play large format
             delivering operational                                         retail (“LFR”) landlord in
             excellence                                                     Australia

             The portfolio continues to        Completed the expansion of   Acquired adjacent 55,840 sqm          Actively participate and track
             perform well with high            Belrose Super Centre,        development site at Tuggerah          changes to state zoning reforms
Outcome

             occupancy, positive leasing       commenced repositioning of   Super Centre further                  through the Large Format Retail
             spreads and low incentives        the former Bunnings          consolidating control of the retail   Association (“LFRA”); introduced
             from a diverse mix of             tenancy at Sunshine Coast    precinct; maintained disciplined      new retailers and service providers
             national retailers                Home and gained 4            approach to potential                 into the portfolio and commenced
                                               approvals to expand the      acquisitions                          master planning of 2 centres with
                                               development pipeline                                               flexible zoning

Aventus Retail Property Fund | Half Year Results | 31 December 2016                                                                                     3
AVENTUS RETAIL PROPERTY FUND - 15 FEBRUARY 2017 2017 - Aventus Group
Key Achievements
                                        SINGLE SECTOR FOCUS AND SUSTAINABLE INCOME GROWTH

                   Fund Highlights                                          Financial Management                                            Portfolio Performance

                      $34.6m                                              35.0% gearing                                              98.0% occupancy
          Funds From Operations (FFO)1
                                                                       within target range of 30% - 40%                                      ⇧ 30 bps from 97.7%4,7

                   8.8 cents                                                    $2.10 NTA
                                                                                                                                    5% FY17 lease expiries
                    FFO per unit1,2
               on track with guidance3
                                                                                 per unit                                                           ⇩ from 12%4,7
                                                                           ⇧ 4% from $2.02 per unit4

                   7.8 cents                                                           11.2%                                                         $25.1m
              DPU on 90% payout ratio                                          index     outperformance5                                           net valuation ⇧    6

1.   For the 6 months ended 31 Dec 2016
2.   Based on a weighted average number of units of 395.0m
3.   Full year FY17 earnings guidance is FFO per unit of 17.5 – 18.0 cents as at 30 Jun 2016
4.   As at 30 Jun 2016
5.   Total unitholder return for the 6 months ended 31 Dec 2016 outperformance to S&P / ASX 200 A-REIT accumulation index on an annualised basis; Source: Bloomberg
6.   Movement includes adjustments relating to straight-lining of rental income and amortisation of rental guarantees
7.   By GLA

Aventus Retail Property Fund | Half Year Results | 31 December 2016                                                                                                       4
AVENTUS RETAIL PROPERTY FUND - 15 FEBRUARY 2017 2017 - Aventus Group
1. PORTFOLIO HIGHLIGHTS

Sunshine Coast Home, QLD
AVENTUS RETAIL PROPERTY FUND - 15 FEBRUARY 2017 2017 - Aventus Group
Portfolio Highlights

                              FOCUSED ON OPERATIONAL EXCELLENCE AND INCOME OPPORTUNITIES

              4.3 year WALE                                     34% NON-              Increased land holding
                  ⇧ from 4.1 years1,4                         HOUSEHOLD USES              to c. 1.2m sqm
                                                                      ⇧ from 33%1,3        ⇧ from 1.1m sqm1

                    85% OF                                                                      84%
                                                              PORTFOLIO VALUE         NATIONAL RETAILERS3
                   ALL LEASES                                    OF $1.3bn
         have annual fixed or CPI increases
                 ⇧ from 80%1,4                                           ⇧ 3%1

                                                                                              7.40%
     67 LEASES NEGOTIATED OVER GLA of 55,000 SQM2
                                                                                      PORTFOLIO CAP RATE
                                                                                            ⇩ from 7.53%1
                              with low incentives and positive leasing spreads

1.   As at 30 Jun 2016
2.   For the half year ended 31 Dec 2016
3.   By GLA
4.   By gross rent

Aventus Retail Property Fund | Half Year Results | 31 December 2016                                            6
AVENTUS RETAIL PROPERTY FUND - 15 FEBRUARY 2017 2017 - Aventus Group
Diversified National and Publicly Listed Retailers
• National retailers remained steady at 84% of the total portfolio by GLA and the majority of retailers are publicly listed

                                                               PUBLIC                                                                                            % OF
           RANK          RETAIL GROUP                                               STORES1          BRANDS
                                                              COMPANY                                                                                         INCOME1

                                                                                                     Freedom, Snooze, Best & Less, Harris Scarfe, Fantastic
               1         Steinhoff Asia Pacific                                       29 (⇧)2                                                                11% (⇧)2
                                                                                                     Furniture, Plush and Original Mattress Factory

               2         Wesfarmers                                                    12 (⇩).      Bunnings, Officeworks, Coles and 1st Choice Liquor         8% (⇩).
               3         JB Hi-Fi                                                     16 (⇧)2       JB Hi-Fi and The Good Guys                                6% (⇧)2
               4         Super Retail Group                                            20 (⇩).      Supercheap Auto, BCF, Amart Sports and Rebel               5% (⇩).
               5         Harvey Norman                                                  5 (-).      Harvey Norman and Domayne                                 5% (-).
               6         Spotlight Group                                                 9 (-).      Spotlight and Anaconda                                    4% (-).
               7         Woolworths                                                     4 (-).      Masters, Dan Murphy’s, BWS and Woolworths Caltex          3% (-).
               8         Beacon Lighting                                               12 (-).      Beacon Lighting                                           2% (-).
               9         Nick Scali                                                     5 (-).      Nick Scali and Sofas 2 Go                                 2% (-).
              10         Adairs Retail Group                                           11 (-).      Adairs and Adairs Kids                                    2% (-).
                         TOTAL                                                        123       .                                                              48%    .

1. Change represents movement since 30 Jun 2016
2. Increase due to Steinhoff acquisition of Fantastic Holdings and JB Hi-Fi acquisition of The Good Guys

Aventus Retail Property Fund | Half Year Results | 31 December 2016                                                                                                       7
AVENTUS RETAIL PROPERTY FUND - 15 FEBRUARY 2017 2017 - Aventus Group
Expanding the Non-Household Category
• The largest tenant category, non-household goods and services retailers, improve centre performance by driving greater
  weekday traffic, increasing visit frequency and lengthening customer visits and linger time

          Tenancy Mix: AVN vs. Industry (by GLA)1,2                                                     Tenants in the non-household category include:
                                            AVN        Industry
                                                                        comprised of
     34%

           26%
                    30% 30%
                                                                                                 49                         31                         27                         19
                                    20%                                                           Cafés &                   Leisure &                  Fitness &                 Automotive
                                                                                                Restaurants               Sports Stores                 Medical                    Stores

                                                                                                16                         15                          10                        10
                                13%
                                             11%
                                                              10%
                                                  8%      7%
                                                                                        5%

                                                                       2% 2%       2%
                                                                                               Supermarkets,            Pet Showrooms                Offices and              Baby Supplies and
    Non-Household   Furniture    Hardware    Homewares    Electrical   Coverings   Vacant
                                                                                                 Liquor and                                         Government              Children’s Play Centres
        Goods                    & Garden                                                    Convenience Stores                                   Service Providers
      & Services

1. As at 31 Dec 2016, non-household goods includes pet supplies, baby supplies, sporting, camping and leisure, cafes, restaurants, supermarkets, liquor, fitness centres,
   medical centres, offices, chemists and automotive
2. Source: Deep End Services (centres larger than 10,000 sqm) as at 30 Jun 2016

Aventus Retail Property Fund | Half Year Results | 31 December 2016                                                                                                                                   8
AVENTUS RETAIL PROPERTY FUND - 15 FEBRUARY 2017 2017 - Aventus Group
Consistently High Occupancy
                                  PORTFOLIO VACANCY HAS BEEN
                         CONSISTENTLY LOWER THAN THE INDUSTRY AVERAGE1

  8.1%

                                                 7.2%
                                                                6.5%
                                 6.1%                                                                           High occupancy
                                                                           5.8%      5.6%
                                                                                             5.0%
                  5.8%                                                                                          Low incentives
  3.8%
                                                                                                                Positive leasing spreads
                                                 3.1%                                2.9%
                                                                           2.6%
                                                                                             2.3%
                                                                2.0%                                  2.0%
                                 1.6%

                  1.2%

 Jun-09         Jun-10          Jun-11          Jun-12         Jun-13     Jun-14    Jun-15   Jun-16   Dec-16
                                                                     2
                                                AVN Portfolio            National Average

                           Number of LFR centres comprising the AVN Portfolio
     4               6              7               9             11        12        14       20       20

1. Source: Deep End Services (centres larger than 10,000 sqm); By GLA
2. Historical metrics exclude centres prior to acquisition by the Fund

Aventus Retail Property Fund | Half Year Results | 31 December 2016                                                                         9
AVENTUS RETAIL PROPERTY FUND - 15 FEBRUARY 2017 2017 - Aventus Group
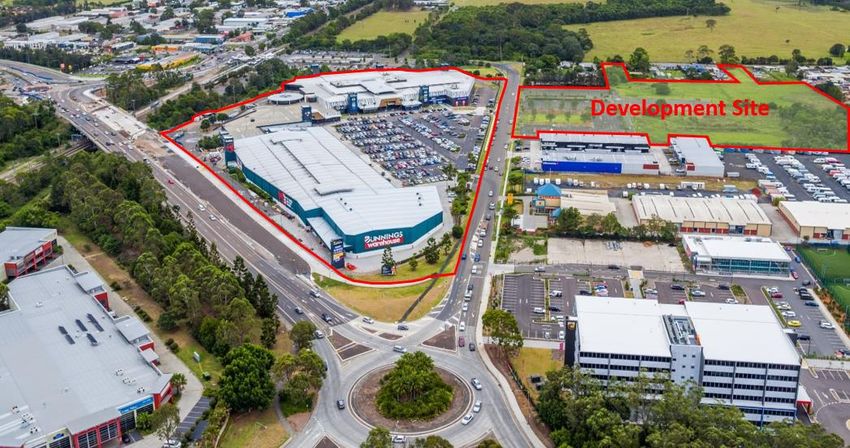
Staggered Lease Expiry Profile
and Structured Rent Increases
• Proactive leasing has resulted in 67 leases being negotiated in 1H17 resulting in FY17 expiries being reduced from 12% to 5%
• Increased the number of leases with fixed increases as opposed to CPI reviews

                              SIGNIFICANT PROGRESS ON FY17 EXPIRIES1                                                  85% OF LEASES HAVE
                                                                                                                  ANNUAL FIXED OR CPI INCREASES2
  JUN 15: 18%
  DEC 15: 17%

                                                  15%                                         15%                     15%
                                                                                                                     (reduced
                                                                                                                    from 20%)
  MAR 16: 14%
                                 13%
                                                            12%
  JUN 16: 12%
                                          11%
                                                                   10%           10%

                         5%                                               5%                            28%                                             57%
  DEC 16:                                                                                                                                              (up from
                                                                                                       (reduced
                                                                                                      from 30%)                                          50%)
                                                                                         3%
               2%

              Vacant FY17        FY18    FY19     FY20     FY21    FY22   FY23   FY24   FY25 Beyond       Fixed (Predominantly 3% - 5%)   CPI   Market/Expiry

1. Holdover tenancies as at 31 Dec 2016 treated as FY17 expiries
2. By gross rent

Aventus Retail Property Fund | Half Year Results | 31 December 2016                                                                                               10
Centre Valuation Uplift
• Portfolio value increased by $41.0 million, on a gross basis, and $25.1                                                                                         $M
  million on a net basis excluding acquisitions, capitalised expenditure and
  non-cash accounting adjustments over the 6 months to 31 Dec 2016                                                         Portfolio valuation – 30 Jun 2016   1,273.3

                                                                                                                           Additions                               4.0
• Independent valuations as at 31 Dec 2016 were obtained for Cranbourne
  Home, Highlands Hub, Mile End Home, Peninsula Home, Tweed Hub and                                                        Capitalised expenditure1               10.5
  Warners Bay Home with these centres increasing in value by $19.6 million
  (+5.3%, on a net basis) and the capitalisation rate tightening from                                                      Non-cash adjustments2                   1.4
  7.79% to 7.46%                                                                                                           Net fair value adjustments             25.1

                                                                                                                           Gross portfolio increase               41.0
• Consequently, the WACR of the portfolio tightened to 7.40% from 7.53% at
  30 Jun 2016. The valuations take into account annual rent increases,                                                     Portfolio valuation – 31 Dec        1,314.3
  market rent reviews, completion of a number of asset management and
  development initiatives together with reductions in capitalisation rates

Masters Update
• During the period, Woolworths announced the closure of all of its former Masters tenancies. The AVN portfolio includes one
  tenancy at Cranbourne. Rent under the lease which has 13.8 years left of its term continues to be paid, and Woolworths
  remains as guarantor. The Fund is assessing long-term solutions for this tenancy

• With respect to the other former Masters tenancies, there is minimal overlap with only 4 centres in AVN’s portfolio located
  within a 5 km radius of vacant former Masters tenancies. These centres at Bankstown, Mile End, Ballarat and Peninsula are
  well established, substantially larger in size, 100% leased and represent superior locations to the proximate former
  Masters tenancies

1. Capitalised expenditure represents development and maintenance capex, capitalised leasing costs and capitalised interest on developments
2. Non-cash adjustments represent rental straight-lining adjustments and amortisation of rental guarantees

Aventus Retail Property Fund | Half Year Results | 31 December 2016                                                                                                 11
2. FINANCIAL RESULTS

Logan Super Centre, QLD
Financial Performance
                                                                      6 MONTHS TO     6 MONTHS TO
                                                                        31 DEC 2016     31 DEC 2015
                                                                                $M              $M

                                                                                                      Comments
  Rental and other property income                                            64.5            22.1
                                                                                                      • Financial performance for HY17
  Net movement in fair value                                                                             includes full half year
  of investment properties                                                    25.1            23.2
                                                                                                         contribution for the assets
                                                                                                         acquired in FY16 including the
  Other income                                                                  0.4             0.1      Blackstone portfolio

                                                                                                      • Financial performance for HY16
  Property expenses                                                          (17.0)           (5.6)      represents the results of Kotara
                                                                                                         Home South for the period 1
  Finance costs                                                               (3.8)           (3.4)      Jul 2015 to 31 Dec 2015 plus
                                                                                                         the post IPO results of the
  Management fees                                                             (3.9)           (1.1)      Group for the period 20 Oct
                                                                                                         2015 to 31 Dec 2015
  Portfolio acquisition and                                                       -          (56.9)
  transaction costs                                                                                   • HY17 finance costs include
                                                                                                         mark-to-market gains on
  Other expenses                                                              (1.0)           (0.5)      interest rate swaps of $3.6m

  Profit/(loss) for the period                                                64.3           (22.1)

Aventus Retail Property Fund | Half Year Results | 31 December 2016                                                                         13
Funds From Operations (FFO)
                                                                      6 MONTHS TO
                                                                        31 DEC 2016
                                                                                $M

  Profit for the period                                                       64.3

  Straight-lining of rental income                                            (2.1)

  Amortisation of rental guarantees                                             0.7

  Amortisation of debt establishment costs                                      0.4

  Net movement in fair value of investment properties                        (25.1)

  Net movement in fair value of derivative financial instruments              (3.6)

  FFO                                                                         34.6

  Maintenance capex                                                           (2.0)

  Leasing costs                                                               (1.6)

  Adjusted FFO (AFFO)                                                         31.0

  FFO per unit (cents)1                                                        8.8

  Distribution per unit (cents)                                                7.8

  Payout ratio (% of FFO)                                                     90%

1. Based on a weighted average number of units of 395.0m

Aventus Retail Property Fund | Half Year Results | 31 December 2016               14
Balance Sheet
                                                                      31 DEC 2016                 30 JUN 2016                  MOVEMENT
                                                                              $M                          $M                         $M

  Assets                                                                                                                                            Comments
  Cash and cash equivalents                                                        2.9                         4.3                       (1.4)      • The increase in investment
                                                                                                                                                       properties compared to Jun
  Investment properties1                                                    1,314.3                     1,273.3                           41.0         2016 includes $25.1m in fair
                                                                                                                                                       value gain adjustments, capital
  Other assets                                                                     5.1                         8.5                       (3.4)         expenditures of $8.4m and
                                                                                                                                                       $4.0m relating to the
  Liabilities
                                                                                                                                                       acquisition of additional land
                                                                                                                                                       at Tuggerah
  Borrowings                                                                 (462.7)                     (459.1)                              3.6
                                                                                                                                                    • Other assets at Jun 2016
  Other liabilities                                                            (27.2)                      (30.6)                        (3.4)         included $4.3m in prepaid
                                                                                                                                                       acquisition, GST and
  Net assets                                                                   832.4                       796.4                         36.0          transaction costs relating to
                                                                                                                                                       the acquisition of the Tuggerah
  Units on issue (million)                                                     396.0                       394.7                              1.3      land

  NTA per unit ($)                                                             $2.10                       $2.02                       $0.08        • The decrease in other liabilities
                                                                                                                                                       is mainly attributable to a
  Gearing (%)2                                                                35.0%                       35.7%                       (0.7%)           $2.5m decrease in interest rate
                                                                                                                                                       swap liabilities during the
                                                                                                                                                       period

1. Investment properties includes rental guarantees of $3.0m at 31 Dec 2016
2. The gearing ratio is calculated as total bank debt less cash and cash equivalents divided by total assets less cash and cash equivalents

Aventus Retail Property Fund | Half Year Results | 31 December 2016                                                                                                                       15
Capital Management
                                                                                                                        DEBT AND HEDGING PROFILE AT 31 DEC 2016
                                                                                        DEC 2016                                                     DRAWN           UNDRAWN
 KEY METRICS                                                                                 $M                      BANK DEBT                          $M                $M                  MATURITY

 Drawn debt ($M)                                                                             465.3               Tranche A                              200.0                       -          Oct 2020

 Facility limit ($M)                                                                         500.0               Tranche B                              200.0                       -          Oct 2018

 Cash and undrawn debt capacity ($M)                                                          37.6               Tranche C                                65.3                 34.7           May 2021

 Gearing1                                                                                   35.0%                Total                                  465.3                 34.7

 LVR (max. 55%)3                                                                            36.1%
                                                                                                                     INTEREST RATE                                             NOTIONAL AMOUNT
 ICR (min. 2.0x)4                                                                              6.0x                  SWAP MATURITY                                                          $M

 Weighted average cost of debt2                                                              3.1%                    FY19                                                                             80.0

 Weighted average debt maturity (years)                                                         3.0                  FY20                                                                             60.0

 Weighted average hedged debt maturity (years)                                                  3.1                  FY21                                                                           100.0

 Proportion of drawn debt hedged                                                            51.6%                    Total                                                                          240.0

                                                                                                                 •    The gearing ratio of 35.0% is within the target range of 30% to 40%

                                                                                                                 •    Fixed rates on interest rate swaps range from 1.83% to 2.36%

1.   The gearing ratio is calculated as total bank debt less cash and cash equivalents divided by total assets less cash and cash equivalents
2.   WACD is calculated based on historical finance costs excluding debt establishment costs for the 6 months ended 31 Dec 2016
3.   The LVR ratio is calculated as total bank debt divided by the total fair value of investment properties. Fair value is calculated by reference to the most recent independent valuation for each property
4.   ICR is calculated for the 12 months ended 31 Dec 2016

Aventus Retail Property Fund | Half Year Results | 31 December 2016                                                                                                                                        16
3. ACQUISITIONS

Kotara Home South, NSW
1H17 Acquisitions
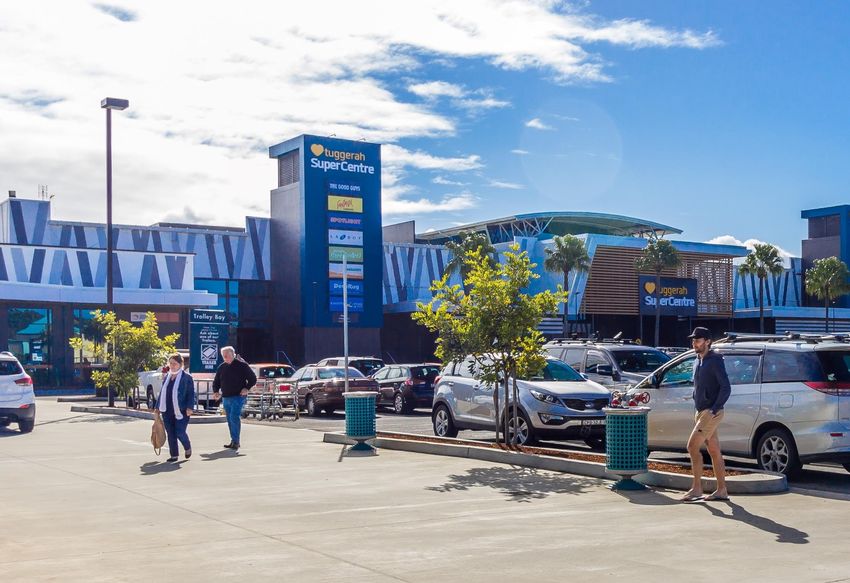
• In the first half of FY17, the Fund settled on a 55,840 sqm
  development site opposite the recently repositioned Tuggerah
  Super Centre for $3.8 million1 to expand control of the precinct
  and provide for future development and expansion
  opportunities. The site is strategically located 350 metres from
  the Tuggerah train station

• Transaction volume across the sector during the 6 months to 31
  Dec 2016 was less than one third of the $453m volume during
  the same period in 2015 and 31% of the first half of 2016

• AVN is the largest pure-play large format retail owner in
                                                                                               Tuggerah Super Centre, NSW
  Australia and remains well positioned to consolidate the highly
  fragmented sector

                                                                                                               Australian LFR centre ownership2

                                                                                                           (9% at IPO)
                                                                                                                              Smaller
                                                                                               Harvey                                            Single centre
                                                                                                           AVN               portfolios
                                                                                               Norman                                             ownership
                                                                                                           12%              (2+ centres)
                                                                                                15%                                                  38%
                                                                                                                                35%

                                                                                          0%               20%              40%            60%      80%          100%

1. Excludes GST and acquisition costs
2. Source: Deep End Services, centres larger than 10,000 sqm; By GLA, as at 30 Jun 2016

Aventus Retail Property Fund | Half Year Results | 31 December 2016                                                                                              18
4. DEVELOPMENT

Tuggerah Super Centre, NSW
Development Update
   Overview
   •   The development pipeline is a key driver of the Fund’s portfolio enhancement
       strategy with a focus on year one cash returns

   •   The estimated residual development pipeline to 30 June 2017 of $15 million
       is on track

   Project Completions
   •   Peninsula Home in Victoria is now 100% occupied following the opening of
       Aldi, a discount chemist and café. The centre has seen an average traffic
       increase of 20% year-on-year since the project was completed in FY16
                                                                                        Cranbourne Home, VIC1
   •   Tuggerah Super Centre in New South Wales is now 100% occupied and has
       seen an average traffic increase of 30% year-on-year since the revitalisation
       project was completed in FY16

   •   The expansion of the Belrose Super Centre in New South Wales to add 2,263
       sqm of retail GLA to the existing rooftop car park is complete and will open
       for trade in March 2017

   Active Projects
   •   Re-development of the former Bunnings tenancy at Sunshine Coast Home in
       Queensland is due to commence this quarter. National retailers Super Amart
       and Sheridan have pre-committed to 6,500 sqm or 84% of the space
                                                                                                                Sunshine Coast Home, QLD1

   •   Construction of the first child care child facility in the portfolio is due to
       commence at Cranbourne Home in Victoria this quarter with completion
       anticipated in early FY18

1. Artist’s impression

Aventus Retail Property Fund | Half Year Results | 31 December 2016                                                                   20
Development Pipeline
• The portfolio covers 1.2 million sqm of land nationally with a low average site coverage of 41%

• Development or value enhancing opportunities have been identified at 3 out of the 5 centres acquired in May 2016

• During the period, approvals were obtained for 4 developments which will contribute to the medium term development pipeline

• In addition, the Fund has commenced long term master planning on 2 centres that benefit from flexible zoning

                                                                      FY17
                                                       1Q        2Q           3Q          4Q
                                 Remaining Cost1
                                                     Jul-Sep   Oct-Dec      Jan-Mar     Apr-Jun

           Belrose Super Centre, NSW | $3m

     Cranbourne Home Stage 8, VIC | $3m2

          Sunshine Coast Home, QLD | $8m2

                    Refurbishments and       .
                    Under Investigation | $1m2

                                                                 Underway             Committed   Belrose Super Centre, NSW

1. Project values represent remaining project cost
2. Works continue past current forecast period

Aventus Retail Property Fund | Half Year Results | 31 December 2016                                                             21
Case Study – Belrose
Leasing
• The Fund successfully completed a major leasing program in 2016
  resulting in the negotiation of new leases and lease extensions for 16
  retailers representing 47% (17,100 sqm) of the centre’s GLA with
  positive leasing spreads and low incentives                                       Dev.
• The centre’s WALE has increased from 2.7 years as at Dec 15 to 4.5
  years as at Dec 16, with major retailers Domayne/Harvey Norman and
  Freedom signing longer lease extensions
• New categories introduced to the centre include baby products,
  toys and barbeques

Development
• Delivered a $6m expansion on time and budget adding 2,263 sqm of
  additional GLA pre-committed to national retailers Barbeques Galore
  and Focus on Furniture                                                   Before
• Total centre approach has delivered material valuation gains to date
  resulting in a net valuation increase to $132.9m from $117.6m1
  (+13.0%) as at 31 Dec 2015

Acquisition
• Acquired adjacent Belrose Gateway Centre in FY16 for $6.4m at an
  8.14% cap rate in an off-market transaction to further control the
  retail precinct

Asset Management
• Management negotiated cost savings and synergies across a number
  of operations in the centre resulting in a reduction of retailer
  operating expenses by $0.2m per annum, boosting net
  property income                                                                          Now
1. Includes acquisition cost and redevelopment spend

Aventus Retail Property Fund | Half Year Results | 31 December 2016                          22
Case Study – Belrose (cont.)
                                                                      NEW ARRIVAL:DEVELOPMENT SITE     CALENDAR YEAR 2016
                                                                      FOCUS ON FURNITURE
RENEWAL:
                                                                                                            16 deals completed
                                                                      7 Year Lease                          Totalling 17,100 sqm
RICKS WOK N NOODLE
                                                                                                            47% of GLA secured
5 Years
                                                                      NEW ARRIVAL: DEVELOPMENT SITE
                                                                      BARBEQUES GALORE                Legend
                                                                                                           New retailers
                                                                      10 Year Lease
                                                                                                           Renewals & Expansions

                                                                                                           New Development
NEW TENANT: SNOOZE

7 Year Lease                                                                                           NEW TENANT: BOORI

                                                                                                       5 Year Lease

RENEWAL: DECORUG

5 Years
                                                                                                       NEW TENANT:
                                                                                                       DISCOUNT TOY CO
RENEWAL: OZ DESIGN
                                                                                                       5 Year Lease
5 Years

NEW TENANT: SHERIDAN
                                                                                                       NEW TENANT:
5 Year Lease                                                                                           BABY BUNTING

RENEWAL: GODFREYS                                                                                      10 Year Lease

5 Years                                                                                                RENEWAL: STORE HOUSE

                                                                                                       5 Years
RENEWAL:
KITCHEN WORKS

3 Years                                                                                                NEW TENANT: FLAVOUR MILL

                                                                                                       8 Year Lease

RENEWAL: FREEDOM

10 Years
                                                                                                       RENEWAL: DOMAYNE

                                                                                                       7 Years

Aventus Retail Property Fund | Half Year Results | 31 December 2016                                                                 23
5. OUTLOOK

Peninsula Home, VIC
Outlook
• Growth in the net income of the portfolio underpinned by diversification in the tenancy mix, high occupancy rates, low
  incentives, positive leasing spreads and annual rent increases

• Progress value-adding development opportunities and continue to build the medium to long term development pipeline

• Investigate selective acquisitions to supplement organic portfolio income growth

• Maintain a disciplined and flexible capital structure by diversifying funding sources and lengthening debt expiries

• The Fund confirms its FY17 earnings guidance of1:

 • FFO per unit of 17.5 – 18.0 cents

 • Distribution per unit of 15.8 – 16.2 cents based on a payout ratio of 90% of FFO

1. Assuming no material change to the operating environment

Aventus Retail Property Fund | Half Year Results | 31 December 2016                                                        25
Questions?
                                                 Aventus Property Group

             Integrated and                             Leading investor with a track record       Single sector
            scalable platform                           for performance and adding value in           focus
                                                                        LFR

         Deep retail expertise                                   Specialised team focused       Long history of LFR
            and insights                                         on operational excellence     retailer relationships

Aventus Retail Property Fund | Half Year Results | 31 December 2016                                                     26
APPENDIX 1: PORTFOLIO OVERVIEW

Highlands Hub, NSW
Portfolio Overview
                                        Valuation       Carrying         Cap                         WALE        No. of           GLA        Site Area     National                       Dev.
 Centre                        State                                               Occupancy3                                                                               Zoning
                                          Date         Value ($m)2       Rate                       (years)4    Tenancies        (sqm)         (sqm)       Retailers                    Potential5

 Ballarat Home                  VIC       Dec-16            37.3        7.75%          100%            6.0           15         20,099        52,084          93%             LFR           P
 Bankstown Home                NSW        Jun-16            53.3        7.25%          100%            2.8           20         17,171        40,240          92%             LFR           P
 Belrose Super   Centre1       NSW        Dec-16           132.9        7.06%          100%            4.5           43         34,339        44,265          90%          LFR/Retail       P
 Caringbah Home                NSW        Dec-16            90.0        7.75%          100%            2.0           26         19,377        22,818          84%             LFR           P
 Cranbourne Home                VIC       Dec-167          125.0        7.25%          100%            6.8           32         54,315       193,900          91%          LFR/Retail       P
 Epping Hub                     VIC       Dec-16            40.0        7.75%          96%             2.3           29         22,141        59,770          69%          Mixed Use        P
 Highlands Hub                 NSW        Dec-167           31.2        7.75%          99%             4.0           14         11,404        31,890          87%          LFR/Retail       P
 Jindalee Home                 QLD        Dec-16           106.6        7.50%          99%             4.1           58         26,714        72,030          68%          LFR/Retail       P
 Kotara Home South             NSW        Dec-16           108.0        7.00%          98%             4.7           22         29,148        53,390          93%          LFR/Retail       P
 Logan Super Centre            QLD        Jun-16            81.9        7.25%          98%             3.4           28         26,997        26,790          83%             LFR           P
 Macgregor Home                QLD        Jun-16            26.1        7.75%          100%            0.8            6         12,505        29,128          69%             LFR           P
 McGraths Hill Home            NSW        Jun-16            36.1        7.25%          100%            3.0            9         16,478        37,840          94%             LFR           O
 Midland Home                   WA        Dec-16            56.1        7.75%          100%            4.9           18         23,411        42,640          94%             LFR           O
 Mile End Home                  SA        Dec-167           89.5        7.50%          100%            4.4           32         33,447        71,320          87%             LFR           P
 Peninsula Home                 VIC       Dec-167           75.3        7.50%          100%            3.5           30         33,064        84,651          83%          LFR/Retail       P
 Shepparton Home                VIC       Jun-16            21.6        8.00%          81%             4.4           11         13,661        30,290          81%             LFR           P
 Sunshine Coast Home3          QLD        Dec-16            69.1        7.50%          87%             4.7           34         27,584        68,877          83%          LFR/Retail       P
 Tuggerah Super    Centre6     NSW        Dec-16            64.9        7.00%          100%            6.9           22         28,576       127,410          92%          LFR/Outlet       P
 Tweed Hub                     NSW        Dec-167           34.2        7.50%          97%             4.1           17          9,763        26,200          49%          LFR/Retail       O
 Warners Bay Home              NSW        Dec-167           35.2        7.75%          100%            3.6           12         12,337        35,140          90%             LFR           O
 Total Portfolio                                          1,314.3       7.40%         98.0%            4.3          478        472,531      1,150,673         84%

1. Metrics are calculated on a weighted average basis (by value) including Belrose Super Centre and adjacent Belrose Gateway Centre
2. Valuations are on ‘as if complete’ basis
3. By GLA as at 31 Dec 2016; reflects signed leases to Super Amart and Sheridan at Sunshine Coast Home due to be occupied within FY17
4. By gross income as at 31 Dec 2016 (excluding rental guarantees)
5. Further development of certain centres may be subject to contractual and regulatory approvals including planning approvals from relevant local government authorities
6. Carrying value for Tuggerah includes $3.8 million of vacant land purchased in Jul 2016
7. Independently valued

Aventus Retail Property Fund | Half Year Results | 31 December 2016                                                                                                                             28
Diversified Portfolio1

                                                          89%
                                                          EAST COAST
         4%
                                                    20
          WA
                                              Our         22% QLD
                                                centres
                                                          44%    NSW
LOCATIONS:
NSW                     QLD
Belrose Super Centre    Jindalee Home
Bankstown Home          Logan Super Centre
Caringbah Home          Macgregor Home
Highlands Hub           Sunshine Coast Home
                        SA

                                                           23%
Kotara Home South
McGraths Hill Home
                        Mile End Home                            VIC
                                              7%
Tuggerah Super Centre
Tweed Hub               WA
Warners Bay Home        Midland Home
VIC
Ballarat Home
Cranbourne Home
Epping Hub
Peninsula Home
                                               SA
Shepparton Home

1. By value

                                                                       29
                                                                       29
APPENDIX 2: INDUSTRY DYNAMICS

Mile End Home, SA
The Changing Nature of LFR Centres

                                               Old Bulky Goods Centres                             Modern AVN LFR Centres
                                                •   Independent family
                                                    operated with high           •   Predominantly national, ASX listed or international retailers
                 Improving quality                  concentration of furniture       with multi-brand strategy
                 of tenants                         and household goods,         •   Providing greater transparency of retailer performance
                                                    and few international        •   Ensuring income streams are more reliable and consistent
                                                    retailers

                                                                                 •   Larger more dominant centres creating critical mass as a
                 Increasing centre              •   Smaller centres with             single destination offering
                 size and                           basic design (industrial     •   Development of modern multi-level centres in mainly
                 improved design                    single level buildings)          metropolitan locations with ample car parking, ease of
                                                                                     access and modern amenities

                                                                                 •   All-week visits with increasing dwell time and preference
                                                                                     for comparison shopping
                 Changing                       •   Mainly weekend visits for
                                                                                 •   Demand for family focused, higher quality and diverse
                 shopper habits                     discretionary products
                                                                                     goods and services (eg food and beverage, small
                                                                                     supermarkets, medical, fitness and leisure)

                                                                                 •   Expansion of new uses and removal of minimum store size
                                                •   Strictly bulky / household
                 Flexible planning                                                   has allowed for the introduction of new offerings in centres
                                                    goods and minimum
                 controls                           store size                   •   Potential for other states to reform and improve planning
                                                                                     controls (eg WA and NSW)

Aventus Retail Property Fund | Half Year Results | 31 December 2016                                                                                  31
Industry Dynamics
• Large Format Retail goods are a substantial retail                                                   RETAIL TURNOVER GROWTH
  segment in Australia                                                                                 12 MONTHS TO 31 DEC 20162

 – Approximately $65bn in sales or 20% of total retail                                         Supermarkets                  2.7%
   spend in Australia1                                                                                Liquor                      4.4%
                                                                                      Other specialised food               1.0%
 – Approximately 30% of total retail floor space
   in Australia1
                                                                                                    Furniture                2.5%
                                                                                                   Electrical              1.3%
• Large format retail spend is beginning to normalise
  relative to consistent outperformance of total retail                                  Hardware & garden                          6.4%
  in the last few years
                                                                                                    Clothing                            6.7%
 – BIS Shrapnel predicts spending on household                             Footware & personal accessories                       3.7%
   goods to grow at approximately 4% per annum for
                                                                                          Department stores
   2017 and 2018                                                                                                          0.6%

 – Retailer demand has remained strong, not only in                                     Newspaper & books       (4.1%)
   traditional household sectors, but also in the range                             Other recreational goods                 3.0%
   of other non-household uses that are becoming                      Pharmaceuticals, cosmetics & toiletries                     4.5%
   more prevalent in LFR centres, such as cafes,
   fitness centres, pet and auto accessories, children’s                                      Other retailing                            8.0%
   play centres, chemists and supermarkets
                                                                                         Cafes & restaurants               1.7%
                                                                                                  Takeaway                               8.0%

1. Source: Large Format Retail Association
2. Source: ABS retail trade

Aventus Retail Property Fund | Half Year Results | 31 December 2016                                                                             32
Demand for Household Goods
Demand for household goods influenced by many
factors
                                                                                                   RESIDENTIAL PRICES
                                                                                                  YEAR ENDED SEP 20161
• Strong growth in house prices since 2013 (now moderating)

                                                                          20%                                          72% increase over 10 years       150
• High levels of dwelling approvals (lag effect of up to three years)
  and dwelling completions                                                15%
                                                                          10%                                                                           100
• Turnover of existing dwellings (now moderating)
                                                                           5%

• Home improvements are a natural hedge with renovations                   0%                                                                           50
  continuing through the cycle (but with smaller scope)                   (5%)
                                                                         (10%)                                                                          0
Other factors affecting demand for LFR goods include                             2006 2007 2008 2009 2010 2011 2012 2013 2014 2015 2016
                                                                                      Quarterly change (YoY)         Residential Property Price Index
• Interest rate environment and employment levels impact
  consumer sentiment                                                                       ANNUAL NATIONAL DWELLING
                                                                                          COMPLETIONS AND APPROVALS2
• Household incomes and savings ratio
                                                                        250,000
                                                                                                                  3-year avg approvals: 225k
• Changes in life stages and population growth (births, ageing,
  divorce, upgraders, downsizers and migration)                         200,000             7-year avg approvals: 159k

• Product trends, replacements and popularity of home
  renovations generate interest and attention for large format          150,000
  retailers (eg The Block)

                                                                        100,000
• Limited impact to date of online retailing as LFR goods are
                                                                                   2006 2007 2008 2009 2010 2011 2012 2013 2014 2015 2016
  considered major bulky purchases and have a ‘touch and feel’
  element                                                                                       Dwelling completions - year ending September

1. Source: ABS residential property price index
                                                                                                Dwelling approvals - year ending September
2. Source: ABS dwelling approvals and completions

Aventus Retail Property Fund | Half Year Results | 31 December 2016                                                                                           33
The LFR Supply Pipeline
• Construction of freestanding floorspace is at its lowest level since 2009, while construction of multi-tenanted centre
  floorspace1 is at the lowest level on record. There were no projects of over 20,000 sqm and only two above 10,000 sqm
  completed in 2016

• Excluding former Masters tenancies, 2017 is likely to be another modest year for completions following subdued supply in
  2016

• While the former Masters tenancies may come into supply in the future, the tenancies are distinguishable from AVN centres in
  that they:
  – have been single tenanted and the shape/depth of the former Masters tenancies could limit the introduction of smaller
    tenancies e.g. food and beverage
  – are approximately 11,000 sqm or less than half the size of an average AVN centre
  – Their smaller scale could limit the appeal to shoppers seeking a range of large format retailers and the ability to cross and
    comparison shop
                                             LARGE FORMAT RETAIL FLOORSPACE
                      '000 sqm            COMPLETIONS BY TYPE AND TOTAL STOCK1
                               800
                               700
                               600
                               500
                               400
                               300
                               200
                               100
                                  0
                                       2002 2003 2004 2005 2006 2007 2008 2009 2010 2011 2012 2013 2014 2015 2016e
                                                        Centres               Freestanding superstores
                                 e = estimate
1. Source: BIS Shrapnel, Dec 2016; year ended Dec; multi-tenanted centres larger than 4,000 sqm

Aventus Retail Property Fund | Half Year Results | 31 December 2016                                                            34
Important Notice
This presentation has been prepared on behalf of the Aventus Retail Property Fund (ARSN 608 000 764) (AVN). Aventus Capital Limited
(ABN 34 606 555 480 AFSL 478061) (ACL) is the Responsible Entity of AVN. The information contained in this document is current only as at
31 December 2016 or as otherwise stated herein. This document is for information purposes only and only intended for the audience to
whom it is presented. This document contains selected information and should be read in conjunction with the financial statements for the
period and other ASX announcements released from time to time. This document may not be reproduced or distributed without AVN’s prior
written consent. The information contained in this document is not investment or financial product advice and is not intended to be used as
the basis for making an investment decision. AVN has not considered the investment objectives, financial circumstances or particular needs
of any particular recipient. You should consider your own financial situation, objectives and needs, conduct an independent investigation of,
and if necessary obtain professional advice in relation to, this document.

Except as required by law, no representation or warranty, express or implied, is made as to the fairness, accuracy, completeness or
correctness of the information, opinions and conclusions, or as to the reasonableness of any assumption, contained in this document. By
receiving this document and to the extent permitted by law, you release AVN and ACL and its directors, officers, employees, agents, advisers
and associates from any liability (including, without limitation, in respect of direct, indirect or consequential loss or damage or any loss or
damage arising from negligence) arising as a result of the reliance by you or any other person on anything contained in or omitted from this
document.

This document contains certain forward-looking statements along with certain forecast financial information. The words “anticipate”,
“believe”, “expect”, “project”, “forecast”, “guidance”, “estimate”, “outlook”, “upside”, “likely”, “intend”, “should”, “could”, “may”, “target”, “plan”,
and other similar expressions are intended to identify forward-looking statements. The forward-looking statements are made only as at the
date of this document and involve known and unknown risks, uncertainties, assumptions and other important factors, many of which are
beyond the control of AVN. Such statements reflect the current expectations of AVN concerning future results and events, and are not
guarantees of future performance. Actual results or outcomes for AVN may differ materially from the anticipated results, performance or
achievements expressed, projected or implied by these forward-looking statements or forecasts. Other than as required by law, although
they believe that there is a reasonable basis for the forward-looking statements, neither AVN nor any other person gives any representation,
assurance or guarantee (express or implied) that the occurrence of these events, or the results, performance or achievements expressed in
or implied by any forward-looking statements contained herein will actually occur and you are cautioned not to place undue reliance on
such forward-looking statements. Risk factors (which could be unknown or unpredictable or result from a variation in the assumptions
underlying the forecasts) could cause actual results to differ materially from those expressed, implied or projected in any forward-looking
statements or forecast. Past performance is not an indicator or guarantee of future performance or results.

Aventus Retail Property Fund | Half Year Results | 31 December 2016                                                                                   35
You can also read