Ardent Leisure Group Limited FY19 Results Presentation - August 2019
←
→
Page content transcription
If your browser does not render page correctly, please read the page content below
Ardent Leisure Group Limited
FY19 Results Presentation

August 2019

                               0
Disclaimer

This information has been prepared for general information purposes only, is not general financial product advice and has been prepared by
Ardent Leisure Group Limited (ABN 51 628 881 603) (ALG), without taking into account any potential investors’ personal objectives, financial
situation or needs. Past performance information provided in this presentation may not be a reliable indication of future performance.

Due care and attention has been exercised in the preparation of forecast information, however, forecasts, by their very nature, are subject to
uncertainty and contingencies many of which are outside the control of ALG. Actual results may vary from forecasts and any variation may be
materially positive or negative. ALG does not provide assurances in respect of the obligations of any controlled entities.

The information in this presentation is provided in summary form and is therefore not necessarily complete. The information contained herein is
current as at the date of this presentation unless specified otherwise.

                                                                                                                                                  1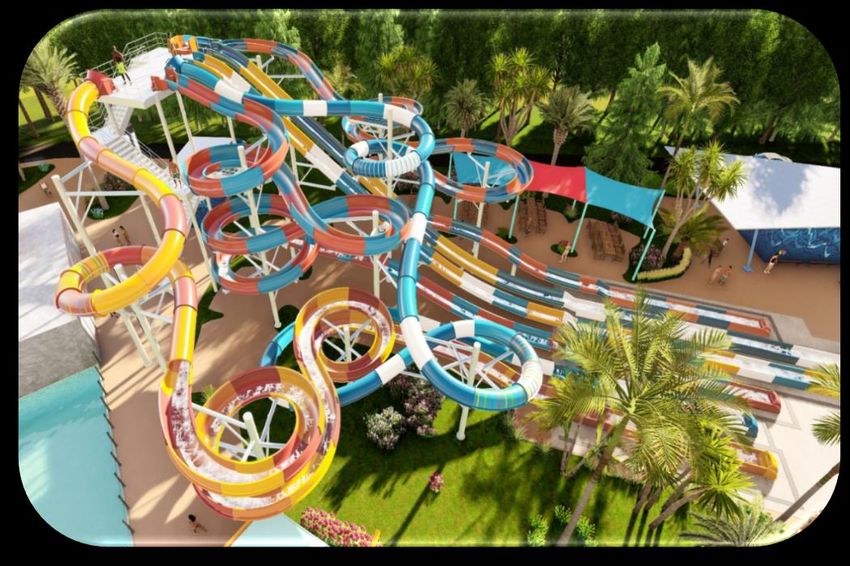
FY19 Group Overview

                      2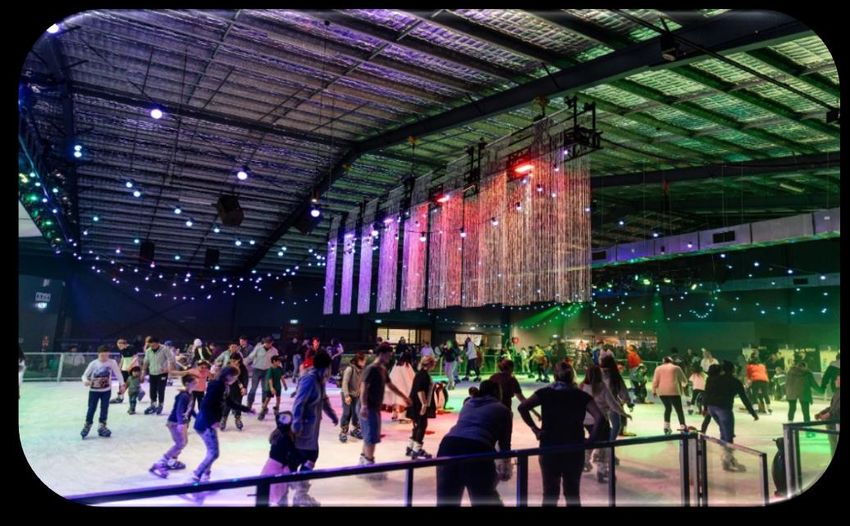
Key messages

▪      Revenue and EBITDA (before Specific Items) from continuing businesses were up 14.4% and 15.7%
       respectively over the prior year

▪      Main Event revenue in USD grew 7.9% reflecting contributions from centres opened in FY18 and FY19.
       Constant centre revenue decreased by 1.0% on a like-for-like basis1

▪      Main Event aims to return EBITDA margins in excess of 20%2 over the medium term
▪      Theme Parks revenue was broadly in line with pcp. Attendance was adversely impacted by the Coronial
       Inquest hearings held during 1H19, along with the opening of Sky Voyager taking longer than anticipated. This
       is partially offset by an increase in the average per-capita spend of 13.1%

▪      Sky Voyager approved by Queensland regulator and will open on 23 August 2019

▪      High calibre leadership now in place in both businesses supported by experienced management teams

▪      Simplified corporate structure post destapling and corporatisation allowing greater flexibility to fund investment
       and growth

▪      Sufficient headroom to fund growth following finalisation of a US$225 million loan facility
▪      Further reduction in corporate costs achieved in FY19

1. Measured based on same number of days in both periods
2. Excluding pre-opening, restructuring and other non-recurring costs                                                       3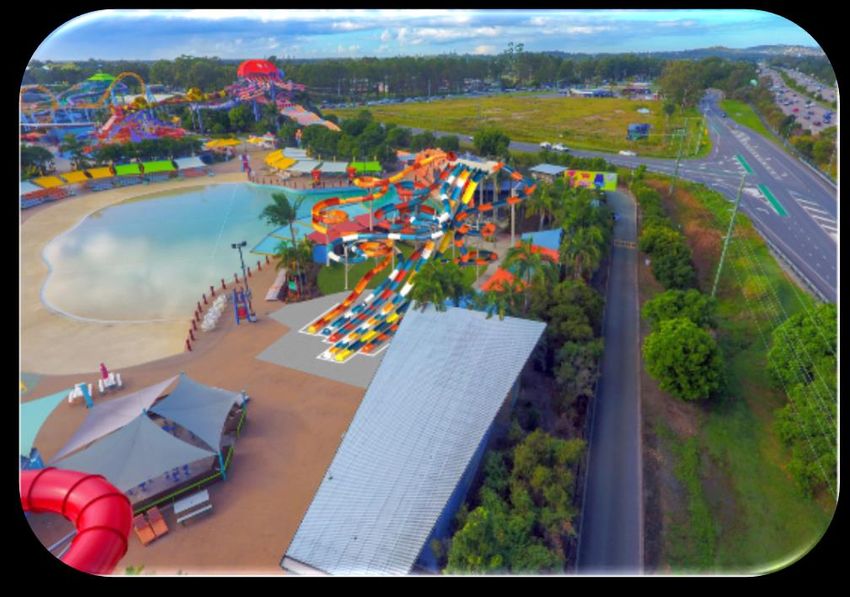
Current vs prior corresponding period
Performance vs prior year impacted by sales of businesses, non-cash
valuation, impairment charges and tax

                                                                       Consolidated
                                                                                                                         Key factors driving variances:
A$m                                                         FY192         FY182     Variance
                                                                                                                        ▪ Reduced revenue primarily reflects sale of Marinas (Aug-
Revenue                                                     483.3           547.5          (11.7%)
                                                                                                                          17) and Bowling & Entertainment (Apr-18), which
                                                                                                                          contributed $125.1 million in prior period, partly offset by
Business unit EBITDA                                         26.8           (38.5)         169.8%
                                                                                                                          growth in Main Event
Corporate                                                   (15.1)          (15.5)           2.5%                       ▪ Year-on-year comparison of business unit EBITDA was
                                                                                                                          impacted by several large non-cash and non-recurring
EBITDA1                                                      11.7           (54.0)         121.7%                         items as well as reduced EBITDA contribution following
                                                                                                                          the sale of the aforementioned businesses
Depreciation and amortisation                               (52.4)          (55.9)           6.4%                       ▪ Decline in borrowing costs driven by large debt
                                                                                                                          repayments and facility reductions following the sale of
EBIT1                                                       (40.7)         (109.9)          63.0%                         two businesses in the prior year
Borrowing costs (net)                                        (7.9)          (10.2)          22.4%                       ▪ FY19 had a $12.3 million tax expense compared to a
                                                                                                                          $29.4 million tax benefit in FY18 due to:
Net loss before tax                                         (48.6)         (120.1)          59.5%                          ▪    The current year including a $15.9 million expense for
                                                                                                                                estimated tax payable in respect of previous financial
Income tax (expense)/benefit                                (12.3)           29.4         (141.8%)                              years;
                                                                                                                           ▪    The Group recording an expense of $12.4 million in the
Net loss after tax                                          (60.9)          (90.7)          32.9%
                                                                                                                                year in respect of Australian tax losses for which
                                                                                                                                deferred tax assets have now been derecognised; and
EBITDA1 excluding Specific Items3                            54.2            64.7          (16.2%)                         ▪    The prior year benefitting from a $12.2 million credit
                                                                                                                                relating to restatement of Main Event deferred tax
EBIT1 excluding Specific Items3                               1.8             8.8          (79.1%)                              balances due to US tax reforms, which lowered the US
                                                                                                                                corporate tax rate
1   Refer defined terms
2   FY19 comprised of results from 27 June 2018 to 25 June 2019 (364 days); FY18 comprised of results from 1 July 2017 to 26 June 2018 (361 days)
3   Breakdown of Specific Items impacting results are provided in the Appendices
                                                                                                                                                                                     4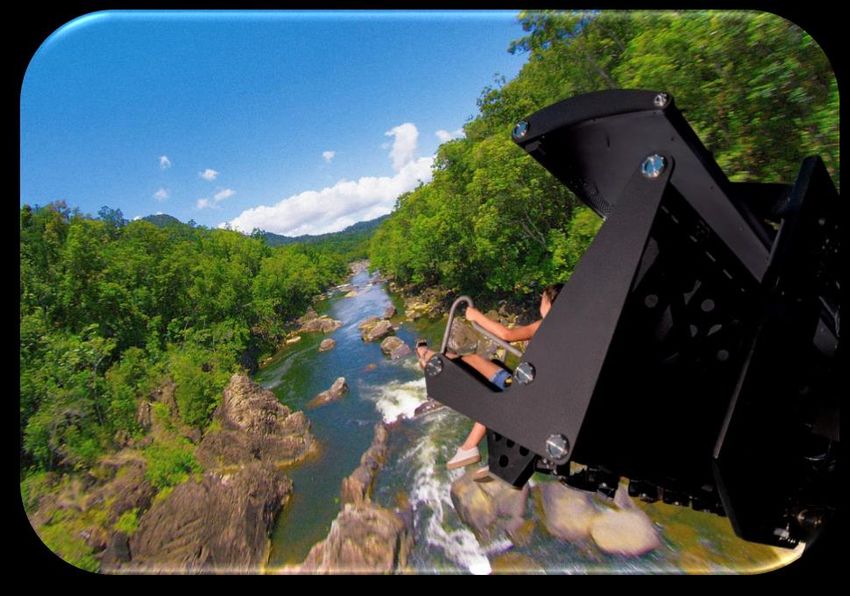
Continuing operations

    Main Event and Theme Parks

                                                                      Continuing Operations
A$m                                                               FY192         FY182        Variance                     Continuing operations:
Revenue
                                                                                                                          ▪ Main Event accounted for over 85% of FY19 revenue
Main Event                                                        416.2         355.6          17.0%                        and grew at 7.9% in US dollar terms (17.0% in Australian
Theme Parks                                                        67.1          66.8           0.5%                        dollars after impact of foreign exchange movements)
Revenue                                                           483.3         422.4          14.4%
                                                                                                                          ▪ Main Event was impacted by non-cash impairment
EBITDA1 excluding Specific Items
                                                                                                                            charges for certain locations, restructuring costs and
Main Event                                                         74.2          66.4          11.7%                        other non-recurring items in both financial periods. In
Theme Parks                                                       (10.0)         (7.5)        (32.4%)                       addition, the current year was impacted by an onerous
                                                                                                                            lease expense associated with one of the impaired
Corporate                                                         (10.0)        (12.0)         16.5%
                                                                                                                            centres. Excluding these, Main Event’s EBITDA
EBITDA1 excluding Specific Items                                   54.2          46.9          15.7%                        improved by $7.8 million (11.7%)
EBITDA1 margin excluding Specific Items                           11.2%         11.1%         0.1 pts
      1
                                                                                                                          ▪ Dreamworld continues to recover albeit at a slower rate
EBIT excluding Specific Items
                                                                                                                            than anticipated due to Coronial Inquest hearings in
Main Event                                                         31.9          33.2          (3.9%)                       1H19 and the delayed opening of Sky Voyager
Theme Parks                                                       (19.2)        (16.2)        (18.4%)
                                                                                                                          ▪ Significant non-cash revaluation write-down and
Corporate                                                         (10.9)        (13.2)         17.4%
                                                                                                                            impairments of $79.6 million occurred for the Theme
EBIT1 excluding Specific Items                                      1.8           3.8         (52.0%)                       Parks business in FY18
Specific Items3 impacting EBITDA and EBIT                         (41.9)        (142.0)        70.5%
                                                                                                                          ▪ Group office corporate costs have reduced compared to
EBIT1                                                             (40.1)        (138.2)        71.0%                        prior year, albeit FY19 being impacted by c.$5 million of
EBITDA1                                                            12.3         (95.2)        112.9%                        restructuring and other non-recurring items

1    Refer defined terms
2    FY19 comprised of results from 27 June 2018 to 25 June 2019 (364 days); FY18 comprised of results from 1 July 2017 to 26 June 2018 (361 days)
3    Breakdown of Specific Items impacting results are provided in the Appendices
                                                                                                                                                                                      5
Specific Items impacting results
Results in both years continued to be impacted by impairment charges in
Main Event, one-off costs relating to restructuring and Dreamworld incident

    FY19 EBITDA from continuing operations (A$m)
                                                                                                                                                                      Specific Items impacting results:
                                                                                                                                                                      ▪ Specific Items which are useful in understanding the
                                                                                                                       2.8                    54.2                      statutory results are set out on this slide (as per
                                                                                             3.1
                                                                           5.4                                                                                          statutory accounts)
                                           13.0
                                                                                                                                                                      ▪ Results for both current and prior periods have been
                                                                                                                                                                        impacted by non-cash impairment charges associated
                      17.6                                                                                                                                              with certain underperforming Main Event centres, non-
                                                                                                                                                                        recurring restructuring expenses and Dreamworld
                                                                                                                                                                        incident related costs due to Coronial Inquest hearings

       12.3                                                                                                                                                           ▪ Restructuring activity in the current year includes
                                                                                                                                                                        destapling and corporatisation of the Group, consulting
                                                                                                                                                                        costs and employee related costs, as well as site
                                                                                                                                                                        exploration costs incurred
                      Impairment of Main

                                                                                             Onerous lease provision
         EBITDA

                                                                      Dreamworld incident

                                                                                                                       Pre-opening expenses

                                                                                                                                              EBITDA excl. Specific
                                            Restructuring and other

                                                                       (net of recoveries)

                                                                                                                                                                      ▪ Prior year was significantly impacted by write-downs in
                         Event PP&E

                                                                                                                                                                        the value of Dreamworld following the incident in
                                                                              costs

                                                                                                                                                    Items

                                                                                                                                                                        October 2016, together with the impact of the sale of
                                                                                                                                                                        businesses

                                                                                                                                                                      ▪ Breakdown of Specific Items by business unit are
                                                                                                                                                                        provided in the Appendices

1    Refer defined terms
                                                                                                                                                                                                                                  6
Main Event
Overview
Revenue up 7.9% and EBITDA excluding Specific Items grew 4.0%

    The figures in the table below are in US$ million

    US$m                                                          FY192            FY182         Variance                 Main Event performance:
    Revenue                                                       297.3             275.5           7.9%                    ▪    Sales growth of 7.9% reflects full period contributions
                                                                                                                                 from three centres that opened in FY18 and one new
    EBRITDA1,3                                                     77.5              48.7          59.3%                         centre that opened in FY19

    Operating margin                                              26.1%            17.7%           8.4 pts                  ▪    Constant centre revenue decreased 1.0% on a like-for-
                                                                                                                                 like basis (down 0.2% on a statutory basis) driven by
    Property costs                                                (43.4)            (36.8)        (18.0%)                        fewer promotional activities and increased competition
                                                                                                                            ▪    Current period continued to be impacted by non-cash
    EBITDA1                                                        34.1              11.9          187.2%                        asset impairment charges for the previously impaired
                                                                                                                                 centres, restructuring and non-recurring costs
    EBITDA1 margin                                                11.5%             4.3%           7.2 pts
                                                                                                                            ▪    EBITDA margin improved over 700bps led by reduction
    Specific Items impacting EBITDA4                              (18.8)            (39.0)         51.8%                         in central and regional costs as a percentage of
                                                                                                                                 revenue, non-cash impairment, pre-opening costs,
    EBITDA1 excluding Specific Items                               52.9              50.9           4.0%                         restructuring and non-recurring costs. Partially
                                                                                                                                 offsetting these improvements was a decline in centre
    EBITDA1 margin excluding Specific Items                       17.8%            18.5%          (0.7) pts                      level margins due to lower sales volumes per centre
                                                                                                                                 and a higher fixed cost structure at certain centres
    Depreciation and amortisation                                 (30.2)            (25.7)        (17.5%)                   ▪    Pre-opening costs of US$2.0 million in FY19 vs US$4.5
                                                                                                                                 million in FY18 reflect fewer new centre openings in the
    EBIT1 excluding Specific Items                                 22.7              25.2          (9.7%)                        current year
                                                                                                                            ▪    Increase in depreciation and amortisation primarily
                                                                                                                                 reflects the investments in new centre openings during
                                                                                                                                 FY18 and FY19
1     Refer defined terms
2     FY19 comprised of results from 27 June 2018 to 25 June 2019 (364 days); FY18 comprised of results from 1 July 2017 to 26 June 2018 (361 days)
3     Includes US$0.5m of unrealised loss on derivative. Previously all hedging were taken at Group level and included in Corporate Costs
4     Breakdown of Specific Items impacting results are provided in the Appendices
                                                                                                                                                                                           8
Constant centres
Constant centre¹ sales down 1.0% for FY19; last two months of FY19
up over 2%

                   Constant Centre¹ Revenue Down in FY19                                                           Constant centre performance:
                       Constant Centre¹ Sales Trend-Like-for-like²                                                 ▪   Decline in FY19 constant centre revenue primarily
                                          8.9%                                                                         driven by fewer promotional activities and increased
     8.2%
                                                                                                                       competition. Competition estimated to have a 130bps
                  5.3%                                                                                                 impact for the full year. Last nine weeks of FY19
                              3.9%                                                                                     generated positive constant centre sales of 2.0%

                                                                               1.6%                                ▪   Event business constant centre sales grew
                                                                                                                       approximately 6%, reflecting strong corporate
                                                                                                                       business driven by sales leadership focus and
                                                                                                                       realignment; was up 8.5% in 1H
                                                                                          (1.0)%
                                                     (2.0)%
                                                                  (2.8)%                                           ▪   Constant centre sales on a two-year basis was up
     FY12         FY13        FY14        FY15        FY16         FY17        FY18        FY19                        0.9%
                                                                                                                   ▪   Constant centre sales for the first six weeks of FY20
                                                                                                                       were down 3.1%, impacted by unfavourable timing of
                                                                                                                       US Independence Day occurring on a Thursday
                                                                                                                       versus a Wednesday and unfavourable weather
                                                                                                                       versus the pcp

1   Refer defined terms
2   Constant centres presented on a “like-for-like” basis, measured based on same number of days in both periods                                                               9
Margin by cohort
EBITDA margins (excl. Specific Items) down 0.7% driven by FY17-19 centres;
partially offset by improvement in Impaired centres and G&A efficiencies
Pre-FY17 FY17-19 EBITDA
Centres Centres All Centres (excl.
(excl. (excl. (excl. Impaired Centre-level Derivative Specific Specific
US$m Impaired) Impaired) Impaired) Centres 4-Wall G&A loss Items) Items Total
FY19
# of centre equivalents 26.0 10.6 36.6 5.0 41.6 41.6 41.6
Revenue 195.8 77.1 272.9 24.4 297.3 - 297.3 297.3
EBITDA 56.9 19.1 76.0 0.4 76.4 (23.0) (0.5) 52.9 (18.8) 34.1
EBITDA Margin 29.1% 24.8% 27.9% 1.7% 25.7% (7.7%) (0.2%) 17.8% (6.3%) 11.5%
Average unit revenue 7.5 7.3 7.5 4.9 7.1 7.1 7.1
FY18
# of centre equivalents 26.0 7.4 33.4 5.0 38.4 38.4 38.4
Revenue 195.6 55.5 251.1 24.3 275.5 - 275.5 275.5
EBITDA 56.8 16.6 73.4 0.1 73.5 (22.6) 50.9 (39.0) 11.9
EBITDA Margin 29.1% 29.8% 29.2% 0.4% 26.7% (8.2%) - 18.5% (14.2%) 4.3%
Average unit revenue 7.5 7.5 7.5 4.9 7.2 7.2 7.2
▪ The FY17-FY19 cohort contributed essentially all of the 4-Wall EBITDA decline and this was driven by lower average unit revenue. Additionally,
business interruption proceeds for one of the Houston centres favourably impacted the prior year
▪ Impaired locations’ margins improved from more efficient labour and other operating costs
▪ General and administrative costs improved by 50bps as a percentage of revenue, driven by lower regional costs and central costs growing at a
lower rate than revenue growth year-over-year
▪ We have implemented cost savings initiatives and 20bps margin improvement has been reflected in FY19 (100bps on an annual run-rate basis)
as we continue to target 20% EBITDA margins (excluding Specific Items1) over the medium-term
1 Refer defined terms 10New centre performance
Overall FY18 cohort delivered solid results; only one new centre
opened in FY19 in new market
Cash-on-Cash Returns2
Initial New centre performance summary:
# Centres Spend1 /
in Centre ▪ FY18 cohort (four centres all located in new markets)
Cohort Cohort (US$m) Year 1 Year 2 Year 3 averaged Year 1 cash-on-cash returns of 30.7%
FY19 1 $9.9
▪ FY19 opening is in a new market and is continuing to
build. The net investment for this location was higher due
FY18 4 $8.0 30.7%
to the quality of the trade area, and next several openings
FY12-17 will have lower average net investment
23 $7.2 41.8% 35.2% 35.9%
(excl. impaired)
Portfolio since FY12 ▪ 27 centres (excluding the five impaired centres) that are
28 $7.3 40.1% 35.2% 35.9%
(excl. impaired) part of the FY12-FY18 cohort have an average Year 1
cash-on-cash returns of 40.1%
▪ Historical Year 1 cash-on-cash returns and subsequent
years remain strong when we focus on a disciplined site
selection approach which includes not only free-standing,
ground-up development but also high-quality second-
generation real estate (i.e. mall and other retail or big-box
redevelopment)
▪ Focusing on a mix of existing and new markets moving
forward
1 Excludes pre-opening costs
2 Refer defined terms
11Key accomplishments during FY19
Leading to significant improvement across several parts of the business
Accomplishments Results Achieved
▪ Built a world-class management team with proven experience ▪ Improved the previous three-year negative traffic trend by 300
in multi-unit brands and site openings bps; FY19 best traffic performance in last four years
▪ Developed extensive consumer insights, and defined our ▪ Event business constant centre revenue growth of ~6%, which
target audience and core brand positioning and developed is the most growth in over five years
new brand identity after thorough research
▪ Guest experience measures ended FY19 at an all-time high
▪ Reorganised operations and aligned incentives bringing a and FY20 has started even higher
unified focus to the guest experience
▪ Birthday guest satisfaction scores have improved 600bps over
▪ Reorganised the sales team and invested in new banquet previous six-month period
equipment
▪ We achieved our target of 100bps of margin improvement on
▪ Developed a robust site selection process using consumer an annual run-rate basis, in which 20bps has been reflected in
insights and market data to guide priorities FY19
▪ Developed a pipeline of innovation and new entertainment ▪ Impaired locations’ margins improved approximately 140bps
attractions
▪ Improved employee turnover stats and achieved higher
▪ Completed a standalone US based capital structure to fund employee engagement during FY19
our growth plans
▪ Hourly turnover improved 800bps
▪ Entered into a branded national gift card program where we
▪ Built robust real estate pipeline; actively looking in 27 states
will have the exposure to sell Main Event gift cards in
approximately 5,000 retail outlets nationwide
12Poised for growth in FY20
Focus on brand identity, guest experience & innovation
1H20
▪ Launch new brand identity, begin rebranding rollout and test
enhanced media plan in one market
▪ Virtual reality platform established:
▪ Rollout of VR Rabbids system-wide completed January 2019
▪ Beat Saber VR attraction system-wide roll-out completed August
2019
▪ Multi-player Hologate VR attraction will be in select centres by
October 2019
▪ Refine service model and invest in guest-facing technology
▪ Complete rollout of national gift card program to over 5,000 retail
locations
▪ Kids Eat Free on Tuesday rollout completed July 2019
2H20
▪ Birthday party reinvention rollout
▪ Complete new centre design work
▪ Remodel two centres (Q4 FY20)
▪ Meaningful contributions from new national gift card program after
the holidays
▪ Multiple entertainment innovation tests
▪ Completion of system infrastructure work to enable guest
technology enhancements
▪ Deployment of handheld technology and kiosks within the centre
and development of mobile app to enhance guest experience 13Poised for growth in FY20
Four new centre openings in FY20; 5-8 openings each year thereafter
New Centre Development Current Centre Count
▪ Added key leadership and resources to
rebuild real estate process
▪ Four centres opening FY20; three are
in new markets
▪ Robust pipeline building for FY21 and
FY22
▪ Significant whitespace; multiple
states/markets focused on
1
▪ Family-friendly brand desirable, 1
particularly among retail/mail landlords
▪ Quality of finish-out and product
offering further distinguishes the brand
▪ Stand-alone credit facility enhances
ability to grow and stand apart
▪ Becoming a preferred tenant among
many landlords
14Theme Parks
Overview
Revenue broadly in line with pcp and average per capita spend increases

A$m                                                             FY192            FY182        Variance
                                                                                                                       Theme Parks performance:
Revenue                                                          67.1             66.8           0.5%
                                                                                                                       ▪ Attendance in FY19 was adversely impacted by the
Expenses                                                        (86.9)          (160.6)         45.9%                    Coronial Inquest hearings held between June and
                                                                                                                         December 2018, along with Sky Voyager not opening in
EBITDA1                                                         (19.8)           (93.8)         78.9%                    Q4 as anticipated

EBITDA1 margin                                                (29.5%)          (140.4%)       110.9 pts                ▪ Revenue was broadly in line with the pcp, due mainly to
                                                                                                                         an increase in the average per-capita spend of 17.4% at
Specific Items impacting EBITDA3                                 (9.8)           (86.3)         88.6%                    Dreamworld and 13.1% for the Theme Parks division,
                                                                                                                         which includes SkyPoint
EBITDA1 excluding Specific Items                                (10.0)            (7.5)        (32.4%)
                                                                                                                       ▪ Excluding Specific Items1, the Theme Parks division
EBITDA1 margin excluding Specific Items                       (14.8%)           (11.3%)        (3.5) pts                 recorded an EBITDA loss of $10 million in FY19
                                                                                                                         compared to an EBITDA loss of $7.5 million in the prior
Depreciation and amortisation                                    (9.2)            (8.7)         (6.3%)                   period due to higher costs across the entire business
                                                                                                                         including in the safety and repairs and maintenance
EBIT1 excluding Specific Items                                  (19.2)           (16.2)        (18.4%)                   areas. Nevertheless, EBITDA (excluding Specific Items) in
                                                                                                                         2H19 has improved by 29.7% compared to pcp reflecting
                                                                                                                         the benefit of the expense reduction programme
                                                                                                                         implemented during the 2H19
Attendance ('000s)                                             1,459.6          1,642.9        (11.2%)
                                                                                                                       ▪ The restructuring that has already occurred, the opening
                                                                                                                         of Sky Voyager on 23 August 2019 and other key projects
                                                                                                                         planned for FY20 should see Dreamworld experience
                                                                                                                         growth in both attendance and revenue during FY20

1   Refer defined terms
2   FY19 comprised of results from 27 June 2018 to 25 June 2019 (364 days); FY18 comprised of results from 1 July 2017 to 26 June 2018 (361 days)                              16
3   Breakdown of Specific Items impacting results are provided in the Appendices
Key achievements 2H19
Solid platform re-established – Dreamworld set up for return to
profitability in FY20
▪ A capable and highly experienced leadership team is now in place which includes:
▪ New operations executives with extensive theme park industry experience
▪ Engineering and safety executives recruited from the Australian Aviation industry
▪ The guest experience has been enhanced:
▪ Ride reliability and availability has improved
▪ 23,000 people attended the Cosentino Grand Illusionist show in the 16 days between 6-21 April
▪ Our new annual event Winterfest was well received by our guests, resulting in attendance growth at
Dreamworld over the July 2019 school holidays of 12.3% compared to pcp
▪ Park After Dark events ‘Neon Nights’ and ‘Winterfest Nights’ both sold out well in advance
▪ Per capita spend for F&B and retail at Dreamworld has improved by 6.4% and 4.1% respectively compared to
the pcp, with no margin erosion
▪ The annual expense base on a like-for-like basis has been reduced by approximately $5.5 million
17Key achievements 2H19
Solid platform re-established – Dreamworld set up for return to
profitability in FY20
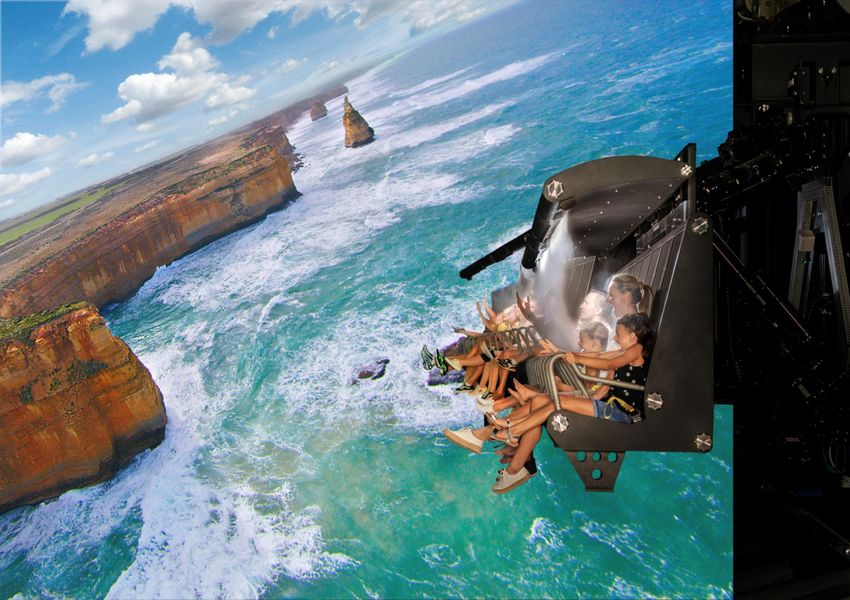
18Sky Voyager approved
World class flying theatre i-Ride – first of its kind in the Southern
Hemisphere
▪ Sky Voyager has been approved by the Queensland regulator and will open to the public on 23 August 2019
▪ 24 i-Rides launched globally across 14 countries, with a further 19 in construction right now
▪ In 2018, over 13 million people rode an i-Ride around the world in locations including Europa Park Germany-
Europe’s most awarded theme park, Legoland Florida, Mall of America in Minnesota and Warner Bros. World,
Abu Dhabi which is the world’s first indoor theme park
▪ Based on the success of similar rides in other parts of the world and the pent-up demand for new product in
our market we are confident that the launch of Sky Voyager will be a great success
19Coronial Inquest
Coroner’s report expected towards the end of 2019
Coroner’s Report
▪ Coroner’s report expected towards end of 2019
▪ As previously stated, the Board is committed to implementing the Coroner’s recommendations in consultation
with Workplace Health and Safety Queensland (WHSQ) and the theme park industry
Continuous improvements in safety
▪ Queensland Government introduced new major amusement park safety regulations on 1 May 2019, including
the move to a ‘Safety Case’ licensing model
▪ The Board strongly supports the new regulations which will be a global benchmark
▪ Dreamworld continues to implement best practice safety initiatives across the Theme Park business
▪ The new management team brings extensive experience from the theme park and aviation industries
20Industry opportunity
Prize is up for grabs – template for success
▪ Attendance has reduced by approximately 1.6 million people across Gold Coast theme parks since FY16. This
equates to a loss of revenue to the industry estimated to be in the order of $130 million based on increased
yields that are being experienced at Gold Coast theme parks
▪ This thematic suggests there is pent up demand in the market
▪ With careful investment in new product, Dreamworld can win more than its fair market share of the expected
industry recovery and restore its earnings to historical levels or better over the next 3-5 years
▪ Research shows other theme parks have achieved a successful turnaround by focusing on:
▪ Investing in core rides and attractions
▪ Increasing entry price commensurate with investment and resisting the temptation to enter a price war
▪ Effective use of technology such as new ticketing and marketing platforms
▪ Constantly improving F&B and retail and making regular small investments in key guest facing areas
▪ Consistently demonstrating the value of the Annual Pass by staging regular events
▪ Staying lean by controlling operating expenses
21Our plan to restore value for shareholders
‘Game changer’ – new Roller Coaster for Dreamworld
▪ Construction to commence in Q1 FY20
▪ We have chosen to work with MACK Rides who is a Tier 1 ride manufacturer from Germany with over 230
years experience
▪ The design is based on the highly successful MACK Blue Fire Launch coaster which operates in 14 locations
around the world including Europa Park, Disney Hollywood Studio’s and Cedar Fair Carowinds
▪ Of the 70 attractions at Europa Park which is Europe’s most awarded theme park, Blue Fire is ranked the
number one coaster
▪ Blue Fire is proven to have broad market appeal and is the winner of multiple industry awards and regularly
features in the best ranked coaster experiences in the world
▪ Yet to be named, the new coaster’s key features include
▪ The Southern Hemisphere’s first multiple launch with stall and reversed twisted half pipe
▪ The World’s first separate spinning gondola attached to the rear of the rollercoaster train
▪ A 1.2 km long track with multiple inversions and achieves a maximum velocity of 105 km/h
22Our plan to restore value for shareholders
WhiteWater World to undergo a major transformation
▪ Works have commenced on the refurbishment and expansion of WhiteWater World including:
▪ The construction of a new water slide complex incorporating six body slides attached to a 13 metre tower.
The new slide will be highly visible from the M1 Motorway and the slide format chosen will fill a gap in our
current offer
▪ The complete refurbishment of all existing slides including re-painting and gel coat application along with
improvements to the general amenity of WhiteWater World
▪ When the new slide is complete, we intend to re-introduce a separate entry fee for non-annual pass
holders. This will reward our loyal pass holder’s by adding considerable value to their passes
23Our plan to restore value for shareholders
Other key projects planned for implementation in FY20
▪ Implementation of ‘Safety Case’ and further enhancement of safety systems
▪ The staging of special events and entertainment every school holidays including two major annual events (one
being Winterfest) to add value to the annual pass and increase sales
▪ Implementation of a new ticketing and marketing system to increase share of wallet by improving the online
experience, increasing higher yielding sales and allowing more flexible bundling and pricing options
▪ Commence the refurbishment and expansion of the ABC Kids/Wiggles precinct
▪ Completion of the site master plan showing the footprint for the leisure / theme park precinct and surplus land
that could then be improved and made available for commercial development with partners
▪ Preparation of a pipeline of additional rides, attractions and systems for installation over the next 3-5 years
24Group – Corporate Costs & Capital Management
25Net debt and cash flow
A$m FY19 As at 26 June 2018 A$m
Net debt at 26 June 2018 (11.3) Debt (27.8)
Operating cash inflows 32.5 Cash 16.5
Capital expenditure (cash outflow) (76.1) Net debt (11.3)
Proceeds from sale of plant and equipment 0.2
Insurance recoveries relating to damaged assets 2.0
Sale of Bowling & Entertainment, net of cash disposed 2.7
Borrowing costs (18.7)
Distributions1 (14.3)
Foreign exchange translation (4.3)
(76.0) As at 25 June 2019
Net debt at 25 June 2019 (87.3) Debt (179.6)
Cash 92.3
Net debt (87.3)
1 Distribution of 6.5 cents per security paid in August 2018
26Capital structure and funding
The Group has sufficient headroom to fund future capex and business
operations
▪ On 5 April 2019, the Group successfully completed the refinancing of its debt with US lenders
▪ Under the new arrangements, Main Event Entertainment Inc is now the borrower of the Group and holds the
following debt facilities:
Limit Drawn Margin on Undrawn Amortisation
(US$'m) (US$'m) Maturity drawn amount commitment fees of term loan
Funded term debt 125.0 125.0 6 years 6.50% 3.25% 1% per annum
Delayed draw term debt 75.0 - 6 years 6.50% 3.25% 1% per annum
Revolving credit facility 25.0 - 5 years 6.50% 0.50% N/a
Total 225.0 125.0
▪ The proceeds of the drawn term loan were used to repay Ardent’s existing Australian bank debt facility, and
the balance of the proceeds will be available to support investment in Theme Parks and Main Event as well
as general corporate purposes
▪ The Group has US$100 million of undrawn capacity and A$92 million of cash balance as at 25 June 2019
27Corporate costs
▪ Gradual reduction in recurring corporate costs
▪ FY19 impacted by one-off costs associated with destapling and corporatisation, consulting and employee
related costs
Corporate costs (A$m)
19.2
2.7
15.1 15.5 15.1
3.5
5.1
16.5
15.1
12.0
10.0
FY16 FY17 FY18 FY19
Recurring Coporate Costs Non-recurring significant items
28Lease accounting and capital management
New lease accounting standard
▪ The Group has adopted the new lease accounting standard (AASB 16) from 26 June 2019, utilising the
modified retrospective approach (comparative amounts will not be restated)
▪ While the implementation of AASB 16 will significantly change reported results, it has no economic impact on
the Group
▪ The impact of this new standard will be significant to Main Event as all of its centres operate under lease
agreements
▪ The estimated pre-tax impact on the balance sheet as of 26 June 2019:
▪ New right-of-use assets: approximately $320 million
▪ New lease liabilities: approximately $360 million
▪ EBITDA will materially increase as a result of operating leases being replaced by depreciation and finance
costs
Capital management
▪ Given the reinvestment of earnings and available capital into the business to drive growth at Main Event and
support the recovery efforts at Dreamworld through the development of new attractions, the Board has
declared there will be no dividend for FY19
▪ Future dividend payments will be dependent on the performance, gearing levels and capital requirements of
the Group
29Outlook
Main Event
▪ Constant centre revenue increase of 1-2%
▪ Four new centres in FY20 adding approximately 60 additional operating weeks
▪ Average prototype centre net capex of US$8.5 million
▪ Anticipate to open 5-8 new centres a year from FY21 and thereafter
▪ Targeting 20% EBITDA margins (excluding Specific Items) in the medium term
Theme Parks
▪ Sky Voyager will open on 23 August 2019 and is expected to increase attendance
▪ Plan to invest approximately $50 million on new rides, attractions and systems over the next 3-5 years with
significant investment to occur in FY20
▪ Continue to focus on reducing expenses
▪ The proposed investment on new rides along with improvements made in 2H19 is expected to set
Dreamworld on the path to recovery, with the aim of returning to historical pre-incident earnings or better over
the next 3-5 years
▪ Completion of the site master plan showing the footprint for the leisure / theme park precinct and surplus land
that could then be improved and made available for commercial development with partners
▪ We have the plan and experienced team in place to implement a turnaround, however it will take time and
investment
30Appendices
31Specific Items by business unit – FY19
Consolidated
Main Theme Continuing Discontinued
A$m Event Parks Corporate Operations Operations Total
Statutory EBITDA 47.2 (19.8) (15.1) 12.3 (0.6) 11.7
Specific Items impacting EBITDA:
Impairment of property, plant and equipment (17.6) (17.6) (17.6)
Provision for onerous lease contract (3.1) (3.1) (3.1)
Dreamworld incident costs, net of insurance recoveries (5.4) (5.4) (5.4)
Pre-opening expenses (2.8) (2.8) (2.8)
Restructuring and other non-recurring items (5.2) (3.0) (4.8) (13.0) (13.0)
Selling costs associated with discontinued operations - (0.6) (0.6)
Net gain/(loss) on disposal of assets 1.7 (1.4) (0.3) - -
Total (27.0) (9.8) (5.1) (41.9) (0.6) (42.5)
Specific Items impacting tax expense:
Tax impact of Specific Items above 5.7 3.2 1.5 10.4 10.4
Impact of destapling and corporatisation 3.9 3.9 3.9
Australian tax losses for which deferred tax asset derecognised (12.4) (12.4) (12.4)
Estimated tax payable in respect of prior periods (15.9) (15.9) (15.9)
Total 5.7 3.2 (22.9) (14.0) (14.0)
32Specific Items by business unit – FY18
Consolidated
Main Theme Continuing Discontinued
A$m Event Parks Corporate Operations Operations Total
Statutory EBITDA 14.1 (93.8) (15.5) (95.2) 41.2 (54.0)
Specific Items impacting EBITDA:
Valuation loss - property, plant and equipment and investment held at fair
(75.0) (0.4) (75.4) (75.4)
value
Impairment of intangible assets including goodwill (3.6) (1.2) (4.8) (4.8)
Impairment of property, plant and equipment (38.3) (1.0) (39.3) (39.3)
Dreamworld incident costs, net of insurance recoveries (6.2) (6.2) (6.2)
Pre-opening expenses (5.9) (5.9) (0.6) (6.5)
Restructuring and other non-recurring items (7.4) (1.8) (9.2) (9.2)
Gain on sale of discontinued operations 25.0 25.0
Selling costs associated with discontinued operation (0.1) (0.1)
Loss on disposal of assets (0.6) (0.5) (0.1) (1.2) (0.9) (2.1)
Total (52.2) (86.3) (3.5) (142.0) 23.4 (118.6)
Specific Items impacting tax benefit:
Tax impact of Specific Items above 14.6 1.9 1.1 17.6 0.5 18.1
Restatement of deferred tax balances to reflect US tax reforms 12.2 12.2 12.2
Total 26.8 1.9 1.1 29.8 0.5 30.3
33Capital expenditure and pre-opening expenses
FY19
Routine Other Special Development Pre-opening
A$m Capex Projects Capex1 Expenses
Main Event 7.1 16.8 24.2 2.8
Theme Parks 9.2 - 19.9 -
Total 16.3 16.8 44.1 2.8
1 Net of developer proceeds and tenant improvement allowances
34Defined Terms
35Defined terms
Defined Terms Description
Bowling & Entertainment Comprised of AMF, Kingpin and Playtime
Cash-on-cash return The ratio of annual before-tax cash flow to the total amount of cash invested
EBITDA Earnings before Interest, Tax, Depreciation and Amortisation
EBRITDA Earnings before Property Costs, Interest, Tax, Depreciation and Amortisation
EBIT Earnings before Interest and Tax
F&B Food and beverage
G&A General and administrative expense
Main Event 4-wall EBITDA Centre-level EBITDA, excludes corporate and district G&A and Specific Items
30 centres that have been open for at least 18 months at the beginning of the current financial year
Constant centres comprised of Lewisville (TX), Grapevine (TX), Plano (TX), Ft Worth South (TX),
Main Event constant Shenandoah (TX), Austin (TX), Lubbock (TX), Frisco (TX), San Antonio North (TX), Katy (TX), Stafford (TX),
centres Tempe (AZ), Alpharetta (GA), Pharr (TX), San Antonio West (TX), Warrenville (IL), Atlanta (GA), Oklahoma
City (OK), Tulsa (OK), Independence (MO), Memphis (TN), ), Avondale (AZ), Ft Worth North (TX), Louisville
(KY), West Chester (OH), Albuquerque (NM), Hoffman Estate (IL), Olathe (KS), Orlando (FL) and Suwanee
(GA)
Main Event impaired
Comprised of Orlando (FL), Jacksonville (FL), Indianapolis (IN), Pittsburgh (PA) and Warrenville (IL)
centres
36Defined terms
Defined Terms Description
PCP Prior corresponding period
PP&E Property, plant and equipment
Pre-opening costs Costs that are expensed as incurred prior to a centre opening for business
ROI Return on investment
Significant non-trading income or expense items which are non-cash or non-recurring in nature. These are
Specific Items
separately disclosed as management believe this is useful in better understanding the statutory results
Theme Parks Comprised of Dreamworld, WhiteWaterWorld and SkyPoint
WHSQ Workplace Health and Safety Queensland
37You can also read