Efficient Allocation of Customers to Facilities in the Multi-Objective Sustainable Location Problem - MDPI
←
→
Page content transcription
If your browser does not render page correctly, please read the page content below
sustainability

Article
Efficient Allocation of Customers to Facilities in the
Multi-Objective Sustainable Location Problem
Xifeng Tang * , Jiantao Wu and Rui Li
 College of Civil and Transportation Engineering, Hohai University, Nanjing 210098, China;
 Jiantao.wu@hhu.edu.cn (J.W.); and lirui2012@hhu.edu.cn (R.L.)
 * Correspondence: xtang12@iit.edu; Tel.: +86-138-5196-2244

 Received: 18 August 2020; Accepted: 14 September 2020; Published: 16 September 2020

 Abstract: This paper aims to evaluate the impact of customer allocation on the facility location in the
 multi-objective location problem for sustainable logistics. After a new practical multi-objective location
 model considering vehicle carbon emissions is introduced, the NSGA-II and SEAMO2 algorithms are
 employed to solve the model. Within the framework of each algorithm, three different allocation
 rules derived from the optimization of customer allocation based on distance, cost, and emissions are
 separately applied to perform the customer-to-facility assignment so as to evaluate their impacts. The
 results of extensive computational experiments show that the allocation rules have nearly no influence
 on the solution quality, and the allocation rule based on the distance has an absolute advantage of
 computation time. These findings will greatly help to simplify the location-allocation analysis in the
 multi-objective location problems.

 Keywords: sustainable logistics; multi-objective location problem; location-allocation analysis;
 NSGA-II; SEAMO2; CPLEX optimizer

1. Introduction
     Location decision on logistics facilities plays a critical role in the strategic design of supply chain
networks to ensure efficient and effective goods movement. It determines where goods are stored,
what quantity of goods is held in inventory, how goods are shipped from raw material sites to component
fabrication or assembly plants, as well as how the finished products are delivered to customers. On the
other hand, location projects of logistics facilities are generally viewed as long-term investments due to
the high costs associated with facility construction. It is often difficult for business owners to reverse
their original decisions even if some inputs of decisions change over a long period of time. Inadequate
locations of logistics facilities will result in excessive costs throughout their service lives, no matter
how well the transportation option, inventory management, and information sharing mechanism are
optimized in response to the changing conditions [1].
     Traditionally, the facility location problem (FLP) was formulated as a single objective model to
minimize the total costs, which is usually expressed as the sum of shipping and opening costs.
This modeling approach, however, is facing challenges in addressing the need for real-world
complexities. With increasing environmental concerns, thinking objective functions other than
economic costs, e.g., environmental impacts, are becoming a must [2,3]. Companies would benefit from
using multi-objective optimization (MOO) techniques when designing their logistics networks. Instead
of a single solution (often optimized on costs), the MOO techniques can offer the decision-maker a
choice of tradeoff solutions. It may be quite possible, for example, to greatly reduce greenhouse gas
(GHG) emissions while incurring a slight increase in economic costs. However, such compromise
solutions can be easily missed by the traditional single-objective optimization.

Sustainability 2020, 12, 7634; doi:10.3390/su12187634                      www.mdpi.com/journal/sustainability
Sustainability 2020, 12, 7634 2 of 12
As we know, the FLP is always concerned with the allocation of customers to facilities.
In other words, it involves making decisions at two levels: (1) Determining which facilities should
be selected from a set of candidate sites, and (2) determining which facility each customer should be
assigned to. Level 1 is usually regarded as the strategic decision because it is often difficult to change
even in the intermediate term due to the high costs of facility construction. Once logistics facilities are
in place, however, it is a common practice to periodically reassess the allocation of customers at Level 2,
which belongs to the tactical decision. Since the assignment of customers to facilities at Level 2 is an
essential part for making the strategic decision at Level 1, it will be of great significance to investigate
the impact of the allocation of customers on the location of facilities.
The main purpose of this study is to evaluate the impact of customer allocation on the facility
location in the multi-objective location context and the scientific contributions of this study are
three-fold. First, it proposes a new practical multi-objective location model for sustainable logistics in
which the objectives are to minimize economic costs and carbon emissions simultaneously. Second,
two well-known multi-objective genetic algorithms, including non-dominated sorting genetic algorithm
II (NSGA-II) and simple evolutionary algorithm for multi-objective optimization 2 (SEAMO2),
are hybridized with the CPLEX optimizer to solve the model. Third, three allocation rules derived from
the optimization of customer allocation based on distance, cost, and emissions are used to perform the
assignment of customers so as to evaluate their impacts.
The remainder of this paper is constructed as follows. Section 2 reviews the literature closely
related to this study. Section 3 introduces our multi-objective sustainable location model. Section 4
describes two genetic algorithms, as well as the implementation of three allocation rules. Section 5
reports the results of computational experiments, and finally, conclusions are made in Section 6.
2. Literature Review
The study on the FLP can be traced back to 1909, when Alfred Weber considered how to position
a single depot for minimizing the total distance between the depot and several customers [4].
Over the years, significant research progress has been made in this field. To limit our scope,
the following survey will concentrate on the literature closely pertinent to this study. Thorough
reviews of the FLP can be found in several publications [5–9]. Textbook treatments include [10–12].
2.1. The Multi-Objective FLP
Some studies [3,13] provided comprehensive reviews on multi-objective facility location modeling.
These two papers found that most multi-objective models tend to include an economic objective
(e.g., cost, profit, or revenue) and other objectives, such as environmental impacts, coverage, or distance,
equity, and service quality. Furthermore, Eskandarpour et al. [2] reviewed the sustainable FLP that
contains at least two or three dimensions of sustainable development: Economic aspects, environmental
performance, and social responsibility.
Integration of environmental performance into the FLP is a natural idea to cope with the growing
concern for environmental risks. In the literature, environmental performance has been measured by
many possible criteria that generally arise from the economic sectors concerned, such as GHG emissions,
waste produced, energy consumed, and materials recovered [14–19].
Carbon footprint, which is the total equivalent amount of GHG emitted by a company or
a supply chain, is the most popular metric for measuring environmental impacts among the
aforementioned criteria. For example, Mogale et al. [15] presented a bi-objective decision support
model for food grain supply chain with the objectives of minimizing the cost and carbon dioxide
(CO2 ) emissions. The approach of fixed transportation emissions per vehicle was used to calculate
the total transportation emissions. Baud-Lavigne et al. [20] proposed a joint family product and
supply chain optimization model that considers carbon footprint and economic costs simultaneously.
Carbon footprints from production, transportation, and components were all considered in their
optimization model. In a study conducted by Ghodratnama et al. [16], a MOO model was developedSustainability 2020, 12, 7634 3 of 12
to solve a capacitated single-allocation hub location problem. The objectives are to minimize the total
transportation and installation costs, the weighted sum of service times in the hubs, as well as the total
GHG emitted by vehicles and plants. Canales-Bustos et al. [21] introduced a multi-objective model for
the design of an effective decarbonized supply chain in mining. They considered the transportation
and installation costs as the economic objective, the emissions from transportation and operations as
the environmental objective, and the efficiency of processing plants as the technological objective. In
addition, Das and Roy [22] presented a multi-objective transportation-p-facility location problem that
integrates the FLP and the transportation problem. In this study, three objectives, including the total
transportation costs, transportation time, and carbon emission costs, were considered.
2.2. Solution Methods for the Multi-Objective FLP
The MOO problem is very common in the real world and such problem is featured by an optimum
set of alternative solutions, known as Pareto-set, rather than by a single optimum [23,24]. There have
been a wide variety of solution methods capable of finding the Pareto-set of a MOO problem.
The literature related to MOO techniques in the facility location field can be broadly grouped into
two categories: (1) Research applying the classical/preference-based methods and (2) that applying
the metaheuristics. In classical methods, a MOO problem would be converted into a single objective
formulation using the weighted sum or the ε-constraint approach, for example. This can be found
in several studies [20,25–27]. The main advantage of classical methods is to model and solve the
multi-objective problem with single-objective approaches. However, various values of weightings
must be given in order to approximate the Pareto front.
Compared to the classical methods, the metaheuristic algorithms can offer the flexibility to
select good compromise solutions that balance various objectives, so that the decision-maker has a
choice of tradeoff solutions without the need of a prior decision regarding the relative importance
of various objectives. In the literature, the metaheuristics have been widely used to solve the
multi-objective FLP. For example, Altiparmak et al. [28] developed a solution procedure based on
genetic algorithm for a single product, multi-stage network problem that minimizes the total costs,
minimizes equity of the capacity utilization ratio, and maximizes customer service simultaneously.
Chibeles-Martins et al. [29] presented a metaheuristic algorithm based on the simulated annealing
methodology for a bi-objective mixed linear programming model with economic and environmental
objectives. In a study by Shen [30], a hybrid genetic algorithm based on variable-length chromosome
coding was proposed to solve the deterministic equivalence of their multi-objective chance-constrained
model for uncertain sustainable supply chain network. Three methods, including the ε-constraint,
NSGA-II, and multi-objective particle swarm algorithms, were used by Ghezavati and Hosseinifar [31]
to minimize the total amount of value at risk and the total costs of the network in a bi-objective hub
location problem.
This extensive literature review indicates that there exist a large number of models and solution
methods for the multi-objective FLP, but very few studies have investigated the impact of customer
allocation on the facility location. To our knowledge, there exists only one paper contributed by
Harris et al. [32] to date. In this study, a multi-objective location model considering economic costs
and CO2 emissions simultaneously and the SEAMO2 algorithm embedded with Lagrangian relaxation
were proposed for the design of green logistics networks. Two customer allocation rules in respect
of two objectives were used to examine the flexibility of customer allocations and the robustness
of location solutions. In contrast, our study presents the following advances: (1) Presenting a new
practical multi-objective location model for sustainable logistics, (2) proposing two genetic algorithms
embedded with the CPLEX optimizer to solve the problem, and (3) applying more allocation rules
(both related and irrelated to the objectives) to perform the assignment of customers for assessing
their impacts.Sustainability 2020, 12, 7634 4 of 12
3. Mathematical Model
Location decisions on logistics facilities are inherently strategic and long term in nature. There are
likely to be many possibly conflicting objectives that need to be considered. With increasing concerns
over environmental sustainability, reducing carbon emissions from logistics operations is becoming
a part of business owners’ social responsibility. On the other hand, business owners would like to
minimize their economic costs. Thus, there is a tradeoff between carbon emissions and economic costs.
The proposed model, as we shall see, can assist in qualifying this sort of tradeoff.
As we know, the covering, p-median, p-center, and fixed-charge location model are at the heart
of many models that have been widely used to locate logistics facilities [11,12]. For addressing the
real-world complexities, they have been variously extended [2,13]. In the literature, there exist a
considerable number of approaches that can be incorporated into them for estimating the carbon
emissions from freight transport [33]. However, those approaches are often too complex to be used
in practice. In this study, the capacitated fixed-charge location model is employed and extended
to a MOO by considering environmental issues, based on a very practical approach for calculating
carbon emissions. The proposed multi-objective location model is a mixed-integer linear programming
model and can be formulated as follows.
X XX
Min f i Xi + cij h j dij Yij (1)
i∈I i∈I j∈J
X Xh l mi
Min εv f − εve h j /w + εve h j /w dij Yij (2)
i∈I j∈J
X
S.t. Yij = 1, ∀ j ∈ J (3)
i∈I
X
h j Yij ≤ Qi Xi , ∀i ∈ I (4)
j∈J
Xi ∈ {0, 1}, ∀i ∈ I (5)
Yij ∈ {0, 1}, ∀i ∈ I, j ∈ J (6)
where fi is the opening cost of candidate facility i (i ∈I, I is the set of candidate facilities), hj indicates the
demand of customer j (j ∈J, J is the set of known customers), cij and dij stand for the unit shipping cost
and the distance between facility i and customer j, respectively, w denotes the rated load capacity of
homogenous trucks, εvf and εve represent the carbon emission rate of a fully loaded truck and that of
an empty truck, respectively, Qi gives the maximum capacity of facility I, [x] is the minimum integer
great than or equal to x. Binary decision variable Xi is equal to 1 if candidate facility i is open, and 0
otherwise, Yij takes the value of 1 if customer j is assigned to facility i, and 0 otherwise.
Objective function (1) is the classical economic objective that aims to minimize the total costs.
It consists of the variable shipping costs of serving the demand of customers and the fixed costs
of running the open facilities. Objective function (2) acts to minimize the total carbon emissions
from vehicles. The term in square bracket estimates the amount of carbon emissions per unit distance
from a truck with a load of hj . Constraints (3) state that each customer can be assigned to exactly
one open facility. Constraints (4) ensure that the capacity limit of each facility cannot be violated.
Constraints (5) and (6) define decision variables as binary.
4. Solution Algorithms
In this study, the NSGA-II and SEAMO2 algorithms are employed to determine which facilities
should be opened at Level 1. Within the framework of either algorithm, three different allocation rules
are separately applied to perform the assignment of customers to open facilities at the tactical level.Sustainability 2020, 12, x FOR PEER REVIEW 5 of 13
widely and evenly distributed. These enable the NSGA-II to possess all the qualities that are needed
Sustainabilityto2020,
be considered
12, 7634 when solving a MOO problem. Figure 1 presents the framework of the NSGA-II. 5 of 12
In contrast, the SEAMO2 developed by Mumford [34] relies on much simpler techniques. It
disposes of all selection mechanisms based on fitness values and utilizes a straightforward uniform
4.1. General selection procedure
Structures instead,
of Two i.e., the algorithm sequentially selects each individual in the population
Algorithms
to serve as the first parent once and pairs it with the second parent selected randomly from the
The NSGA-II
population.developed by Debranking
Thus, no dominance et al. [23] is widely
is required. recognized as
The improvements a leadingand
in population multi-objective
the
evolutionary progress of genetic It
algorithm. search depend
is elitist andentirely
usesupon the replacementprinciples
non-dominated strategy. Theto
offspring
ensurereplaces a
the solutions are
current member of the population following three simple rules: if any of best-so-for objectives are
widely andimproved
evenly or distributed. These enable the NSGA-II to possess all the qualities that are needed to
if the offspring dominates either of its parents or if the offspring is neither dominated
be considered by norwhen solving
dominates eitheraparent.
MOOFigure problem. Figure
2 outlines 1 presents
the framework of the framework of the NSGA-II.
the SEAMO2.
Figure
Figure 1. Theframework
1. The framework ofof
thethe
NSGA-II.
NSGA-II.
In contrast, the SEAMO2 developed by Mumford [34] relies on much simpler techniques.
It disposes of all selection mechanisms based on fitness values and utilizes a straightforward uniform
selection procedure instead, i.e., the algorithm sequentially selects each individual in the population to
serve as the first parent once and pairs it with the second parent selected randomly from the population.
Thus, no dominance ranking is required. The improvements in population and the progress of genetic
search depend entirely upon the replacement strategy. The offspring replaces a current member of the
population following three simple rules: if any of best-so-for objectives are improved or if the offspring
dominates either of its parents or if the offspring is neither dominated by nor dominates either parent.
Figure 2 outlines the
Sustainability framework
2020, of the SEAMO2.
12, x FOR PEER REVIEW 6 of 13
Figure
Figure 2. Theframework
2. The framework ofof
thethe
SEAMO2.
SEAMO2.
4.2. Assignment of Customers to Facilities
As can be seen in Figures 1 and 2, the allocation of customers to open facilities is an essential
part of making location decisions. Within the framework of each algorithm, three different allocation
rules are separately used to perform the customer-to-facility assignment so as to evaluate their
impacts. Rule 1 assigns each customer to its nearest open facility with sufficient capacity to serve itSustainability 2020, 12, 7634 6 of 12
4.2. Assignment of Customers to Facilities
As can be seen in Figures 1 and 2, the allocation of customers to open facilities is an essential part
of making location decisions. Within the framework of each algorithm, three different allocation rules
are separately used to perform the customer-to-facility assignment so as to evaluate their impacts.
Rule 1 assigns each customer to its nearest open facility with sufficient capacity to serve it using the
greedy heuristic, which bears no explicit relation to two objectives. Rules 2 and 3 are associated with
the economic and environmental objectives, respectively. The assignment of customers following Rule
2 or 3 will be implemented by the CPLEX optimizer.
For Rule 2 (regarding economic objective), once facility location decision is made at the
strategic level, the opening costs of facilities will be confirmed and become a fixed value. Thus,
minimizing the sum of shipping and opening costs in objective function (1) can be reduced to minimize
only the shipping costs, as shown in Expression (7).
XX
Min ck j h j dk j Yk j (7)
k j∈J
where k∈Iopen (Iopen is the set of open facilities). Expression (7) aims to minimize the transportation
costs of assigning all customers to open facilities while subject to the following constraints.
X
Yk j = 1, ∀j ∈ J (8)
k∈Iopen
X
h j Yk j ≤ Qk , ∀k ∈ Iopen (9)
j∈J
Yk j ∈ {0, 1}, ∀k ∈ Iopen , j ∈ J (10)
Obviously, the model formulated by Expressions (7)–(10) is a generalized assignment problem
that can be readily solved by the CPLEX optimizer. Rule 3 (regarding environmental objective) can be
handled in the same way. For the sake of brevity, it is not repeated.
5. Computational Experiments
5.1. Experiment Setups
In the literature, a considerable number of benchmark instances are available for the single
objective facility location problems. Unfortunately, those data instances only contain demand, capacity,
distance, and cost elements, and there is no information regarding vehicle emissions that is needed to
apply our MOO model. For this reason, a total of 57 benchmark instances from Delmaire et al. [35]
(available at http://www-eio.upc.es/~elena/sscplp/index.html) were employed and modified to carry
out our experiments. All these instances were supplemented with the carbon emission rate of a fully
loaded truck εvf = 1.096 and that of an empty truck εve = 0.772.
The proposed algorithms were coded in MATLAB R2018b. For each test on an instance, ten
replicated runs were performed with each allocation rule and each algorithm. For either algorithm,
an initial population twice the size of potential facilities was generated at random. The crossover
probability and the mutation probability were 0.9 and 0.1, respectively. The maximum number of
generations was set to 200 since the solutions for the instances become stabilized.
5.2. Experimental Results
To avoid data overload, only the results of one tested instance (named p27) with 50 customers
and 20 potential facilities are presented as an illustration. Tables 1 and 2 report the test results of three
allocation rules with the NSGA-II and the SEAMO2, respectively. It is not difficult to find:Sustainability 2020, 12, 7634 7 of 12
• Both the NSGA-II and the SEAMO2 are effective in approximating the Pareto fronts of the proposed
multi-objective sustainable location problem. Although the NSGA-II outperforms the SEAMO2 in
solution quality, it is outperformed by the SEAMO2 in computation time, as shown in Figures 3
and 4. The simple genetic operators of the SEAMO2 makes it much faster than the NSGA-II with
small reductions in solution quality.
• The economic and environmental objectives are conflicting, i.e., lower-cost solutions often produce
higher carbon emissions and lower-emission solutions often produce higher economic costs.
Some good compromise solutions located in the middle of Pareto fronts are generally reasonable
tradeoffs between economic costs and carbon emissions. In the sustainable logistics context,
the best choice for decision-makes is not the solutions with minimum costs, a more likely the
solutions trading off the economic costs and carbon emissions.
Table 1. Test results of three allocation rules with the NSGA-II.
Rule 1 Rule 2 Rule 3
Costs (104 ) Emissions (102 ) Costs (104 ) Emissions (102 ) Costs (104 ) Emissions (102 )
2.3049 4.9622 2.1201 6.0414 2.1201 6.0414
5.4475 1.8640 5.4475 1.8640 5.4475 1.8640
4.2961 2.0342 2.1904 5.2682 2.1936 5.2184
2.6097 3.4989 2.6097 3.4989 2.2482 4.2521
3.9397 2.2049 3.0035 2.7666 2.6097 3.4989
2.3855 3.9801 2.2472 4.2585 3.0035 2.7666
2.6217 3.2332 4.0457 2.1357 3.1775 2.6913
2.3731 4.6381 3.9397 2.2049 4.4701 1.9590
5.1391 1.8926 5.1391 1.8926 4.0457 2.1357
4.7785 1.9304 4.7785 1.9304 5.1391 1.8926
3.5287 2.4831 4.4701 1.9590 4.7785 1.9304
4.4701 1.9590 2.6217 3.2332 2.4820 3.7177
2.4852 3.8128 2.2343 4.6804 2.6217 3.2332
3.7515 2.2645 4.4338 2.0311 2.2343 4.6804
2.6030 3.6363 3.7515 2.2645 2.3843 3.9631
2.9487 2.9526 2.4820 3.7177 4.4338 2.0311
2.3800 4.3006 2.9647 2.9611 3.2914 2.5802
2.7536 3.2277 2.7536 3.2277 2.7536 3.2277
2.7747 3.0278 3.3458 2.6212 2.2340 5.0153
4.0457 2.1357 2.2340 5.0153 2.5261 3.6872
3.0035 2.7666 2.7747 3.0278 2.7747 3.0278
3.3465 2.4945 3.5775 2.3397 3.3465 2.4945
2.5426 3.7781 3.1935 2.6998 3.5775 2.3397
3.5775 2.3397 4.2339 2.0761 4.2339 2.0761
3.7152 2.3366 2.8505 2.9719 3.7515 2.2645
4.4338 2.0311 3.3465 2.4945 3.9397 2.2049
2.9049 3.0130 2.3843 3.9631 3.7152 2.3366
3.1177 2.7557 3.4842 2.4914 2.9049 3.0130
2.3208 4.8248 3.5205 2.4192 3.4842 2.4914
3.2345 2.6118 3.7152 2.3366 3.5205 2.4192
− − 2.3454 4.0815 2.9487 2.9526
Avg. time (s) 14.1 180.2 170.5
Table 2. Test results of three allocation rules with the SEAMO2.
Rule 1 Rule 2 Rule 3
Costs (104 ) Emissions (102 ) Costs (104 ) Emissions (102 ) Costs (104 ) Emissions (102 )
3.7515 2.2645 3.6319 2.3808 3.1775 2.6913
3.3465 2.4945 2.8505 2.9719 3.0035 2.7666
2.3800 4.3006 3.2345 2.6118 2.2482 4.2521
2.8505 2.9719 5.1391 1.8926 2.1936 5.2184
5.1391 1.8926 2.6449 3.4702 3.4009 2.5355
4.4701 1.9590 3.5205 2.4192 2.3843 3.9631
3.0245 2.8967 3.2319 2.7324 2.1201 6.0414
2.7747 3.0278 2.2077 5.2040 2.7957 3.1579
2.5480 3.7356 2.6587 3.3628 3.0579 2.8076Sustainability 2020, 12, 7634 8 of 12
Table 2. Cont.
Rule 1 Rule 2 Rule 3
Costs (104 ) Emissions (102 ) Costs (104 ) Emissions (102 ) Costs (104 ) Emissions (102 )
2.9049 3.0130 2.1201 6.0414 2.6097 3.4989
2.4608 4.0117 3.3465 2.4945 2.6587 3.3628
2.9096 3.0468 3.0035 2.7666 2.5097 3.9111
3.0579 2.8076 3.1935 2.6998 2.2340 5.0153
2.7360 3.3816 2.9487 2.9526 4.2961 2.0342
3.0626 2.8414 2.5261 3.6872 2.3932 4.2423
2.3855 3.9801 2.9049 3.0130 2.5261 3.6872
3.2914 2.5802 2.6217 3.2332 2.3334 4.3473
2.6313 3.4921 2.3454 4.0816 3.1177 2.7557
3.1935 2.6998 2.7536 3.2277 3.1935 2.6998
3.0035 2.7666 4.2961 2.0342 3.8717 2.2110
2.6217 3.2332 2.4590 3.9863 2.6217 3.2332
3.2345 2.6118 2.8633 3.1337 2.7536 3.2277
2.7757 3.3515 3.1919 2.7754 2.6030 3.6363
2.4059 4.1094 2.5480 3.7356 2.9487 2.9526
2.4852 3.8128 2.7747 3.0278 2.4820 3.7177
2.9487 2.9526 2.6097 3.4989 2.2703 4.7859
2.6030 3.6363 2.4820 3.7177 2.3801 4.2853
3.9397 2.2049 3.1775 2.6913 2.3454 4.0816
2.6517 3.6214 2.7957 3.1579 2.9049 3.0130
3.1177 2.7557 3.5276 2.4630 2.2343 4.6804
2.6824 3.5093 2.9647 2.9611 2.9096 3.0468
3.1775 2.6913 3.0057 2.8731 3.3465 2.4945
2.7957 3.1579 3.2914 2.5802 3.1384 2.7855
2.5426 3.7781 2.8527 3.0784 5.3594 1.9935
2.7536 3.2277 2.1960 5.3039 2.7757 3.3515
2.3208 4.8248 3.7515 2.2645 2.4852 3.8128
2.9647 2.9611 2.3843 3.9631 2.6313 3.4921
2.8527 3.0784 3.4009 2.5355 2.7747 3.0278
2.6097 3.4989 3.1177 2.7557 3.5775 2.3397
3.0057 2.8731 3.5775 2.3397 2.8505 2.9719
Avg. time (s) 10.3 135.3 132.5
More importantly, the following observations should be emphasized.
• Over 60% solutions obtained with Rule 1 are the same as those obtained with Rules 2 and 3 (18 of
30 for the NSGA-II and 27 of 40 for the SEAMO2), as highlighted in boldface in Tables 1 and 2.
Further, the generational distances (GDs) between every two Pareto fronts are very close, as seen
in Table 3. The GD was proposed by Van Veldhuizen and Lamont [36] as a measure of distance
between two Pareto fronts and can be calculated as follows.
v
t n
X
GD = di /n (11)
i=1
where di denotes the Euclidean distance between the ith point on one Pareto front and its nearest
point on another Pareto front, and n is the number of points on the Pareto front.
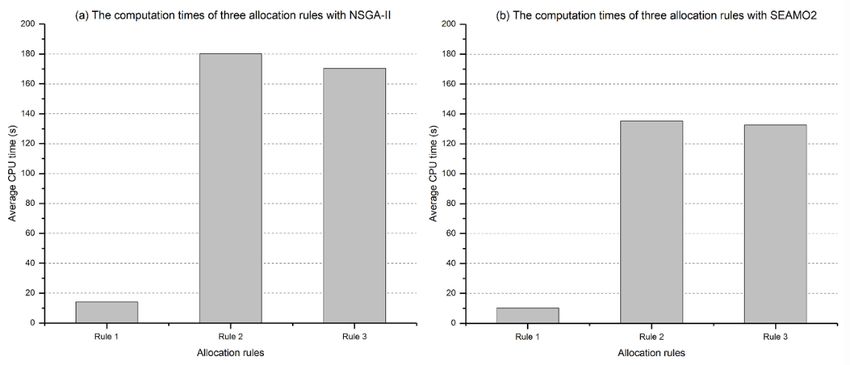
• The computation time required by Rule 1 is significantly less than that required by Rule 2 or 3.
The average runtimes with Rules 2 and 3 are very close, but over 10 times longer than those with
Rule 1, using either the NSGA-II or the SEAMO2, as depicted in Figure 4.Sustainability 2020, 12, 7634 9 of 12
Sustainability 2020, 12, x FOR PEER REVIEW 9 of 13
Table 3.2.5426 3.7781
The GDs between 2.8527 with three
Pareto-sets obtained 3.0784
allocation rules5.3594
using NSGA-II1.9935
and SEAMO2.
2.7536 3.2277 2.1960 5.3039 2.7757 3.3515
2.3208 4.8248 NSGA-II 3.7515 2.2645 2.4852
SEAMO2 3.8128
2.9647 2.9611
Rule 1 Rule 2 2.3843 Rule 3 3.9631 Rule 1 2.6313Rule 2 3.4921
Rule 3
2.8527 3.0784 3.4009 2.5355 2.7747 3.0278
Rule 1
2.6097 0 3.4989 143.6 3.1177 118.3 2.7557 0 3.5775151.1 215.4
2.3397
Rule 2 244.3 0 61.0 350.0 0 186.8
3.0057 2.8731 3.5775 2.3397 2.8505 2.9719
Rule 3 240.7 41.2 0 353.1 161.4 0
Avg. time (s) 10.3 135.3 132.5
Figure
Figure 3. The
3. The comparisonof
comparison ofPareto
Pareto fronts
fronts obtained
obtainedwith
withthree allocation
three rules.
allocation rules.where di denotes the Euclidean distance between the ith point on one Pareto front and its nearest
point on another Pareto front, and n is the number of points on the Pareto front.
• The computation time required by Rule 1 is significantly less than that required by Rule 2 or 3.
The average runtimes with Rules 2 and 3 are very close, but over 10 times longer than those with
Sustainability 2020, 12, 7634 10 of 12
Rule 1, using either the NSGA-II or the SEAMO2, as depicted in Figure 4.
Figure
Figure 4. The comparison
4. The comparison of
of computation
computation times
times required
required by
by three
three allocation
allocation rules.
rules.
As seen above, on the side of solution quality, Rule 1 can provide the same high-quality Pareto-sets
Table 3. The GDs between Pareto-sets obtained with three allocation rules using NSGA-II and
as Rules 2 and 3, which means that the customer allocation rules have nearly no influence on the
SEAMO2.
location solutions. The reason behind it is that two objectives are treated equally by the evolutionary
operators and the distances betweenNSGA-II
customers and facilities playSEAMO2
an implicit and important role in
Rule 1 Rule 2 Rule 3 Rule 1 Rule
optimizing two objectives. On the side of computation time, Rule 1 has 2 anRule 3
absolute advantage over
Rule time
Rules 2 and 3 in running 1 0
because 143.6 118.3
of its implementation 0 simplicity.
151.1 For215.4
all other tested instances,
the same conclusions Rule
can2be drawn.
244.3 These 0 imply 61.0 350.0
that Rule 1 can be0used as
186.8
an efficient approach to
Ruleof
perform the assignment 3 customers
240.7 in41.2 0 353.1
the multi-objective 161.4 location
sustainable 0 problem.
6. Conclusions
As seen above,and Perspectives
on the side of solution quality, Rule 1 can provide the same high-quality Pareto-
sets as
TheRules
MOO 2 and 3, which
has been means
widely usedthat thefield
in the customer allocation
of facility locationrules have
to cope nearly
with no influence
real-world on the
complexities.
location solutions. The reason behind it is that two objectives are treated equally by
However, very few studies have been conducted to investigate the impact of the assignment of customers the evolutionary
operators
on and the
the location distances
of facilities inbetween
the MOOcustomers
context. In andthisfacilities
paper, aplay
newan implicit
practical and importantlocation
multi-objective role in
optimizing
model two objectives.
considering economic On costs
the side
andofvehicle
computation
emissionstime,simultaneously
Rule 1 has an absolute advantage
is introduced, and over
two
Rules 2 and 3 in running time because of its implementation simplicity. For all other
multi-objective metaheuristics are used to solve the model. Further, three different allocation rules tested instances,
the samefrom
derived conclusions can be drawn.
the optimization These imply
of customer that Rule
allocation 1 can
based onbe used as cost,
distance, an efficient approachare
and emissions to
performto
applied the assignment
perform of customers
the customer in the multi-objective
assignment so as to evaluate sustainable location
their impacts. Theproblem.
results of extensive
computational experiments demonstrate the flexibility of customer allocations, the robustness of
6. Conclusions and Perspectives
location solutions, as well as the efficiency of Rule 1. That is to say, the allocation rule based on the
The will
distance MOO be ahas
top been widely
priority for theused in the field
assignment of facility
of customers location to cope
in multi-objective with real-world
sustainable location
complexities.
problem, However,
in view very few studies
of its implementation have been
simplicity, conducted
accuracy, to investigate
and computational the impact of the
performance.
assignment of customers
There are on the location
some limitations of facilities
to this study. On the inone
the MOO
hand, context. In thismodel
the proposed paper,isa new practical
too simple to
multi-objective
address locationcomplexities.
the real-world model considering economic
For example, costs
in the realand vehicle
world, emissions
business ownerssimultaneously
may focus more is
introduced,
on and two
equity, service level,multi-objective
as well as other metaheuristics
environmental are usedcustomer
risks, to solvedemands
the model.
mayFurther, three
be uncertain
rather than deterministic. On the other hand, our findings are achieved through three allocation rules
and two genetic algorithms. Extending the findings to other allocation rules and solution algorithms
may be a serious challenge. For future research, one prospective task would be to incorporate more
aforementioned factors into the model to extend its realistic application scope. Another prospective
task would be to make more evaluations for various allocation rules based on various algorithms
to investigate their impacts so as to simplify the location-allocation analysis in the multi-objective
location problems.
Author Contributions: Conceptualization, X.T.; Methodology, X.T.; Software, X.T.; Validation, J.W. and R.L.;
Writing—original draft, X.T.; Writing—review and editing, J.W. and R.L. All authors have read and agreed to the
published version of the manuscript.
Funding: This research was funded by the National Natural Science Foundation of China (Grant No. 51508161),
Natural Science Foundation of Jiangsu Province (Grant No. BK20181307), and Postdoctoral Science Foundation of
China (Grant No. 2018M630505).Sustainability 2020, 12, 7634 11 of 12
Acknowledgments: The authors would like to thank two anonymous reviewers for their valuable comments.
Conflicts of Interest: The authors declare no conflict of interest.
References
1. Daskin, M.S.; Snyder, L.V.; Berger, R.T. Facility location in supply chain design. In Logistics Systems: Design
and Optimization; Langevin, A., Riopel, D., Eds.; Springer Science and Business Media LLC: Boston, MA,
USA, 2005; pp. 39–65.
2. Eskandarpour, M.; Dejax, P.; Miemczyk, J.; Péton, O. Sustainable supply chain network design:
An optimization-oriented review. Omega 2015, 54, 11–32. [CrossRef]
3. Farahani, R.Z.; SteadieSeifi, M.; Asgari, N. Multiple criteria facility location problems: A survey.
Appl. Math. Model. 2010, 34, 1689–1709. [CrossRef]
4. Owen, S.H.; Daskin, M.S. Strategic facility location: A review. Eur. J. Oper. Res. 1998, 111, 423–447. [CrossRef]
5. Melo, M.T.; Nickel, S.; Saldanha-da-Gama, F. Facility location and supply chain management—A review.
Eur. J. Oper. Res. 2009, 196, 401–412. [CrossRef]
6. Arabani, A.B.; Farahani, R.Z. Facility location dynamics: An overview of classifications and applications.
Comput. Ind. Eng. 2012, 62, 408–420. [CrossRef]
7. Campbell, J.; O’Kelly, M. Twenty-five years of hub location research. Transp. Sci. 2012, 46, 153–169. [CrossRef]
8. Farahani, R.Z.; Hekmatfar, M.; Arabani, A.B.; Nikbakhsh, E. Hub location problems: A review of models,
classification, solution techniques, and applications. Comput. Ind. Eng. 2013, 64, 1096–1109. [CrossRef]
9. Ortiz-Astorquiza, C.; Contreras, I.; Laporte, G. Multi-level facility location problems. Eur. J. Oper. Res. 2018,
267, 791–805. [CrossRef]
10. Farahani, R.Z.; Hekmatfar, M. Facility Location: Concepts, Models, Algorithms and Case Studies; Physica-Verlag:
Berlin, Germany, 2009.
11. Daskin, M.S. Network and Discrete Location: Models, Algorithms, and Applications, 2nd ed.; Wiley: Hoboken, NJ,
USA, 2013.
12. Laporte, G.; Nickel, S.; Saldanha-Da-Gama, F. Introduction to Location Science; Springer: Cham, Switzerland,
2015.
13. Current, J.; Min, H.; Schilling, D. Multiobjective analysis of facility location decisions. Eur. J. Oper. Res. 1990,
49, 295–307. [CrossRef]
14. Yu, H.; Solvang, W.D. A fuzzy-stochastic multi-objective model for sustainable planning of a closed-loop
supply chain considering mixed uncertainty and network flexibility. J. Clean. Prod. 2020, 266, 121702.
[CrossRef]
15. Mogale, D.G.; Cheikhrouhou, N.; Tiwari, M.K. Modelling of sustainable food grain supply chain distribution
system: A bi-objective approach. Int. J. Prod. Res. 2019, 213, 1035–1050. [CrossRef]
16. Ghodratnama, A.; Tavakkoli-Moghaddam, R.; Azaron, A. Robust and fuzzy goal programming optimization
approaches for a novel multi-objective hub location-allocation problem: A supply chain overview.
Appl. Soft Comput. 2015, 37, 255–276. [CrossRef]
17. Chibeles-Martins, N.; Pinto-Varela, T.; Barbosa-Póvoa, A.P.; Novais, A.Q. A multi-objective meta-heuristic
approach for the design and planning of green supply chains—MBSA. Expert Syst. Appl. 2016, 47, 71–84.
[CrossRef]
18. Mota, B.; Gomes, M.I.; Carvalho, A.; Barbosa-Póvoa, A.P. Sustainable supply chains: An integrated modeling
approach under uncertainty. Omega 2018, 77, 32–57. [CrossRef]
19. Dukkanci, O.; Peker, M.; Kara, B.Y. Green hub location problem. Transp. Res. Part. E Logist. Transp. Rev. 2019,
125, 116–139. [CrossRef]
20. Baud-Lavigne, B.; Agard, B.; Penz, B. Environmental constraints in joint product and supply chain design
optimization. Comput. Ind. Eng. 2014, 76, 16–22. [CrossRef]
21. Canales-Bustos, L.; Santibañez-González, E.; Candia-Véjar, A. A multi-objective optimization model for the
design of an effective decarbonized supply chain in mining. Int. J. Prod. Econ. 2017, 193, 449–464. [CrossRef]
22. Das, S.K.; Roy, S.K. Effect of variable carbon emission in a multi-objective transportation-p-facility location
problem under neutrosophic environment. Comput. Ind. Eng. 2019, 132, 311–324. [CrossRef]
23. Deb, K.; Pratap, A.; Agarwal, S.; Meyarivan, T. A fast and elitist multiobjective genetic algorithm: NSGA-II.
IEEE T. Evolut. Comput. 2002, 6, 182–197. [CrossRef]Sustainability 2020, 12, 7634 12 of 12
24. Konak, A.; Coit, D.W.; Smith, A.E. Multi-objective optimization using genetic algorithms: A tutorial.
Reliab. Eng. Syst. Saf. 2006, 91, 992–1007. [CrossRef]
25. Jiang, G.; Wang, Q.; Wang, K.; Zhang, Q.; Zhou, J. A novel closed-loop supply chain network design
considering enterprise profit and service level. Sustainability 2020, 12, 544. [CrossRef]
26. Paul, N.R.; Lunday, B.J.; Nurre, S.G. A multiobjective, maximal conditional covering location problem
applied to the relocation of hierarchical emergency response facilities. Omega 2017, 66, 147–158. [CrossRef]
27. Davoodi, M. k-Balanced Center Location problem: A new multi-objective facility location problem. Comput.
Oper. Res. 2019, 105, 68–84. [CrossRef]
28. Altıparmak, F.; Gen, M.; Lin, L.; Paksoy, T. A genetic algorithm approach for multi-objective optimization of
supply chain networks. Comput. Ind. Eng. 2006, 51, 196–215. [CrossRef]
29. Chibeles-Martins, N.; Pinto-Varela, T.; Barbosa-Póvoa, A.P.; Novais, A.Q. A simulated annealing algorithm
for the design and planning of supply chains with economic and environmental objectives. Comput. Aided
Chem. Eng. 2012, 30, 21–25. [CrossRef]
30. Shen, J. An uncertain sustainable supply chain network. Appl. Math. Comput. 2020, 378, 125213. [CrossRef]
31. Ghezavati, V.; Hosseinifar, P. Application of efficient metaheuristics to solve a new bi-objective optimization
model for hub facility location problem considering value at risk criterion. Soft Comput. 2016, 22, 195–212.
[CrossRef]
32. Harris, I.; Mumford, C.L.; Naim, M.M. A hybrid multi-objective approach to capacitated facility location
with flexible store allocation for green logistics modeling. Transp. Res. Part. E Logist. Transp. Rev. 2014, 66,
1–22. [CrossRef]
33. Demir, E.; Bektaş, T.; Laporte, G. A review of recent research on green road freight transportation. Eur. J.
Oper. Res. 2014, 237, 775–793. [CrossRef]
34. Mumford, C.L. Simple population replacement strategies for a steady-state multi-objective evolutionary
algorithm. In Genetic and Evolutionary Computation—GECCO 2004; Deb, K., Poli, R., Banzhaf, W., Beyer, H.G.,
Burke, E., Darwen, P., Dasgupta, D., Florean, D., Foster, J.A., Harman, M., et al., Eds.; Springer: Boston, MA,
USA, 2004; pp. 1389–1400.
35. Delmaire, H.; Diaz, J.; Fernandez, E.; Ortega, M. Reactive grasp and tabu search based heuristics for the
single source capacitated plant location problem. INFOR: Inf. Syst. Oper. Res. 1999, 37, 194–225. [CrossRef]
36. Van Veldhuizen, D.A.; Lamont, G.B. Evolutionary computation, and convergence to a Pareto front. In Genetic
Programming 1998, Proceedings of the Third Annual Conference; Madison, WI, USA, 22–25 July 1998, Koza, J.R.,
Banzhaf, W., Chellapilla, K., Deb, K., Dorigo, M., Fogel, D.B., Garzon, M.H., Goldberg, D.E., Iba, H.,
Riolo, R.L., Eds.; Morgan Kaufman: Burlington, MA, USA, 1998; pp. 22–25.
© 2020 by the authors. Licensee MDPI, Basel, Switzerland. This article is an open access
article distributed under the terms and conditions of the Creative Commons Attribution
(CC BY) license (http://creativecommons.org/licenses/by/4.0/).You can also read


