Comparison of Multi-objective Evolutionary Algorithms to Solve the Modular Cell Design Problem for Novel Biocatalysis - bioRxiv
←
→
Page content transcription
If your browser does not render page correctly, please read the page content below
bioRxiv preprint first posted online Apr. 22, 2019; doi: http://dx.doi.org/10.1101/616078. The copyright holder for this preprint
(which was not peer-reviewed) is the author/funder, who has granted bioRxiv a license to display the preprint in perpetuity.
                              It is made available under a CC-BY-NC-ND 4.0 International license.

      Article
      Comparison of Multi-objective Evolutionary
      Algorithms to Solve the Modular Cell Design
      Problem for Novel Biocatalysis
      Sergio Garcia 1,2         and Cong Trinh 1,2, *
        1   Department of Chemical and Biomolecular Engineering, The University of Tennessee, Knoxville, TN, United
            States
        2   Center for Bioenergy Innovation, Oak Ridge National Laboratory Oak Ridge, TN, United States
        *   Correspondence: ctrinh@utk.edu; Tel.: +01-865-974-2181

        Abstract: A large space of chemicals with broad industrial and consumer applications could be
        synthesized by engineered microbial biocatalysts. However, the current strain optimization process is
        prohibitively laborious and costly to produce one target chemical and often requires new engineering
        efforts to produce new molecules. To tackle this challenge, modular cell design based on a chassis
        strain that can be combined with different product synthesis pathway modules has been recently
        proposed. This approach seeks to minimize unexpected failure and avoid task repetition, leading
        to a more robust and faster strain engineering process. The modular cell design problem was
        mathematically formulated using a multi-objective optimization framework.[1] In this study, we
        evaluated a library of the state-of-the-art multi-objective evolutionary algorithms (MOEAs) to identify
        the most effective method to solve the modular cell design problem. Using the best MOEA, we found
        better solutions for modular cells compatible with many product synthesis modules. Furthermore,
        the best performing algorithm could provide better and more diverse design options that might help
        increase the likelihood of successful experimental implementation. We identified key parameter
        configurations to overcome the difficulty associated with multi-objective optimization problems with
        many competing design objectives. Interestingly, we found that MOEA performance with a real
        application problem, e.g., the modular strain design problem, does not always correlate with artificial
        benchmarks. Overall, MOEAs provide powerful tools to solve the modular cell design problem for
        novel biocatalysis.

        Keywords: modularity; modular design; modular cell; metabolic engineering; metabolic network
        modeling; constraint-based modeling; multi-objective optimization; multi-objective evolutionary
        algorithms; MOEA.

      1. Introduction
            Multi-objective optimization is a powerful mathematical toolbox widely used in engineering
      disciplines to solve problems with multiple conflicting design objectives.[2] For example, in the field of
      chemical engineering, multi-objective optimization has been applied to balance design conflicts in the
      performance, material and energy requirements, and environmental sustainability of many different
      chemical processes.[3] In industrial biotechnology, with recent advancements in synthetic biology
      and metabolic engineering, microorganisms can be genetically modified to produce a large space
      of molecules with broad applications using renewable lignocellulosic biomass or waste products as
      feedstocks.[4,5] Due to the current strain design process that is prohibitively laborious and expensive
      [6], the application of modular design principles commonly used in engineering [7] to microbial
      biocatalysis has been recently proposed to overcome this challenge.[1,8–10] This modular cell design
      approach, known as ModCell, uses multi-objective optimization to account for the competing cellular
      objectives when cellular metabolism is (re)designed in a modular fashion to produce a diverse class of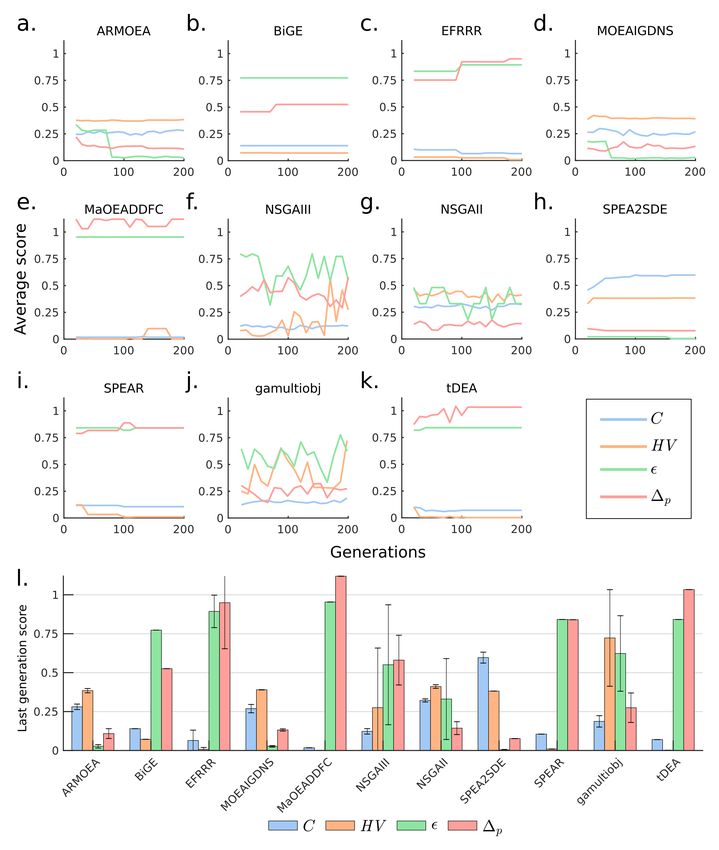
bioRxiv preprint first posted online Apr. 22, 2019; doi: http://dx.doi.org/10.1101/616078. The copyright holder for this preprint
(which was not peer-reviewed) is the author/funder, who has granted bioRxiv a license to display the preprint in perpetuity.
                              It is made available under a CC-BY-NC-ND 4.0 International license.

                                                                                                                                    2 of 13

      target chemicals. ModCell has been experimentally demonstrated for biosynthesis of alcohols [8,11,12]
      and esters [13–17] in Escherichia coli.
            Despite the broad applicability of multi-objective optimization in engineering design, powerful
      solution algorithms remain elusive. Multi-objective evolutionary algorithms (MOEAs) are widely
      used techniques due to their flexibility and computational scalability.[18] MOEAs are based on a
      more general type of optimization method known as evolutionary algorithms, where candidate
      solutions, that represent individuals of a population, are iteratively modified using heuristic rules
      to increase their fitness. Recently, much attention has been placed in the development of MOEAs to
      solve many-objective problems (e.g., problems with 4 or more objectives) that often correspond to
      real-world applications, but can be very challenging to solve with conventional MOEAs.[19] For the
      case of ModCell problem, the popular MOEA NSGA-II[20,21] was used to design a modular cell under
      20 different production modules,[1]. Due to the large chemical space of molecules that can potentially
      be synthesized by modular cells, scalability issues are expected to occur when constructing modular
      cells that are designed to be compatible with tenths or hundreds of products. Furthermore, using the
      best solver algorithm(s) allows to explore a more diverse design space, resulting in better choices for
      experimental implementation.
            Many MOEAs have been proposed over the past two decades since the inception of landmark
      algorithms such as NSGAII [22] and SPEA2.[23] New MOEAs are benchmarked against libraries of
      artificial problems with known solutions, [24,25] and are expected to show enhanced performance
      for a subset of these problems in terms of scalability, identification of Pareto optimal solutions, and
      number of simulation generations needed to converge. This benchmarking methodology does not
      always reflect MOEA performance for general problems, since specialized parameter configurations or
      heuristics are often used and can lead to drastically different performance towards a specific problem
      of interest. Thus, the best MOEA for a certain application problem needs to be determined empirically.
      In this study, we evaluated a library of state-of-the-art MOEAs to solve the multi-objective ModCell
      problem, with special consideration for many-objective methods. Several cases study of increasing
      difficulty were examined using common performance indicators of solution optimality and diversity,
      and critical algorithm parameters that determine solution quality are also investigated.

      2. Methods

      2.1. Multi-objective modular cell design
           Modular cell design enables rapid assembly of strains with desirable phenotypes from a modular
      (chassis) cell,[1] resembling the efficiency advantages of modular design in conventional engineering
      disciplines.[7,10] A modular cell is constructed by eliminating genes from a parent strain to maintain
      only core metabolic pathways shared across all pathway modules. Each module enables an optimized
      target product synthesis phenotype that leads to high yields, titers, and production rates. The different
      biochemical nature of each target metabolite can make the objectives compete with each other, turning
      the modular cell design problem into a multi-objective optimization problem known as ModCell2:[1]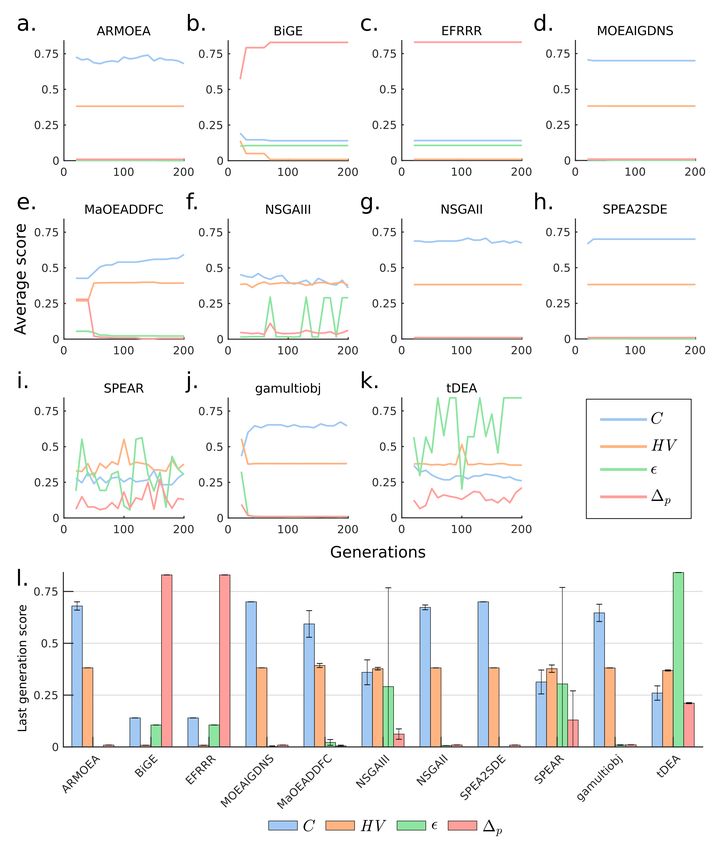
bioRxiv preprint first posted online Apr. 22, 2019; doi: http://dx.doi.org/10.1101/616078. The copyright holder for this preprint
(which was not peer-reviewed) is the author/funder, who has granted bioRxiv a license to display the preprint in perpetuity.
                              It is made available under a CC-BY-NC-ND 4.0 International license.

                                                                                                                                    3 of 13

                                   max       ( f 1 , f 2 , . . . , f |K| )T s.t.                                                       (1)
                                    y j ,z jk
                                                               (
                                                                      1
                                        f k ∈ arg max                      ∑ c jk v jk
                                                                   f kmax j∈J
                                                                                         s.t.                                          (2)
                                                                               k

                                                 ∑     Sijk v jk = 0                        for all i ∈ Ik                             (3)
                                                j∈Jk

                                                l jk ≤ v jk ≤ u jk                          for all j ∈ Jk                             (4)
                                                l jk d jk ≤ v jk ≤ u jk d jk                for all j ∈ C                              (5)
                                                                                   )
                                                where d jk = y j ∨ z jk                     for all k ∈ K

                                        z jk ≤ (1 − y j )                                   for all j ∈ C , k ∈ K                      (6)
                                         ∑ z jk ≤ βk                                        for all k ∈ K                              (7)
                                         j∈C

                                         ∑ (1 − y j ) ≤ α                                                                              (8)
                                         j∈C

      where Ik , Jk , and K are the sets of metabolites, reactions, and associated production metabolic
      networks (i.e., the combination of the chassis organism with a specific product synthesis pathway),
      respectively. The desirable phenotype f k for production module k (1) is determined based on key
      metabolic fluxes v jk (mmol/gDCW/h) predicted by the constraint-based metabolic model [26] (2-5).
      For example, a common design objective is weak growth coupled to product formation (wGCP), that
      requires a high product synthesis rate at the maximum growth-rate, enabling growth selection of
      optimal production strains. Thus, in wGCP design, the inner optimization problem seeks to maximize
      growth rate through the linear objective function c jk (2) subject to: (i) mass-balance constraints (3),
      where Sijk represents the stoichiometric coefficient of metabolite i in reaction j of production network
      k, (ii) flux bound constraints (4) that determine reaction reversibility and available substrates, where l jk
      and u jk are lower and upper bounds respectively, and (iii) genetic manipulation constraints (5), i.e.,
      deletion of a reaction j in the chassis through the binary indicator y j , or insertion of a reaction j in
      a specific production network k through the binary indicator z jk . The maximum product synthesis
      rate of each production network k, f kmax , is determined by maximizing the product synthesis reaction
      subject to (3-4), allowing to bound f k in wGCP between 0 and 1. Only a subset of all metabolic reactions,
      C , are considered as candidates for deletion, since many of the reactions in the metabolic model cannot
      be manipulated to enhance the target phenotype. Certain reactions can be deleted in the chassis but
      inserted back under specific production modules, enabling the chassis to be compatible with a broader
      number of modules (6). The number of module-reactions additions and reaction deletions in the chassis
      is constrained by parameters β k (7) and α (8), respectively, to avoid unnecessary genetic manipulations
      that are generally time-consuming to implement and can lead to unforeseen phenotypes.

      2.2. Optimal solutions for a multi-objective optimization problem
           Optimal solutions for a multi-objective optimization problem (1-8) are defined based on the
      concept of domination: A vector a = ( a1 , . . . , aK ) T dominates another vector b = (b1 , . . . , bK ) T , denoted
      as a ≺ b if and only if ai ≥ bi ∀i ∈ {1, 2, . . . , K } and ai 6= bi for at least one i. Letting x be the design
      variables (i.e., y j and z jk ) and X be the feasible set determined by the problem constraints (2-8), a
      feasible solution x ∗ ∈ X of the multi-objective optimization problem is called a Pareto optimal solution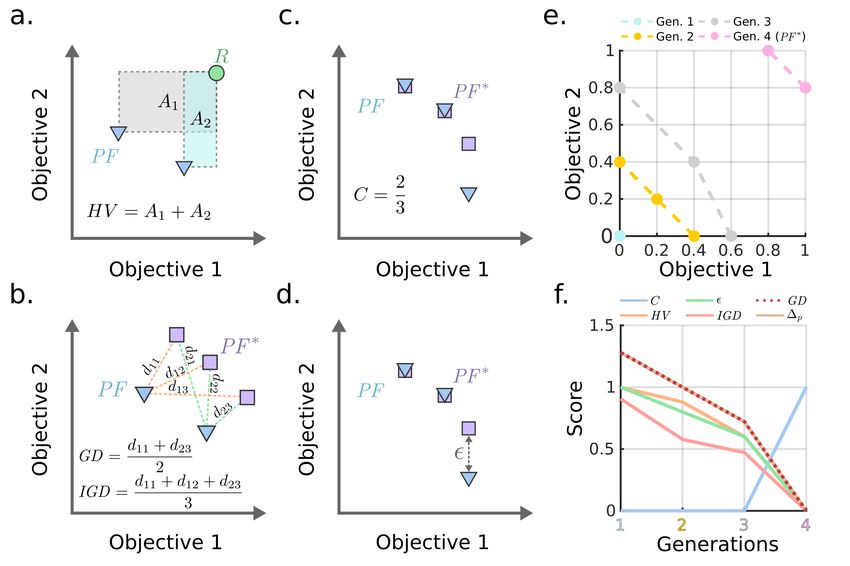
bioRxiv preprint first posted online Apr. 22, 2019; doi: http://dx.doi.org/10.1101/616078. The copyright holder for this preprint
(which was not peer-reviewed) is the author/funder, who has granted bioRxiv a license to display the preprint in perpetuity.
                              It is made available under a CC-BY-NC-ND 4.0 International license.

                                                                                                                                    4 of 13

      if and only if there does not exists a vector x 0 ∈ X such that F ( x 0 ) ≺ F ( x ∗ ). The set of all Pareto optimal
      solutions is called Pareto set:

                                              PS := { x ∈ X : @ x 0 ∈ X, F ( x 0 ) ≺ F ( x )}                                          (9)

      The projection of the Pareto set in the objective space is denoted as Pareto front:

                                                         PF := { F ( x ) : x ∈ PS}                                                    (10)

      2.3. MOEA selection
           To find the best MOEAs for ModCell2, we evaluated a recent and comprehensive set of MOEAs
      implemented in the PlatEMO platform.[27] From over 50 algorithms available in PlatEMO, we selected
      2 methods for benchmark study, NSGAII/gamultiobj and MOEAIGDNS, and 8 methods that have
      been specifically developed to tackle many-objective problems with discrete variables like ModCell2,
      including ARMOEA, EFRRR, MaOEADDFC, SPEAR, tDEA, BiGE, NSGAIII, and SPEA2SDE (Table 1).
      It should be noted that gamultiobj is an alternative implementation of the NSGAII algorithm available
      in Matlab.

                                           Table 1. Summary of MOEAs used in this study

         Abbreviation        Name                                                     Notes                                Reference
            NSGAII           Non-dominated sorting genetic algorithm 2                Highly applied MOEA                      [22]
                                                                                      Used in the original
          gamultiobj         Matlab implementation of NSGAII                                                                   [20]
                                                                                      ModCell2 study[1]
                             Multi-objective evolutionary algorihtm based             General MOEA with an
        MOEAIGDNS            on an enhanced inverted generational distance            implementation that works                [28]
                             metric                                                   well with discrete variables
                             Adapation to reference points multi-objective            Many-objective EA based on
           ARMOEA                                                                                                              [29]
                             evolutionary algorithm                                   MOEAIGDNS
                             Ensemble fitness ranking with ranking
            EFRRR                                                                     Many-objective EA                        [30]
                             restriction
                             Many-objective      evolutionary    algorithm
        MaOEADDFC            based on directional diversity and favorable             Many-objective EA                        [31]
                             convergence
                             Strength Pareto evolutionary algorithm based
            SPEAR                                                                     Many-objective EA                        [32]
                             on reference direction
            tDEA             θ-dominance evolutionary algorithm                       Many-objective EA                        [33]
            BiGE             Bi-goal evolution                                        Many-objective EA                        [34]
           NSGAIII           Non-dominated sorting genetic algorithm 3                Many-objective EA                        [35]
                             Strength Pareto evolutionary algorithm 2 with
          SPEA2SDE                                                                    Many-objective EA                        [36]
                             shift-based density estimation

      2.4. Performance metrics
            To evaluate the performance of different MOEAs for a given problem, each algorithm is ran for
      the same number of generations, and the resulting solutions, known as Pareto front approximations,
      are compared using functions that measure two qualities: (i) solution accuracy, i.e., to determine how
      similar the solution is to the true Pareto front and (ii) solution diversity, i.e., to evaluate how well
      distributed are the points in the solution. We selected the top 5 most used metrics according to a recent
      literature survey.[37] These include, in order of popularity, hypervolume (HV), generational distance
      (GD), epsilon indicator (e), inverted generational distance (IGD), and coverage (C). Based on a recent
      study,[38] we considered the average Hausdorff distance (∆ p ), that combines GD and IGD, and hence
      simplified the number of performance metrics to 4 in our study. These metrics are defined as follows:
            HV: This metric measures the volume occupied by the union of the smallest hyperboxes formed by
      each point in the Pareto front approximation and the reference point. This Pareto front approximation
bioRxiv preprint first posted online Apr. 22, 2019; doi: http://dx.doi.org/10.1101/616078. The copyright holder for this preprint
(which was not peer-reviewed) is the author/funder, who has granted bioRxiv a license to display the preprint in perpetuity.
It is made available under a CC-BY-NC-ND 4.0 International license.
5 of 13
corresponds to the solution of a specific MOEA (denoted as PF) and the reference point is selected to be
greater or equal to the maximum value attainable by any objective, which in our case is ~1 (Figure 1a):
Volume(Box(PFi ,~1))
[
HV = (11)
i∈ I
where I is the index set of PF points.
GD: This metric measures the distance between the solution PF and the best Pareto front
approximation determined by combining non-dominated points from all MOEA solutions of a specific
case study, denoted PF∗ . More specifically, GD corresponds to the average Euclidean distance between
!1
2
each point in PF and the nearest point in PF∗ , denoted as di = min ∑ (PFij − PF∗kj )2 , where I
k∈K j∈ J
(i ∈ I), K (k ∈ K), and J (j ∈ J) correspond to the index sets of PF points, PF∗ points, and problem
objectives, respectively (Figure 1b):
∑ di
i∈ I
GD = (12)
|I|
IGD: This metric measures the distance between PF and PF∗ . It is determined by the
average Euclidean distance between each point in PF∗ and the nearest point in PF denoted dˆk =
!1
2
min ∑ (PF∗kj − PFij )2 (Figure 1b):
i∈ I j∈ J
∑ dˆk
k∈K
IGD = (13)
|K |
∆ p : This metric combines GD and IGD metric and thus has superior properties:[38]
∆ p = max(GD, IGD) (14)
C: This metric determines the fraction of PF∗ captured by the solution PF (Figure 1c):
|PF ∩ PF∗ | |{k ∈ K : ∃i ∈ I such that PF∗kj = PFij for all j ∈ J }|
C= = (15)
|PF∗ | |K |
e: This metric is the additive epsilon indicator[39] that measures the smallest value to be added to
any point in PF to make it non-dominated with respect to some point in PF∗ . In other words, it is the
smallest value e such that for any solution in PF∗ there is at least one solution in PF that is not worse
by a difference of e (Figure 1d):
e = inf{e ∈ R : for all i ∈ I ∃k ∈ K such that PFij + e ≥ PF∗kj for all j ∈ J } (16)
Use of these metrics can be illustrated with a two-objective design example with 4 generations of
improving Pareto front approximations, where the final Pareto front is used as a reference (i.e., PF∗ )
(Figure 1e). As the Pareto fronts contain points that dominate the previous generations, all metrics
decrease monotonically with the exception of C that increases to a value of 1 when both Pareto front
approximation and reference are the same (Figure 1f).bioRxiv preprint first posted online Apr. 22, 2019; doi: http://dx.doi.org/10.1101/616078. The copyright holder for this preprint
(which was not peer-reviewed) is the author/funder, who has granted bioRxiv a license to display the preprint in perpetuity.
It is made available under a CC-BY-NC-ND 4.0 International license.
6 of 13
Figure 1. (a-d) Conceptual illustration of performance metrics of MOEAs for two-objective design
problem. PF and PF ∗ correspond to the Pareto front approximation and the best Pareto front available,
respectively. The reference point R must always dominate all solutions in PF. (e-f) An example of
Pareto fronts with 2 dimensions and associated metrics. The 4th generation corresponds to PF∗ used as
a reference for comparison.
2.5. Algorithm parameters
All parameters used in the simulations of this study were left as default except the following ones.
The total number of generations was set to be 200, which is sufficient to reach high quality solutions for
the problems of this study. In addition, the population size was set to be 100 for all algorithms unless
noted otherwise. All problems were solved in triplicates with unique random number generator seeds.
2.6. Metabolic models
For all simulations, we used a core E. coli model, downloaded from the BiGG database[40] (https:
//bigg.ucsd.edu), that captures the most important metabolic pathways.[26] The product synthesis
pathways for each module correspond to native E. coli pathways togheter with well-characterized
heterologus pathways for the synthesis of propanol,[41] butanol,[42] isobutanol,[43] and pentanol.[41]
The metabolic reactions associated with these pathways are described in the software implementation
(Supplementary Material 1).
2.7. Implementation
The simulations were performed using the ModCell2 software framework.[1] The MOEAs are
implemented in the PlatEMO Matlab library,[27] except gamultiobj which is implemented as part of
the Matlab Optimization Toolbox. HV was calculated using the hv package.[44] All computations were
executed in a computer with the Arch Linux operative system, Intel Core i7-3770 processor, and 32 GB
of random-access memory. The Matlab 2018b code used to generate the results of this manuscript is
available in Supplementary Material 1 and https://github.com/trinhlab/compare-moea.bioRxiv preprint first posted online Apr. 22, 2019; doi: http://dx.doi.org/10.1101/616078. The copyright holder for this preprint
(which was not peer-reviewed) is the author/funder, who has granted bioRxiv a license to display the preprint in perpetuity.
It is made available under a CC-BY-NC-ND 4.0 International license.
7 of 13
3. Results and Discussion
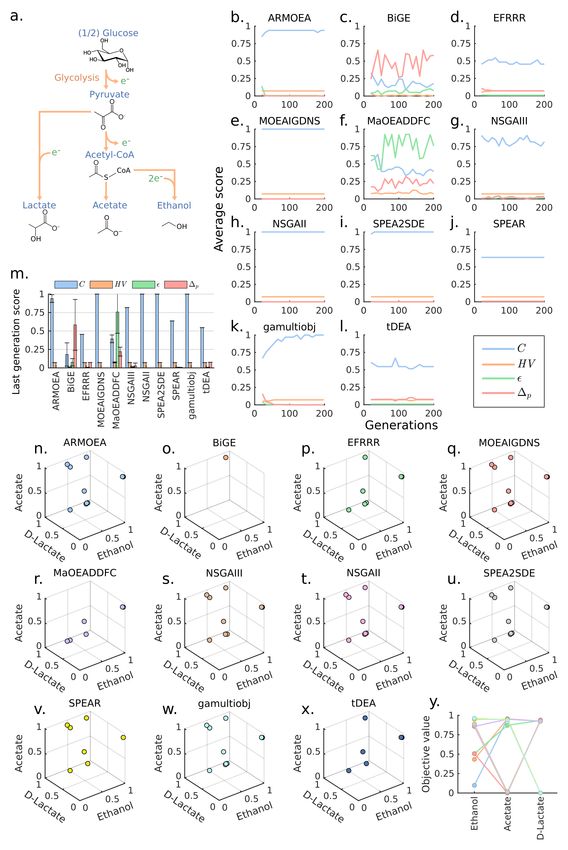
3.1. Case 1: A 3-objectives design problem
We first formulated a design problem that considers an E. coli core model and 3 production
modules based on the endogenous acetate, D-lactate, and ethanol biosynthesis pathways (Figure 2a).
We used all MOEAs to solve for the problem by setting the wGCP design objective, a maximum number
of reaction deletions α = 3, and no module reactions β = 0. These design parameters were sufficiently
restrictive to generate conflicting objectives. A total coverage of PF∗ (C = 1) was reached within 20
generations by several algorithms (Figure 2b, e, h, i) and by gamultiobj after 150 generations (Figure 2k),
while the remaining algorithms could not attain C values above 0.8 (Figure 2c, d, f, g, j, l). In particular,
MaOEADDFC and BiGE obtained the worst C, e, and ∆ p values (Figure 2m). Although C, e, and ∆ p
values of BiGE indicated inferior performance, this algorithm had the lowest HV since it generated
only one point with a high objective value (Figure 2o). Due to the simplicity of the problem, every
algorithm except MaOEADDFC, tDEA, and BiGE converged to very similar Pareto fronts (Figure 2n-x),
and 5 of them reached C = 1, indicating convergence to the reference Pareto front (Figure 2y).
3.2. Case 2: A 10-objectives design problem
Using the same model and design parameters as in Case 1, we expanded the number of
objectives to represent a more realistic scenario. These objectives correspond to 6 endogenous
pathways for biosynthesis of D-lactate, acetate, ethanol, formate, pyruvate and L-glutamate and 4
heterologous pathways for biosynthesis of propanol, butanol, isobutanol, and pentanol. The additional
objectives increased the difficulty of the problem, leading to more notable difference among algorithm
performances (Figure 3a-k). The SPEA2SDE algorithm displayed consistent improvement of C as
generations progressed, and quickly reached the smallest values of e and ∆ p (Figure 3h). Other
algorithms, including ARMOEA and MOEAIGDNS, also improved their e with the increasing number
of generations and reached the same final values of e and ∆ p as SPEA2SDE (Figure 3a, d). However,
SPEA2SDE approached C ∼ = 0.6, which is twice the value reached by the next best-performing methods
(Figure 3l). Remarkably, SPEA2SDE outperformed every other algorithm in all metrics, except HV.
The HV metric continues to show bias towards algorithms that generated a small number of points
and scored poorly in other metrics.
3.3. Case 3: Use of large population size overcomes poor MOEA performance
Increasing the number of objectives often leads to a combinatorial explosion of the number of
feasible Pareto optimal points and consequently causes poor MOEA performance. This problem can
be alleviated by using a larger population size to sample a broader volume of solution space.[45] To
test this strategy for the 10-objectives design problem above, we increased the population size from
100 to 1000 individuals. The result showed that ARMOEA, MOEAIGDNS, NSGAII, SPEA2SDE (the
best performer in Case 2), and gamultiobj, could reach C of 0.7, e of 0, and ∆ p of 0 in fewer than 50
generations (Figure 4a, d, g, h, j). These 5 algorithms also yielded very similar final values across all
metrics (Figure 4l). The remaining algorithms converged to considerably lower C values (Figure 4b, c,
e, f, i, k). Remarkably, NSGAII/gamultiobj, that is not considered a many-objective solver, performed
better than more recent many-objective algorithms such as NSGAIII.
One limitation of using larger populations is an increased cost in computational time. We observed
that a 10-fold increase in population sizes resulted in a 10-fold increase in the run times (Figure 5).
Nonetheless, all metrics reached a stable value in the top performing algorithms after 50 generations
(out of 200 total), suggesting that fewer generations were needed by using a larger population size.
Among the best performing algorithms with large population sizes, gamultiobj, implemented in the
Matlab Optimization Toolbox, required the shortest run time, followed by NSGAII and SPEA2SDE
implemented in PlatEMO.bioRxiv preprint first posted online Apr. 22, 2019; doi: http://dx.doi.org/10.1101/616078. The copyright holder for this preprint
(which was not peer-reviewed) is the author/funder, who has granted bioRxiv a license to display the preprint in perpetuity.
It is made available under a CC-BY-NC-ND 4.0 International license.
8 of 13
Figure 2. (Caption next page.)bioRxiv preprint first posted online Apr. 22, 2019; doi: http://dx.doi.org/10.1101/616078. The copyright holder for this preprint
(which was not peer-reviewed) is the author/funder, who has granted bioRxiv a license to display the preprint in perpetuity.
It is made available under a CC-BY-NC-ND 4.0 International license.
9 of 13
Figure 2. (Previous page.) Comparison of MOEAs for a 3-objectives design problem. (a) The
simplified metabolic pathways for conversion of glucose to the target products. Reducing equivalents
are presented with e− . (b-l) Generation-dependent performance metrics for various MOEAs. (m)
Performance metrics for various MOEAs at the last generation. (n-x) Pareto fronts of various MOEAs
at the last generation. It should be noted that only the first replicate is plotted for clear illustration. (y)
Reference Pareto front (PF∗ ). Each line represents a solution.
Figure 3. Comparison of MOEAs for a 10-objective design problem. (a-k) Generation-dependent
performance metrics for various MOAEs. (l) Performance metrics for various MOEAs at the last
generation.bioRxiv preprint first posted online Apr. 22, 2019; doi: http://dx.doi.org/10.1101/616078. The copyright holder for this preprint
(which was not peer-reviewed) is the author/funder, who has granted bioRxiv a license to display the preprint in perpetuity.
It is made available under a CC-BY-NC-ND 4.0 International license.
10 of 13
Figure 4. Comparison of MOEAs for a 10-objective design problem with larger population sizes (a-k)
Generation-dependent performance metrics for various MOAEs. (l) Performance metrics for various
MOEAs at the last generation.bioRxiv preprint first posted online Apr. 22, 2019; doi: http://dx.doi.org/10.1101/616078. The copyright holder for this preprint
(which was not peer-reviewed) is the author/funder, who has granted bioRxiv a license to display the preprint in perpetuity.
It is made available under a CC-BY-NC-ND 4.0 International license.
11 of 13
Figure 5. Wall-clock run times for the 10-objective design problem with population sizes of 100 (Case
2) and 1000 (Case 3).
4. Conclusions
In this study, we evaluated the performance of several MOEAs to solve the modular cell design
problem. SPEA2SDE, the recently developed many-objective method, was the best performing MOEA
under limited population sizes in our study. However, for sufficiently large populations, several
algorithms attained the best results, including the well-established NSGAII, which performed better
under large populations than more recently developed many-objective MOEAs. We used the most
popular performance metrics to compare MOEAs and found that the coverage (C) metric is the most
valuable indicator. This metric can provide an intuitive quantitative meaning and tends to increase
monotonically with the number of generations simulated. In contrast, hypervolume (HV) generally
did not differentiate algorithm performance and was misleading in some scenarios where an algorithm
generated very few solutions. Overall, these results highlight the need for empirical testing of MOEAs
towards specific problems and of the population size as a more important factor in performance than
the unique heuristics used by different algorithms.
Author Contributions: CTT initiated and supervised the study. SG and CTT designed experiments. SG performed
simulation experiments and analyzed data. SG and CTT wrote and approved the manuscript.
Funding: This research was funded by the NSF CAREER Award (NSF#1553250) and the Center of Bioenergy
Innovation (CBI), U.S. Department of Energy Bioenergy Research Center supported by the Office of Biological
and Environmental Research in the DOE Office of Science. The views, opinions, and/or findings contained in this
article are those of the authors and should not be interpreted as representing the official views or policies, either
expressed or implied, of the funding agencies.
Conflicts of Interest: The authors declare no conflict of interest.
1. Garcia, S.; Trinh, C. Multiobjective strain design: A framework for modular cell engineering. Metabolic
Engineering 2019, 51. doi:10.1016/j.ymben.2018.09.003.
2. Coello, C.A.C.; Lamont, G.B. Applications of multi-objective evolutionary algorithms; Vol. 1, World Scientific,
2004.
3. Rangaiah, G.P. Multi-objective optimization: techniques and applications in chemical engineering; Vol. 1, World
Scientific, 2009.
4. Trinh, C.T.; Mendoza, B. Modular cell design for rapid, efficient strain engineering toward industrialization
of biology. Current Opinion in Chemical Engineering 2016, 14, 18–25.
5. Lee, S.Y.; Kim, H.U.; Chae, T.U.; Cho, J.S.; Kim, J.W.; Shin, J.H.; Kim, D.I.; Ko, Y.S.; Jang, W.D.; Jang, Y.S. A
comprehensive metabolic map for production of bio-based chemicals. Nature Catalysis 2019, 2, 18.
6. Nielsen, J.; Keasling, J. Engineering Cellular Metabolism. Cell 2016, 164, 1185–1197.
doi:10.1016/j.cell.2016.02.004.
7. Bonvoisin, J.; Halstenberg, F.; Buchert, T.; Stark, R. A systematic literature review on modular product
design. Journal of Engineering Design 2016, 27, 488–514. doi:10.1080/09544828.2016.1166482.bioRxiv preprint first posted online Apr. 22, 2019; doi: http://dx.doi.org/10.1101/616078. The copyright holder for this preprint
(which was not peer-reviewed) is the author/funder, who has granted bioRxiv a license to display the preprint in perpetuity.
It is made available under a CC-BY-NC-ND 4.0 International license.
12 of 13
8. Trinh, C.T. Elucidating and reprogramming Escherichia coli metabolisms for obligate anaerobic n-butanol
and isobutanol production. Applied microbiology and biotechnology 2012, 95, 1083–1094.
9. Trinh, C.T.; Liu, Y.; Conner, D.J. Rational design of efficient modular cells. Metabolic engineering 2015,
32, 220–231.
10. Garcia, S.; Trinh, C. Modular design: Applying proven engineering principles to biotechnology. Under
review 2019.
11. Trinh, C.T.; Li, J.; Blanch, H.W.; Clark, D.S. Redesigning Escherichia coli metabolism for anaerobic
production of isobutanol. Appl. Environ. Microbiol. 2011, 77, 4894–4904.
12. Wilbanks, B.; Layton, D.; Garcia, S.; Trinh, C. A Prototype for Modular Cell Engineering. ACS Synthetic
Biology 2017, p. acssynbio.7b00269. doi:10.1021/acssynbio.7b00269.
13. Layton, D.S.; Trinh, C.T. Engineering modular ester fermentative pathways in Escherichia coli. Metabolic
Engineering 2014, 26, 77–88. doi:10.1016/j.ymben.2014.09.006.
14. Layton, D.S.; Trinh, C.T. Expanding the modular ester fermentative pathways for combinatorial
biosynthesis of esters from volatile organic acids. Biotechnology and bioengineering 2016.
15. Layton, D.S.; Trinh, C.T. Microbial synthesis of a branched-chain ester platform from organic waste
carboxylates. Metabolic Engineering Communications 2016, 3, 245–251.
16. Wierzbicki, M.; Niraula, N.; Yarrabothula, A.; Layton, D.S.; Trinh, C.T. Engineering an Escherichia coli
platform to synthesize designer biodiesels. Journal of biotechnology 2016, 224, 27–34.
17. Lee, J.; Trinh, C.T. De novo Microbial Biosynthesis of a Lactate Ester Platform. bioRxiv 2018, p. 498576.
18. Marler, R.T.; Arora, J.S. Survey of multi-objective optimization methods for engineering. Structural and
multidisciplinary optimization 2004, 26, 369–395.
19. Li, B.; Li, J.; Tang, K.; Yao, X. Many-objective evolutionary algorithms: A survey. ACM Computing Surveys
(CSUR) 2015, 48, 13.
20. Matlab documentation gamultiobj Algorithm. https://www.mathworks.com/help/gads/gamultiobj-
algorithm.html. Accessed: 2019-02-04.
21. Kalyanmoy, D. Multi objective optimization using evolutionary algorithms; John Wiley and Sons, 2001.
Chichester, England.
22. Deb, K.; Pratap, A.; Agarwal, S.; Meyarivan, T. A fast and elitist multiobjective genetic algorithm: NSGA-II.
IEEE transactions on evolutionary computation 2002, 6, 182–197.
23. Zitzler, E.; Laumanns, M.; Thiele, L. SPEA2: Improving the strength Pareto evolutionary algorithm.
TIK-report 2001, 103.
24. Zitzler, E.; Deb, K.; Thiele, L. Comparison of multiobjective evolutionary algorithms: Empirical results.
Evolutionary computation 2000, 8, 173–195.
25. Deb, K.; Thiele, L.; Laumanns, M.; Zitzler, E. Scalable multi-objective optimization test problems.
Proceedings of the 2002 Congress on Evolutionary Computation. IEEE, 2002, Vol. 1, pp. 825–830.
26. Palsson, B.Ø. Systems biology: constraint-based reconstruction and analysis; Cambridge University Press, 2015.
27. Tian, Y.; Cheng, R.; Zhang, X.; Jin, Y. PlatEMO: A MATLAB platform for evolutionary multi-objective
optimization. IEEE Computational Intelligence Magazine 2017, 12, 73–87.
28. Tian, Y.; Zhang, X.; Cheng, R.; Jin, Y. A multi-objective evolutionary algorithm based on an enhanced
inverted generational distance metric. IEEE Congress on Evolutionary Computation (CEC). IEEE, 2016, pp.
5222–5229.
29. Tian, Y.; Cheng, R.; Zhang, X.; Cheng, F.; Jin, Y. An indicator-based multiobjective evolutionary algorithm
with reference point adaptation for better versatility. IEEE Transactions on Evolutionary Computation 2018,
22, 609–622.
30. Yuan, Y.; Xu, H.; Wang, B.; Zhang, B.; Yao, X. Balancing convergence and diversity in decomposition-based
many-objective optimizers. IEEE Transactions on Evolutionary Computation 2016, 20, 180–198.
31. Cheng, J.; Yen, G.G.; Zhang, G. A many-objective evolutionary algorithm with enhanced mating and
environmental selections. IEEE Transactions on Evolutionary Computation 2015, 19, 592–605.
32. Jiang, S.; Yang, S. A strength Pareto evolutionary algorithm based on reference direction for multiobjective
and many-objective optimization. IEEE Transactions on Evolutionary Computation 2017, 21, 329–346.
33. Yuan, Y.; Xu, H.; Wang, B.; Yao, X. A new dominance relation-based evolutionary algorithm for
many-objective optimization. IEEE Transactions on Evolutionary Computation 2016, 20, 16–37.bioRxiv preprint first posted online Apr. 22, 2019; doi: http://dx.doi.org/10.1101/616078. The copyright holder for this preprint
(which was not peer-reviewed) is the author/funder, who has granted bioRxiv a license to display the preprint in perpetuity.
It is made available under a CC-BY-NC-ND 4.0 International license.
13 of 13
34. Li, M.; Yang, S.; Liu, X. Bi-goal evolution for many-objective optimization problems. Artificial Intelligence
2015, 228, 45–65.
35. Deb, K.; Jain, H. An evolutionary many-objective optimization algorithm using reference-point-based
nondominated sorting approach, part I: Solving problems with box constraints. IEEE Transactions on
Evolutionary Computation 2014, 18, 577–601.
36. Li, M.; Yang, S.; Liu, X. Shift-based density estimation for Pareto-based algorithms in many-objective
optimization. IEEE Transactions on Evolutionary Computation 2014, 18, 348–365.
37. Riquelme, N.; Von Lücken, C.; Baran, B. Performance metrics in multi-objective optimization. Latin
American Computing Conference (CLEI). IEEE, 2015, pp. 1–11.
38. Schutze, O.; Esquivel, X.; Lara, A.; Coello, C.A.C. Using the averaged Hausdorff distance as a performance
measure in evolutionary multiobjective optimization. IEEE Transactions on Evolutionary Computation 2012,
16, 504–522.
39. Zitzler, E.; Thiele, L.; Laumanns, M.; Fonseca, C.M.; Da Fonseca Grunert, V. Performance assessment of
multiobjective optimizers: An analysis and review. TIK-Report 2002, 139.
40. King, Z.A.; Lu, J.; Dräger, A.; Miller, P.; Federowicz, S.; Lerman, J.A.; Ebrahim, A.; Palsson, B.O.; Lewis,
N.E. BiGG Models: A platform for integrating, standardizing and sharing genome-scale models. Nucleic
acids research 2015, 44, D515–D522.
41. Tseng, H.C.; Prather, K.L. Controlled biosynthesis of odd-chain fuels and chemicals via engineered modular
metabolic pathways. Proceedings of the National Academy of Sciences 2012, p. 201209002.
42. Shen, C.R.; Lan, E.I.; Dekishima, Y.; Baez, A.; Cho, K.M.; Liao, J.C. High titer anaerobic 1-butanol synthesis
in Escherichia coli enabled by driving forces. Applied and environmental microbiology 2011.
43. Atsumi, S.; Hanai, T.; Liao, J.C. Non-fermentative pathways for synthesis of branched-chain higher alcohols
as biofuels. nature 2008, 451, 86.
44. Fonseca, C.M.; Paquete, L.; López-Ibánez, M. An improved dimension-sweep algorithm for the
hypervolume indicator. IEEE international conference on evolutionary computation. IEEE, 2006, pp.
1157–1163.
45. Ishibuchi, H.; Sakane, Y.; Tsukamoto, N.; Nojima, Y. Evolutionary many-objective optimization by NSGA-II
and MOEA/D with large populations. IEEE International Conference on Systems, Man and Cybernetics.
IEEE, 2009, pp. 1758–1763.You can also read