Analysis of Temperature and Humidity in Cold Transport Services
←
→
Page content transcription
If your browser does not render page correctly, please read the page content below
Proceedings of the 11th Annual International Conference on Industrial Engineering and Operations Management
Singapore, March 7-11, 2021

 Analysis of Temperature and Humidity in Cold
 Transport Services
 Alejandro Lerma-Carrillo, Jenny Díaz-Ramírez
 University of Monterrey
 Engineering Department
 San Pedro Garza García, N.L, México
 alejandro.lerma@udem.edu, jenny.diaz@udem.edu

 Teresa Gajewska
 Cracow University of Technology
 Rail Vehicles and Transport Department
 Krakow, Poland
 teresa.gajewska@pk.edu.pl

 Abstract
 The carriage of fresh food products is very sensitive to conditions during the transport, which makes the
 refrigerated transport of food products one of the most challenging transport activities. The aim of this project
 is to analyze factors that affect the product’s quality and storage life and demonstrate the influence of the right
 conditions during the operation. Four devices installed permanently in three trailers were used for analysis. The
 sensors have enabled the data collection of temperature, humidity, and lux during transportation. TVSM tool
 was used to diagnose. Data analysis was performed with the purpose to analyze the research question about
 how well the company handles its operating conditions of temperature and humidity during transportation. In
 this research, we found that temperature conditions were not satisfactory compared with the standard
 recommended conditions, like the official agreement of carriage perishable products (ATP). A similar situation
 occurred with humidity. This research will be useful for those who are interested in the quality of the fruits and
 vegetables during transportation and companies of the same industry that wants to know the impact of the right
 parameters in their trucks.

 Keywords
 Food quality, cold transportation, fresh food transportation, temperature, humidity, weight loss

 1. Introduction

 According to Gajewska (2019), the cold chain is one of the most challenging types of transport, which
 transportation and storage are essencial factors to consider at the moment you need to prolong the availability
 of consumption of perishable products. Donselaar, Woensel Broekmeulen, and Fransoo (2006) mention that in
 the food industry, there is the main differentiator between perishable and non-perishable foods: “Shelf life”.
 The shelf life of a product is measured in days, which is defined as “the period of time over which a food
 maintains its safety and/or quality under reasonably foreseeable conditions of distribution, storage, and use. The
 shelf-life of food begins from the time the food is produced and/or packed” (FSAI, 2019). Thus, perishable
 items are those with a short shelf life and non-perishable items have a long shelf life. Variables such as
 temperature and humidity, affect the growth rates of organisms that cause spoilage and the length of time the
 food remains edible and nutritious. (Tanner, 2016).

 © IEOM Society International 1298

Proceedings of the 11th Annual International Conference on Industrial Engineering and Operations Management
Singapore, March 7-11, 2021

 The transport of food products has been using methods of preservation of these products involving the
 application of the cooling systems. According to Pawlak, Maksym, and Skwarcs (2014), this allows the short-
 term storage of fresh food at a temperature from 10 to 0°C or long-term storage in a frozen state at a temperature
 from -12 to -22°C. Tanner confirms (2016) that food quality, storage, and transport covers areas associated with
 the impact of storage environments and duration on aspects of food quality, as well as technical considerations
 associated with logistics chain components such as cool and cold stores and transport systems.

 According to Bacon and Khanna (2015), it is an extreme case in the perishables sector of the retail industry:
 gross margins and a lot of residues; significant variations in the volume-sales relationship (depending on the
 seasonal nature and the climatic factor) and a growth opportunity for the value and also a brand risk. An effective
 and rapid supply chain helps reduce waste along the chain by delivering a product to the warehouse with a long
 shelf life, which could mean less consumption of the shelf life between manufacture or sale. A study conducted
 by the Asian Food Information Center (AFIC) in 2010 states that 67% of consumers in India constantly check
 the expiration dates of products before purchasing to verify their expiration. A fast and good supply in the
 processes increases the income and gross profit proportionally.

 Stragas and Zeimpekis (2006) said that as the market of perishable food is increasing (e.g. refrigerated
 products), regulations of the supply chain must be prescribed by public authorities to protect final customers
 from health hazards. Temperature and other types of conservation control at each stage of the supply chain are
 essential to maintain quality until it reaches the final consumer. Temperature is one of the most critical factors
 affecting the quality of perishable foods. This factor is influenced by delays in logistics and temperature changes
 during storage, which is crucial to maintain optimal conditions. For example, when refrigerated meat or salad
 is stored above 5°C, bacteria will multiply due to the environment. Depending on the degree of abuse of the
 temperature, the shelf life of food is shortened or spoiled and can lead to foodborne illness. From the moment
 the product is being produced until it reaches the end customer, maintaining the proper temperature will have a
 strong impact on the freshness, desirability, and quality of perishable food. Temperature is a factor that must be
 in control during the entire life cycle of the product, for which companies that are dedicated to this line of the
 industry have sought and developed alternatives to store their products with relevant temperature control.

 Perishable foods are becoming increasingly important to grocery retailers because many consumers choose one
 supermarket over another and perishable food losses can reach up to 15% due to spoilage and mishandling of
 products and this is serious speaking of financial issue. (Wang and Li, 2012). In the European grocery sector,
 for example, products that are not bought before the expiration date, their costs amount to millions of dollars
 per year. Stragas and Zeimpekis (2016) mentioned that storage is critical in the cold chain since products are
 normally stored more than once by different intermediaries (producers, retailers, etc) until they reach the end
 customer. To preserve quality and safety, it has been established that the storage procedure is a great challenge
 and vital to the cold food supply chain.

 1.1 Importance of the Problem
 According to Jedermann, Nicometo, Uysal, and Lang (2017), shelf life mainly depends on temperature
 deviations during transport and storage. Knowing the maximum or maximum temperature measured at which
 products should be stored is not particularly helpful. If there is a deviation of 1-2°C for several days it could be
 significant for the loss of shelf life, while if you look at the product during charging, it hardly affects the shelf
 life. The shelf life gives the period of time during which the product can be stored at a certain reference
 temperature until it is no longer consumable, so the consumer would not buy it or if they already have it at
 home, they would not use it. Aung Min and Seok Chang (2013) mention that of all the factors that can affect
 the storage life of food products after their harvest, the temperature is the most important. For that, there are
 refrigeration systems that are designed so that they can operate at an optimal range of conditions such as
 temperature and humidity, with the ability to adjust depending on the fruits or vegetables that are going to be
 stored.

 Different studies of storage of fruits and vegetables, like Postharvest Center of University of California (2016),
 Engineering Toolbox (2004), and the official Agreement on the International Carriage of Perishable Foodstuffs
 and on the Special Equipment to be used for such Carriage (ATP, 2016); suggest different parameters of
 temperature, which is confusing for the company under study. With the help of sensors providing information

 © IEOM Society International 1299
Proceedings of the 11th Annual International Conference on Industrial Engineering and Operations Management
Singapore, March 7-11, 2021

 about temperature and humidity during the transport of products to control this important parameter, we can
 see in Figure 1 such differences for the most common food transported.

 Figure 1. Recommended temperature conditions according to different researches for several fruits.

 1.2 Research Purpose
 The purpose of this project is to analyze the current situation of the cold chain food transportation process in
 the company under study to propose strategies for operational solutions to ensure quality during transport.
 Things to do will be to develop a diagnosis about how is the process in the transport of products (fruits and
 vegetables) and with the support of the sensors in trucks, to identify the relationship between the factors like
 temperature and humidity to the quality of the products.

 1.3 Methodology
 Among the different research and improvement methodologies are Deming, DMAIC (Díaz et al, 2018), Lean
 Six Sigma, etc. There are some suggestions focused on quantitative research, but they can also be kept in mind
 in qualitative research whenever appropriate. For this research, which is for diagnosis and to find better
 conditions for food preservation during transport, the methodology proposed by Bisquerra (2010) with the
 support of other researchers, is selected. The remaining of this paper continues following this process which
 includes in section 3 a relevant literature review, the collection method in section 4, data analysis in section 5,
 and finally, conclusions and recommendations.

 2. Literature Review

 This section focuses on the TVS mapping relevance for the study, and the most relevant concepts that affect the
 senescence of fresh food: temperature, transpiration rate, humidity, and weight loss.

 2.1 Transportation Value Stream Mapping
 The Transportation Value Stream Mapping (TVSM) tool proposed serves to identify and define specific types
 of waste during transportation with the aim of improving efficiency as a relevant performance measure.
 According to Villarreal (2012), waste is related to each efficiency factor, availability, performance, and quality.
 In the supply chain, the value stream is called the series of added value steps from the origin of the raw material

 © IEOM Society International 1300
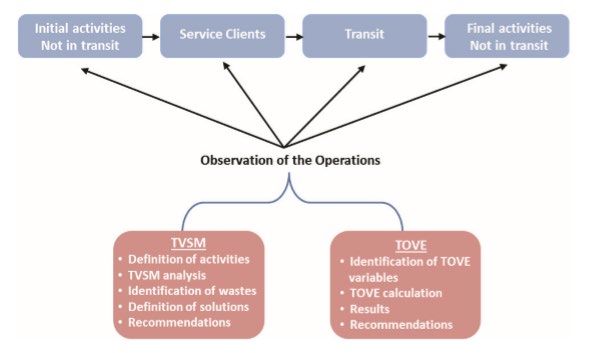
Proceedings of the 11th Annual International Conference on Industrial Engineering and Operations Management
Singapore, March 7-11, 2021

 to the final consumer. The purpose of TVSM is to identify and eliminate wastes and optimize the value-adding
 activity across the whole supply chain and the wastes impact the availability, performance, and quality. In
 Figure 2, there is a methodological approach using lean thinking to develop a good Value Stream Mapping.

 2.2 Temperature conditions
 According to Sánchez, Martínez, Castillejo, Frutos, and Hernández, (2020), one of the main challenges of the
 food industry is the control of the main environmental factors that have influenced the quality of perishable
 products. Temperature is the main factor affecting quality, but there are others such as humidity and gas
 concentrations that also play an important role in maintaining postharvest quality. For this reason, monitoring
 these factors is a key procedure to assure quality during the useful life and evaluate losses. Once this parameter
 is controlled, longer service life will be ensured but it is still a problem due to all the factors that may arise.
 According to the University of Maine Cooperative Extension (2002), fruits and vegetables that require warmer
 storage temperatures (40 to 55°F) can be damaged if they are subjected to near-freezing temperatures (32°F).
 Cooler temperatures interfere with normal metabolic processes. This is referred to as a chilling injury.

 Figure 2. Methodological approach followed to conduct the improvement of road transport operations using
 lean thinking. Villarreal (2012)

 2.3 Transpiration Rate
 Transpiration is the process by which fresh fruits and vegetables lose moisture (Becker and Fricke, 2000). The
 process includes the transport of moisture through the skin of the commodity, the evaporation of this moisture
 from the commodity surface, and the convective mass transport of the moisture to the surroundings. The storage
 life of a commodity is influenced by its respiratory activity. At low temperatures, respiration is reduced, and
 senescence is delayed. To minimize losses due to transpiration, and thereby increase both market quality and
 shelf life, commodities must be stored in a low temperature, high humidity environment.

 2.4 Relative Humidity and weight loss
 The University of Maine Cooperative Extension (2002), defines that transpiration rates (water loss from
 produce) are determined by the moisture content of the air, which is usually expressed as relative humidity. At
 high relative humidity, produce maintains salable weight, appearance, nutritional quality, and flavor, while
 wilting, softening, and juiciness are reduced. Lufu, Ambaw, and Opara (2020) say that high temperatures, low
 relative humidity, and high air velocity increase transpiration rates, as consequence, weight loss will be present
 in the products. At a constant temperature, small changes in relative humidity can significantly affect the rate
 of water loss in fresh produce. According to with Postharvest Center and the study by Lufu, Ambaw, and Opara
 (2020), the recommended relative humidity for fresh food is between 90% - 95%. This can also be demonstrated
 with a study in the case of pears about the same temperature (0°C) at different relative humidity, on the study
 of Xanthopoulos G. (2017) about the behavior of pears in different humidity in Figure 3.

 © IEOM Society International 1301
Proceedings of the 11th Annual International Conference on Industrial Engineering and Operations Management
Singapore, March 7-11, 2021

 Figure 3. The effect of relative humidity. Reduced mass loss of pears with storage time. (Xanthopoulos G.,
 2017)

 3. Data Collection

 For data collection of the conditions of refrigerated products, the use of humidity and temperature sensors in
 vehicles intended for the transport of food products is now the standard. To accomplish the objectives,
 specialized sensors have been used that can perform the measurement every two minutes. The sensor SHT30
 showed in Figure 4 measures temperature (± .3°C), humidity (± 3%) and lux (lx). The information about how
 the process of transportation is provided by the supervisor of the company. 2 sensors in one truck and another
 2 trucks with one sensor per each were analyzed.

 Figure 4. The measuring sensor used (SHT30)

 4. Data Analysis

 4.1 Transformation Value Stream Mapping
 With information from the company, a Value Stream Mapping was developed with purposes of the diagnosis
 about how the operation of transport is. The company first collects goods from the customer, then goes back to
 the warehouse and finally performs the distribution. It is a long process, where there are different areas to
 optimize, but the purpose of this research is to analyze the quality during the transport, so the result of the
 exercise of VSM is summarized in Figure 5.

 Suggestions to the company about how to improve some of the processes and perform some activities at the
 same time were presented. As a small example, prepare documentations and cooling the trailer could be done
 at the same time. Here, the most important thing, according to the observations, the total time of the operation
 is 4,925 minutes counting the transportation. Just the operations of transportation (to import to delivery to the
 warehouse and then to the clients), is 74% of the operation time, so this is why we focus on the analysis of
 sensors during transportation.

 © IEOM Society International 1302
Proceedings of the 11th Annual International Conference on Industrial Engineering and Operations Management
Singapore, March 7-11, 2021

 Figure 5. TVSM of the company according with their information

 4.2 Analysis of Temperature and Light Conditions
 It has already been mentioned that temperature is one of the most important critical factors in the transport of
 fruits and vegetables. The total time of each reading was around 20 thousand minutes. We can observe in Figure
 6 the temperature readings of the two sensors in truck 1. A high-temperature behavior is observed around 11,500
 minutes, which indicates that the truck stopped transporting products or is at rest. This situation can be verified
 in Figure 7 with the behavior of the lux measured during the same time as the temperature in the first truck,
 where lux means light detection in a square space; so the data analysis is concentrated in an average period of
 1 week. It is important to say that the data analysis is carried about the tangerine, and considers the company
 operation conditions (8°C – 14°C), ATP Agreement with the consideration of chilling injury (0° - 6°C) and
 Postharvest Center of the University of California (5°C – 8°C) (Postharvest Center, 2016). In Figure 6, the
 suggested limits by these different studies are contrasting the actual behavior of the temperature.

 Figure 6. Temperature behavior during the whole trip according to sensors of the first truck

 © IEOM Society International 1303
Proceedings of the 11th Annual International Conference on Industrial Engineering and Operations Management
Singapore, March 7-11, 2021

 Figure 7. Lux behavior during the whole trip according to sensors of the first truck

 For the first truck with two sensors, a paired difference test was performed to show that the difference between
 each amount of data, can be equal considering the specifications of the sensor (±°.3C, ± 3% Relative Humidity).
 The results were a mean of .19 for temperature and -1.22 for Humidity, so average will be considered. After
 this, in Figure 8, the temperature during 11,500 minutes for the first truck behavior is shown.

 Figure 8. Temperature behavior of the Truck 1

 From Figure 8, percentages in conditions were calculated. The most frequent condition (43% of the time) was
 2°C to 4°C, followed by 4°C to 5°C (17.8% of the time), and 5°C to 6°C (10.4%). The percentage complying
 with the standard company conditions (8 – 14°C) was just 1.42% of the time, according to ATP 78.14%, and
 Postharvest Center the 19.10% of the time.

 For truck 2, the results are shown in Figure 9 with the same lux and temperature criteria, the data from 2 weeks
 was reduced to approximately one week for the analysis. The behavior of the temperature indicates that during
 almost 5,000 minutes, the product was stored at temperatures below 0°C t, which can indicate a problem since
 extreme or lower temperatures than necessary, can affect the product. Also, this situation opens an improvement
 window for cost reductions.

 © IEOM Society International 1304
Proceedings of the 11th Annual International Conference on Industrial Engineering and Operations Management
Singapore, March 7-11, 2021

 Figure 9. Temperature behavior of the Truck 2

 From Figure 9, the percentage in conditions was calculated. The most frequent percentage was -20°C to -17°C
 with 39.4% of the time, followed by 6°C to 7°C, 22% of the time, and 0°C to 2°C, 15.5% of the time. The
 percentage in the standard company conditions (8 – 14°C) was 0%, for ATP 30.74%, and Postharvest Center
 with 31.96%.

 For truck 3, the results are shown in Figure 10. The temperature in truck 3 is the best graph according to the
 company standard parameters. There are 2 critical temperatures that are below freezing, but during the trip,
 indicates a closer behavior to the standards.

 Figure 10. Temperature behavior of truck 3

 From Figure 10, the percentage in conditions was also calculated. The most frequent percentage was 5°C to
 6°C (21.3% of the time), followed by 4°C to 5°C (12%), and 2°C to 4°C (11.4%). The percentage in company
 standard conditions (8 – 14°C) was 21.67%, for ATP 57.55%, and Postharvest Center with 42.09%.

 4.3 Analysis of Relative Humidity Conditions
 Despite the fact that the available sensors measure relative humidity inside the truck, the company is not
 controlling this parameter, even though its great influence on the fruits and vegetable shelf life has been shown.
 With low humidity in the ambient conditions, it affects the transpiration rate, and then the weight loss of the

 © IEOM Society International 1305
Proceedings of the 11th Annual International Conference on Industrial Engineering and Operations Management
Singapore, March 7-11, 2021

 products. In this work, we have shown there are different sources that corroborate that the right humidity for
 products, 90% - 95% is the ideal, according to Postharvest center. Figure 11 shows the behavior of the %
 humidity in the three trucks. Figure 12 summarizes these results by showing the relative frequency of the time
 that the vehicle is in every % humidity range.

 (a)

 (b)

 (c)

 Figure 11. Humidity behavior (a) truck 1, (b) truck 2, (c) truck 3

 © IEOM Society International 1306
Proceedings of the 11th Annual International Conference on Industrial Engineering and Operations Management
Singapore, March 7-11, 2021

 Figure 12. Relative frequency per % humidity for the three trucks

 From these figures, we can observe that the percentage in conditions of Postharvest Center which is 90% - 95%
 is just 10.3% in truck 1, 13% in truck 2, and truck 3 never reached this range. About one-fourth of the time the
 % humidity was between 80% and 90%, and the same, between 50% and 60% humidity. 40.6% of the time
 truck 2 was under 50% humidity, which is an extremely unsafe condition for fresh food. In general, the average
 % humidity ranged between 66% and 70% for all trucks.

 Table 1 shows a summary of the diagnosis of the transport sample analyzed. Finally, based on the equation (1),
 Holcroft, D. (2015), that relates weight loss with the vapor pressure deficit, which is proportional to the relative
 humidity, we conclude that the fresh foods transported by the company lose around 0.44% of their weight/day
 during transport. This value is at least 0.37% (or six times) more than it should or they would be if the transport
 conditions were under control.

 (%/ ) = . ( ) ∗ ( ) (1)

 Results Truck 1 Truck 2 Truck 3
 Total min per trip 11,130 min 11,516 min 11,510 min
 Average Temp. of trip 3.49 °C -5.53 °C 5.3°C
 % Temp °C (Company standards) 1.55% 0% 21.67%
 % Temp °C of ATP 90.28% 30.74% 57.55%
 % Temp °C of Postharvest 19.73% 31.96% 42.09%
 Average %RH. of trip 71.66% 66.15% 65.76%
 % RH between 90-95 10.71% 13.08% 0%
 % Lux 13.21 94.7% 94.7% 92.8%
 Table 1. Summary of compliance

 5. Recommendations

 The immediate recommendations that arise from this work are:
 • Based mainly on the ATP Agreement and the consideration of chilling injury, the authors recommend
 setting the temperature optimal conditions between 0°C to 8°C for citrus products.
 • There is a potential for energy cost savings by controlling the temperature inside the trucks, and avoiding
 extreme refrigeration (or freezing); that is, temperatures below 0°.
 • The company must introduce as part of its quality standards, the control of the relative humidity. The
 standard should be set to 90%- 95%. The sensors available already measure this factor and it should be
 recorded and control. Focus on humidity is one of the most critical factors according to the literature

 © IEOM Society International 1307
Proceedings of the 11th Annual International Conference on Industrial Engineering and Operations Management
Singapore, March 7-11, 2021

 because weight loss is directly related. To validate this effect, weight loss sampling should be performed
 and taken into consideration as a quality indicator of good transportation service.
 • The presence of light can also influence quality. The lux in the trucks satisfy the recommendations. Some
 intermittence in light could be added, as some research suggests.

 6. Conclusions

 The cold chain is one of the most difficult topics in logistics because it is related directly to the quality and if
 the products are not in ideal conditions, it affects directly the health of their consumer. In this research, there
 are a lot of opportunities to continue to develop these issues. The company under study showed that the most
 important factors that affect the senescence of the fresh products: temperature, humidity, and light, are not under
 control, and they directly affect the shelf life and cause an excessive weight loss (0.25%/day extra). From the
 sample, the temperature compliance with its own standards occurs less than 25% of the time. Besides, a
 reconsideration of the company standards must be done, since they do not agree with any of the literature or
 official standard, even there are several international standards and most of them did not match. The relative
 humidity is related directly to weight loss and shelf life. If the relative humidity is low, the transpiration rate
 will increase because the Vapor Pressure Deficit will grow, and consequently, weight loss increases.

 References
 Aung Min, M. & Seok Chang, Y. (2013) Temperature management for the quality assurance of a perishable
 food supply chain, Food Control 40 (2014) 198 - 207
 Bacon J., Khanna, N. (2015) High-Velocity Supply Chains for Perishables: A Fresher Proposition. Cognizant
 20-20 Insights 2015, pp. 1-11
 Becker, R. & Fricke A. (2000) Transpiration and Respiration of Fruits and Vegetables. Research Assistant in
 the Mechanical and Aerospace Engineering Department. University of Missouri-Kansas City MO 64110-
 2823.
 Bisquerra, R. (2010) Educational Research Methods (Spain): CEAC Education
 Díaz R., J., Armendáriz, L., Salcedo, María F. and Castaños G., D. (2018) Increase of fuel efficiency in a
 passenger road transportation company cases. Proceedings of the International Conference on Industrial
 Engineering and Operations Management, Paris, France, July 26-27, pp. 46-58.
 Donselaar, K., Woensel, T., Broekmeulen, R. & Fransoo J. (2006) Inventory control of perishables in
 supermarkets. Elsevier, pp. 462 - 472
 Engineering ToolBox, (2004). Fruits and Vegetables - Optimal Storage Conditions. [online] Available at:
 https://www.engineeringtoolbox.com/fruits-vegetables-storage-conditions-d_710.html. 14 of July of 2020
 FSAI. Food Safety Authority of Ireland. Guidance Note No. 18 Validation of Product Shelf-life, Dublin.
 http://www.fsai.ie © FSAI 2019.
 Gajewska, T. (2019) Analysis of selected factors influencing the irregularity of deliveries of fruit and
 vegetables. Cracow University of Technology pp 1-11
 Holcroft, D. (2015) Water Relations in Harvested Fresh Produce. Postharvest Education Foundations. May
 2015.
 Jedermann, R., Nicometo, M. & Uysal, I. (2017) Reducing food losses by intelligent food logistics,
 Philosophical Transactions of the Royal Society
 Lufu, R., Ambaw A. & Opara, U. (2020) Water loss of fresh fruit: Influencing pre-harvest, harvest, and
 postharvest factors. Scientia Horticulturae 272 (2020) 109519
 Pawlak, H., Maksym, P. & Skwarcz J. (2014), Vehicle Transport Organization of Food Requiring
 Refrigeration, Teka. Commission of Motorization and Energetics in agriculture. Vol. 14, No. 4, pp 137-
 142
 Postharvest Center (2016) Fruits and vegetables fact sheets,
 http://postharvest.ucdavis.edu/Commodity_Resources/Fact_Sheets/, 7 August 2020
 Sánchez, R., Martínez, M., Castillejo, N., Guillamón, A. & Artés, F. (2020) Real-Time Monitoring System for
 Shelf Life Estimation of Fruit and Vegetables. Journal Sensors 2020, pp. 1-21
 Stragas, N. & Zeimpeis, V. (2014) Basic principles for effective warehousing and distribution of perishable
 goods in urban environment: Current status, advanced technologies and future trends
 Tanner, D. (2016) Food Quality, Storage, and Transport. Elsevier, 1 pp. 1-5

 © IEOM Society International 1308
Proceedings of the 11th Annual International Conference on Industrial Engineering and Operations Management
Singapore, March 7-11, 2021

 United Nations Economic Commission for Europe (UNECE) (2020) AGREEMENT ON THE
 INTERNATIONAL CARRIAGE OF PERISHABLE FOODSTUFFS AND ON THE SPECIAL
 EQUIPMENT TO BE USED FOR SUCH CARRIAGE (ATP),
 https://www.unece.org/fileadmin/DAM/trans/main/wp11/ATP_publication/ATP-2016e_-def-web.pdf. 15
 July 2020
 University of Maine Cooperative Extension (2002) Storage conditions: Fruits and Vegetables.
 https://extension.umaine.edu/publications/4135e/#:~:text=A%20general%20rule%20for%20vegetables,
 45%20to%2055%C2%B0F). 21 of July of 2020
 Villarreal, B. (2012) The Transportation Value Stream Map (TVSM). European J. Industrial Engineering Vol.
 6, No. 2, 2012. Pp.216-233
 Wang, X. & Li D. (2012) A dynamic product quality-based pricing model for perishable food supply chains,
 Elsevier, Omega 40 pp 906-917.
 Xanthopoulos G. (2017) The contribution of transpiration and respiration in water loss of perishable
 agricultural products-The case of pears. Athens Greece Biosystems Engineering June 2017 Agricultural
 University of Athens, Department of Natural Resources Management.

 Biographies
 Alejandro Lerma Carrillo is a mechanical engineer from the University of Monterrey with a degree in Master
 of Engineering Management from University in Monterrey. He had an academic international experience of six
 months at Cracow University of Technology, Poland in 2020 during his master concluding a final project in a
 company dedicated of transport food services. He has experience as production planner and tasks related to
 project manager with different focuses on the industry.

 Jenny Díaz Ramírez is currently a professor of the Department of Engineering at the University of Monterrey.
 She has worked previously as professor at Tecnologico de Monterrey, Mexico and Pontificia Universidad
 Javeriana Cali, Colombia. She is an industrial engineer from Universidad del Valle, Colombia. She holds an
 MSc in industrial engineering from Universidad de los Andes, Bogota, Colombia, an MSc in operations research
 from Georgia Tech, US and the PhD in Industrial Engineering from Tecnológico de Monterrey. She is a
 member of the National System of Researchers of CONACYT, SNI Level I, since 2015 and recognized as an
 associated researcher by Colciencias, since 2016. She is the author and co-author of scientific articles on topics
 such as applied optimization and statistics in health systems, air quality, energy efficiency in transport and
 logistics, and education in engineering.

 Dr. Teresa Gajewska since October 2014, she is an Assistant Professor in the Logistics Systems Division in
 the Institute of Rail Vehicles of the Cracow University of Technology, Poland (specialty: commodity science,
 logistics and transport). She is a member of the Polish Engineers and Technicians Association, since 2014. She
 acts as reviewer for more than 30 scientific journals, and she is associate editor of the Logistics Management
 and Transport Problems: Archives of Transport, International Journal of Shipping and Transport Logistics,
 Sustainability, member of the Editorial Board of the scientific journals: of the International Journal of Electronic
 Marketing and Retailing and Journal of Sustainable Development of Transport and Logistics and Guest Editor:
 of the Annals of Operations Research. She is author of 2 books (including 1 in press) on the optimization of
 transport and logistics costs and quality of logistics services in refrigerated transport. She main research interests
 include quality of road transport services, optimization of transport costs, transport process analysis of customer
 satisfaction, supply chain management and logistics management. She has published over 30 research papers
 in scientific journals and conference proceedings.

 © IEOM Society International 1309
You can also read