ANNUAL CLIMATE ASSESSMENT 2018 SINGAPORE - Weather.gov.sg
←
→
Page content transcription
If your browser does not render page correctly, please read the page content below
ANNUAL CLIMATE ASSESSMENT 2018
SINGAPORE
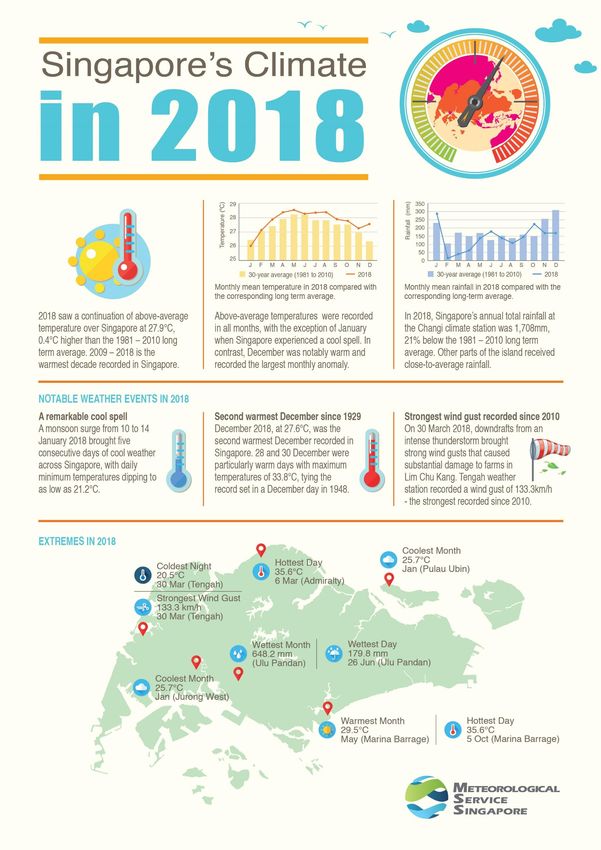
Singapore Climate in 2018

2018 saw a continuation of above-average temperatures over Singapore, with the year
recording a mean annual temperature of 27.9°C; 0.4°C above the 1981-2010 long-term average,
and 0.2°C warmer than 2017. 2018 was the joint 8th warmest year since Singapore temperature
records started in 1929.

All Singapore’s top ten warmest years have occurred in the past 25 years; eight of them in the
21st century. Temperature records also show that the period from 2009 to 2018 is the warmest
decade in Singapore. These are signs of the long term on-going warming in Singapore.

                                             30-year average(1981-2010)         2018          Figure 1: Monthly mean temperatures
Figure 1                                                                                      in    2018    compared     with  the
                                                                                              corresponding long-term average.
 Mean Temperature (deg C)

      29

                                    28

                                    27

                                    26

                                    25
                                             Jan    Feb    Mar     Apr    May   Jun    Jul    Aug     Sep     Oct     Nov    Dec

In 2018, above-average temperatures were recorded in all months, except January when
Singapore experienced an extended cool spell of five consecutive days from 10 to 14 January
(see Notable Weather Events section). This contributed to the 0.4°C below-average monthly
temperature of 26.1°C. In contrast to this cool start, the year concluded with a notably warm
December at 27.6°C, 1.2°C warmer than the long-term average. This is the second warmest
December since 1929, behind December 2015 (at 27.7°C).

The 2018 annual total rainfall across the island was close-to-average. However, at the climate
station in Changi, MSS’ main reference for historical records, the rainfall recorded was 1708
mm, 21% below the 1981-2010 long-term average. The largest shortfalls of rain were
experienced during the first inter-monsoon period (February to April) and at the start of the
Northeast Monsoon season (November and December). In contrast January, June, and October
were recorded above- average rainfall.

                                    350                                                       Figure 2: Monthly mean rainfall in 2018
                                                                                              compared with the corresponding long-
                                    300                                                       term average.
                                    250
                    Rainfall (mm)

                                    200
                                    150
                                    100
                                     50
                                         0
                                              Jan    Feb    Mar     Apr   May   Jun     Jul    Aug     Sep     Oct     Nov    Dec

Page 3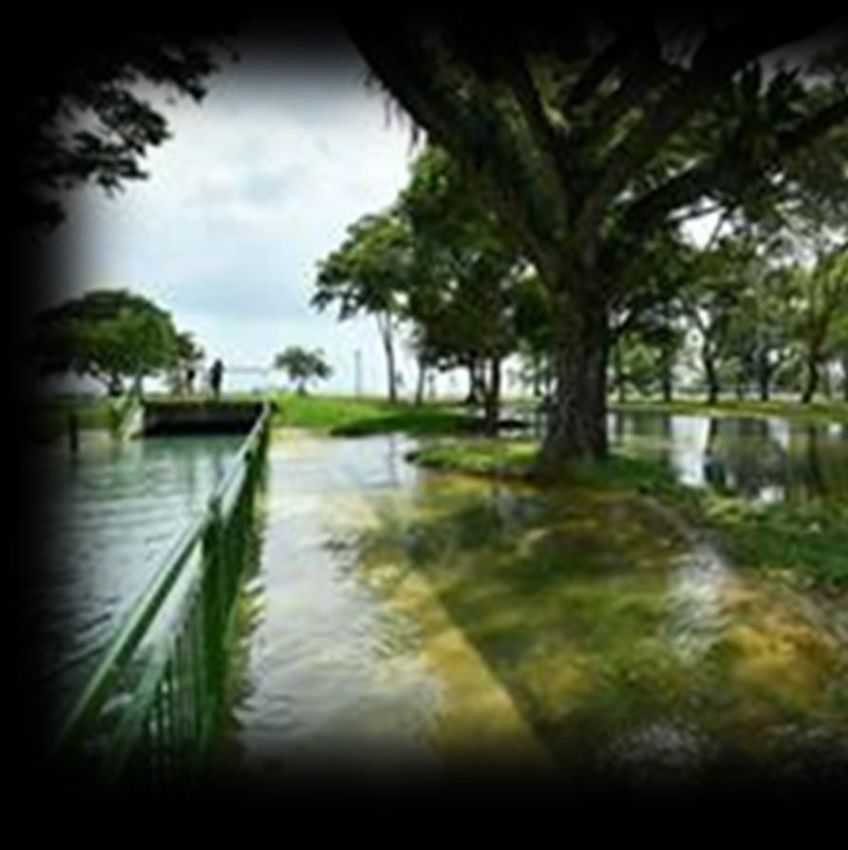
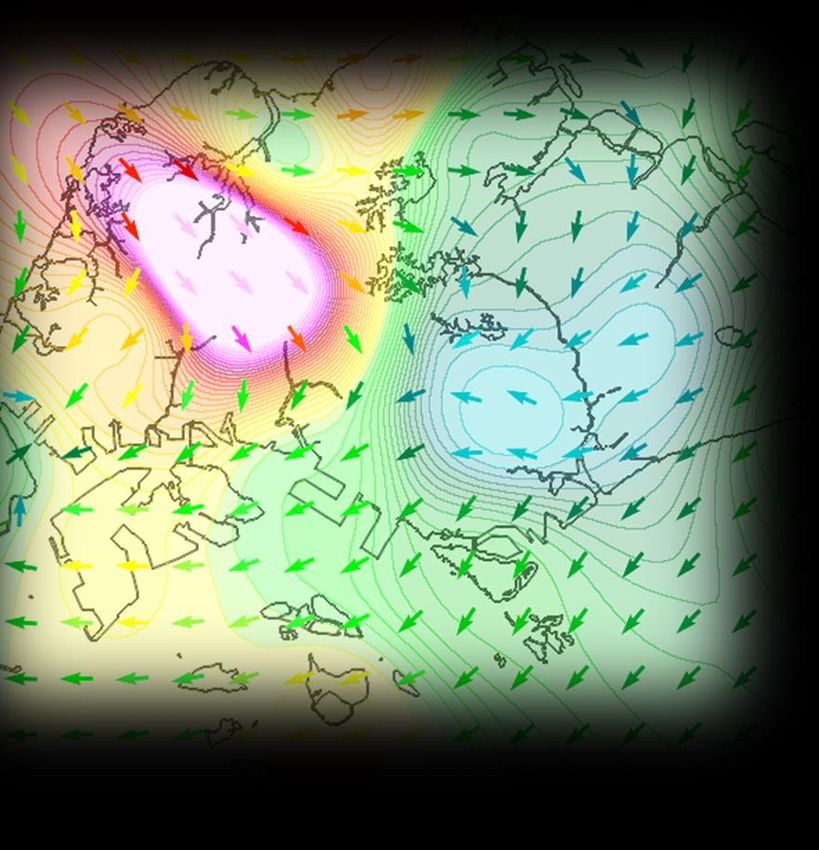
Large-scale Climate Variability in 2018

El Niño Southern Oscillation (ENSO)

Largely, 2018 was an El Niño Southern Oscillation (ENSO) neutral year with no significant
influence on Singapore’s climate. Weak La Niña conditions prevailed in the first quarter of 2018
and resulted in above-average rainfall over the region (Figure 3). However, it did not influence
the rainfall over Singapore. February and March 2018 experienced below-average rainfall which
was most likely influenced by other modes of naturally occurring rainfall variability (see section
on MJO impact). Apart from the weak La Niña at the start of 2018, there were signs of weak El
Niño conditions developing towards the end of the year.

Figure 3: Rainfall anomalies across Southeast Asia in January-March 2018 season consistent with weak
La Niña conditions.

From October onwards, the tropical Pacific sea surface temperature (SST) anomalies
approached El Niño thresholds. However, during that period, the SST anomaly patterns differed
from the typical El Niño pattern, with the warm anomalies extending further into the western
Pacific instead of being confined only to the eastern and central tropical Pacific (Figure 4).
Overall, the SST anomalies were either too weak or not sustained for long enough to induce a
response in the atmosphere. Consequently, rainfall anomalies did not show any region-wide
and seasonally consistent patterns typical of El Niño throughout the second half of 2018.

Page 4
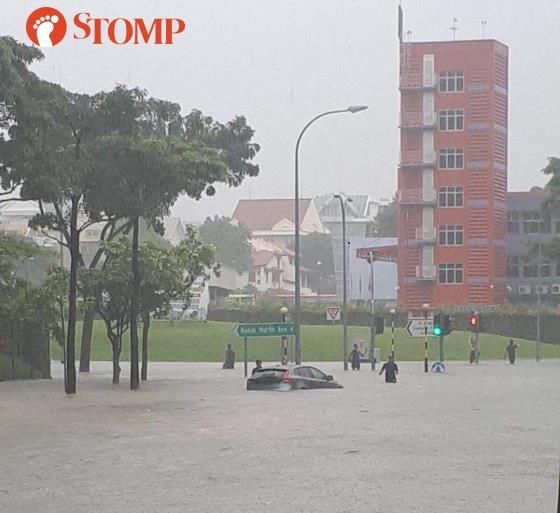
Figure 4: October-December 2018 detrended 1 sea-surface temperature (SST) anomaly patterns with
respect to 1976-2014 climatology showing warm SST anomaly extending across the tropical Pacific
Ocean. The SST anomaly regions for the indices of Nino3.4 region (red) and the Indian Ocean Dipole
(IOD) being the difference between the western (solid black) and eastern (dotted black) boxes are also
indicated on the map.

Indian Ocean Sea Surface Temperature Variability

While the Pacific Ocean and ENSO are the main source of year-to-year variability in the tropics,
the Indian Ocean also contributes to the rainfall variability across the region, including Singapore.
The variability across the Indian Ocean is monitored using a Dipole. The Indian Ocean Dipole
(IOD) is computed as the difference between the SST in a rectangular area across tropical
western Indian Ocean and a rectangular area in the eastern side of the Indian Ocean (Figure 4).
The Indian Ocean variability is often observed in conjunction with and in response to major
ENSO variability. However, at times, even without ENSO, the IOD can itself influence rainfall
patterns in the region.

Figure 5: Sea surface temperature anomalies during July-September 2018 showing colder-than-normal
temperatures with respect to 1976-2014 climatology over the eastern Indian Ocean (including the IOD
east box) and the Southern China Sea.

In 2018, the IOD was mostly within a neutral range except for the third quarter of the year when
it was marginally positive due to colder-than-average SST in the eastern Indian Ocean (see

1Turkington et al., 2018: “The impact of global warming on sea surface temperature based El Niño
Southern Oscillation monitoring indices.”

Page 5
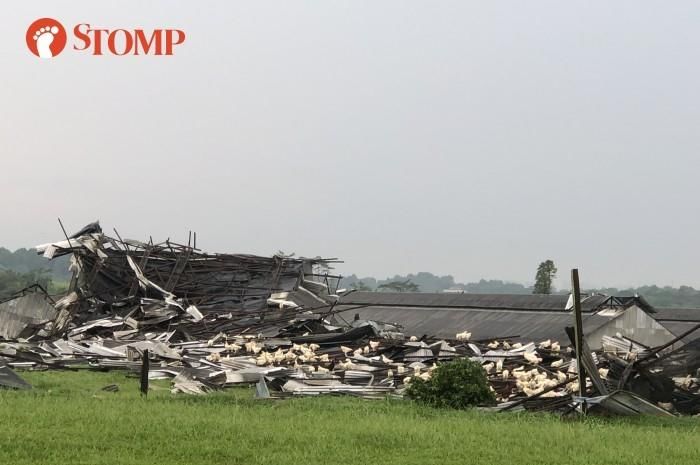
Figure 5 for July-September). The relationship between the eastern Indian Ocean SST
anomalies and the rainfall over Singapore is well known2. From June to November, colder SSTs
over the eastern Indian Ocean region increases the chance for Singapore to experience below-
average rainfall. The drier conditions over the western Maritime Continent across July to
September (Figure 6) are therefore consistent with what is expected when the eastern Indian
Ocean SST gets colder.

Figure 6: July-September 2018 seasonal average rainfall anomaly (in mm/day) over Southeast Asia
showing either wetter (green shades) or drier conditions (brown shades).

Madden-Julian Oscillation (MJO) Impact on Rainfall

Besides the two ocean-wide ENSO and IOD phenomena which influence year-to-year rainfall
and temperature variability across the Western Maritime Continent, another important
phenomenon is also known to affect regional rainfall on a shorter time-scale of a few weeks.
The intra-seasonal mode of atmospheric variability, referred to as the Madden-Julian Oscillation
(MJO)3, influences Singapore’s rainfall during the suppressed and enhanced convection phases.

2 Heng B.C.P. and Gao, E., 2018: “Rainfall over Singapore in relation to local and remote sea surface
temperatures”, in MSS Research Letters, 1, pp 15-21, available from CCRS web site.
3 Cheong, W.K. and Zheng, K. (2018): “A seasonal perspective of the Madden-Julian Oscillation’s

impact on Singapore Rainfall”, MSS Research Letters, 2, pp 12-17, available from CCRS web site

Page 6

Significance of the Madden-Julian Oscillation
 The MJO is a major fluctuation in tropical weather on weekly to monthly timescales. It is
 characterised by an eastward moving pulse of cloud and rainfall along the equatorial region
 from the Indian Ocean to the western Pacific. Each cycle typically lasts about 30 to 60 days.
 Research into the MJO is important because of its potential impacts on the intra-seasonal
                                                rainfall and temperature variations over
                                                Singapore and the Maritime Continent.

                                                     The MJO is known to be more active from
                                                     November to March. In studies done, the MJO
                                                     has been found to enhance rainfall during cold
                                                     surges of the Northeast Monsoon season,
                                                     bringing much wetter conditions to Singapore
                                                     and the surrounding region.

                                                     The MJO’s path along the equatorial region is
  The MJO vertical structure which has an upward divided into sub-geographical locations,
  motion section (enhanced rainfall) and a called phases, marked by the position of its
  downward motion section (suppressed rainfall). In
                                                      upward motion. These are phases 2-3 (Indian
  this instance it is in a particular phase over the
  Indian Ocean. Credit: NOAA Climate.                 Ocean), phases 4-5 (Maritime Continent),
                                                      phases 6-7 (Western Pacific) and phases 8
 and 1 (Western Hemisphere and Africa). When the MJO is active over the Indian Ocean and
 Maritime Continent in phases 2-4, it tends to bring enhanced rainfall over our region.
 Conversely, it can bring drier conditions while in phases 6-8.

The MJO was active several times in 2018 and affected the regional rainfall patterns. A very
strong MJO in the supressed rainfall phases for the Maritime Continent was active from end
January to end February, and again at the end of March and early April. Overall, the large-scale
dry conditions in the region in February and April 2018 (Figure 7) are consistent with the known
influence of the MJO across the western Maritime Continent. In the absence of a strong oceanic
influence (either ENSO or IOD) during these months, the drier conditions were likely due to the
MJO propagation.

 Figure 7: Rainfall anomaly patterns showing below-average rainfall conditions over Singapore and the
 surrounding region for 1-20 February 2018 (left), and 1-11 April 2018 (right); both correspond to MJO
 phases when regional rainfall is reduced.

Page 7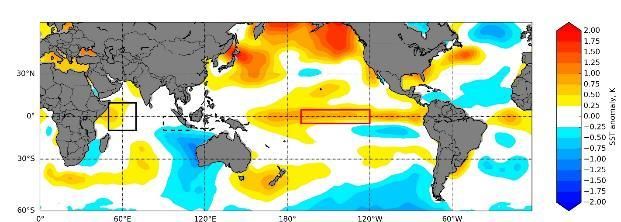
Figure 8: Rainfall anomaly patterns for 6-31 May 2018 showing above-average rainfall conditions around
Singapore (correspond to MJO phases when regional rainfall is enhanced), yet the Malaysian Peninsula
and Singapore at the southern tip, experience drier conditions.

In May 2018, there was another active MJO propagating but in the enhanced rainfall phases
(Phases 1 to 4). While the region experienced wetter conditions, the eastern coast of Peninsular
Malaysia and Singapore were largely drier (Figure 8) during this time.

In the second half of 2018, the MJO was more active in the last quarter than in the third quarter
(Figure 9) In October 2018, an MJO emerged in Phase 1, propagated to Phase 3 and re-
emerged in Phase 1 in November 2018. Thereafter, the MJO propagated around the globe to
Phase 8 in November, and continued propagating before easing in Phase 5 on the last day of
2018.

The MJO’s influence on the intra-seasonal rainfall patterns were noticeable in the last quarter of
2018 when the MJO was most active. In particular, from 2 to 12 November 2018, the western
parts of the Maritime Continent were wetter than usual (Figure 10), consistent with the typical
effects of MJO in Phases 2 to 4. This was also observed across most parts of Singapore except
Changi. Similarly in December 2018, in particular from 5 to 20 December 2018, the MJO was in
Phases 2 to 4 where it had a strong influence on the rainfall in the region (Figure 10). However,
over Singapore, the MJO’s influence was not significant and rainfall was near average across
the island.

Page 8
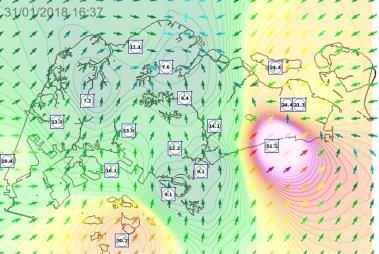
Figure 9: MJO propagation and phases from July to December 2018. MJO development is monitored using the Real-
time Multivariate MJO (RMM) index. It shows the position (e.g. Phases 4 and 5 are over the Maritime Continent) and
intensity of the MJO (the further out from the centre circle the stronger the MJO is). Numbers corresponding to the
dots on the lines indicate the date of the months which have been labelled in different colours.

Figure 10: Rainfall anomaly pattern from 2-12 November 2018 (left) and 5-20 December 2018 (right)
when the MJO was in phases which correspond to enhanced regional rainfall.

Page 9
Temperature in 2018

   Top 10 Warmest Years
        Since 1929                                                                              Temperature (°C)
   (Based on climate station)
                                                                                                          29.0
                                                                                                          28.8
2016       28.4°C                                                                                         28.6
                                                                                                          28.4
                                                                                                          28.2
2015       28.3°C                                                                                         28.0
                                                                                                          27.8
                                                                                                          27.6
1998       28.3°C                                                                                         27.4
                                                                                                          27.2
                                                                                                          27.0
1997       28.3°C

2010      28.1°C                     Figure 11: Annual mean temperature across Singapore in 2018.

2002      28.1°C
                                     Figure 12: Global annual surface air temperature anomaly relative to
                                     the average from 1981-2010. (Source: ERA-Interim Credit: ECMWF,
2005      28.0°C                     Copernicus Climate Change Service)
                      2018 is the
                                th
2018      27.9°C      joint 8
                    warmest year
2009      27.9°C

2014      27.9°C

2004      27.9°C

    26.0 27.0 28.0 29.0 30.0
                                                   -6.0   -4.0   -2.0   0.0   2.0   4.0   6.0

2018 was the joint 8th warmest year in Singapore. This is on par with 2004, 2009 and 2014, with
an annual mean temperature of 27.9°C, 0.4°C higher than the 1981-2010 long-term average.
Four out of the last five years are amongst the top 10 warmest years in Singapore based on
temperature records in Singapore since 1929. 2018 also concludes the warmest decade (2009
to 2018) observed in Singapore, with a mean temperature of 27.89°C, superseding the previous
warmest decade (1997 to 2006) by a very small margin of 0.02°C.

This significant milestone is testimony of the on-going long-term warming trend, as the 10-year
average smooths out year-to-year fluctuations where natural climate variability plays a big role
(Figure 13). In meteorology, a 30-year period is recommended for climatic averages, in
accordance with the standard set by the World Meteorological Organisation (WMO). But in the
case of the on-going warming, the climate is transient and hence it is preferable to use shorter
periods. A decadal mean is a convenient perspective, smoothing out the year-to-year variability
while allowing for regular updates of the on-going changes in the climate. For example, the 1997
to 2006 record was difficult to supersede as it includes the largest 1997/98 El Niño event

Page 10
recorded in the modern era, which contributed to two very warm years in Singapore in 1997 and
1998. The recent decade also includes a very strong El Niño event which contributed to 2015
and 2016 being very warm years. Below decadal means, the naturally occurring variability can
mask underlying climate trends.
29
Annual Mean Decadal (past 10-year) Mean
28.5
Average Temperature (°C)
28
27.5
27
26.5
26
2018
25.5
1955 1960 1965 1970 1975 1980 1985 1990 1995 2000 2005 2010 2015
Figure 13: Annual mean vs decadal mean temperature showing the temperature rise over Singapore
(at the climate station) with time. The annual mean temperature exhibits more fluctuations due to the
influence of natural modes of variability (such as ENSO) on the climate.
Globally, most parts of the world recorded above average temperatures (Figure 12) and the
global average temperature for 2018 was 0.38°C4 (±0.13°C) above the 1981-2010 long-term
average and 1.0°C (±0.13°C) above the pre-industrial baseline (1850-1900). This is the 4th
warmest year on record and the past 4 years were the top 4 warmest years (2016, 2015, 2017
and 2018 in descending order) on record, highlighting the on-going global warming.
4Based on 5 independently maintained global temperature datasets: HadCRUT.4.6 produced by the UK
Met Office in collaboration with the Climatic Research Unit at the University of East Anglia, UK; NOAA
Global Temp produced by National Oceanic and Atmospheric Administration, National Centers for
Environmental Information, USA; GISTEMP produced by the National Aeronautics and Space
Administration Goddard Institute for Space Studies, USA; JRA-55 produced by the Japan Meteorological
Agency, Japan; and ERA-Interim produced by the European Centre for Medium-range Weather
Forecasts, UK.
Page 11Rainfall in 2018
Singapore’s annual total rainfall of 1708 mm recorded at the climate station in Changi was 21%
below the 1981-2010 long-term average. This rainfall deficit was largely confined to the eastern
parts of the island around Changi, while the western and northern parts recorded rainfall above
the long-term average. The average rainfall across the island was close to the climatic mean
(Figure 14 and 15), which is consistent with the lack of strong inter-annual forcing (e.g. neutral
ENSO year as detailed in the earlier section).
Top Driest Years Since
1869 Rainfall (mm)
(Based on climate station)
3000
2800
2600
1997 1119 mm
2400
2200
2000
1800
2015 1267 mm
1600
1400
1200
1985 1484 mm 1000
Figure 14: Annual total rainfall distribution across Singapore in
1990 1524 mm 2018.
2014 1538 mm
Rainfall
Anomaly (%)
1981 1556 mm 50
40
30
20
1960 1570 mm 10
0
-10
-20
1888 1605 mm
-30
-40
-50
1971 1614 mm
Figure 15: Annual rainfall anomalies (in percentage term)
1877 1654 mm across Singapore (relative to the 1981-2010 average) in 2018.
1883 1695 mm
In 2018, the climate station recorded its 12th lowest
2018 1708 mm annual total rainfall on record, but overall rainfall
over the whole island was close to average.
1000 1200 1400 1600 1800
The most important large-scale influence in 2018 was the MJO and its propagation from a rainfall
enhancing phase to a rainfall suppressing phase, as evident from the monthly rainfall anomalies
across Singapore.
Page 12The spatial pattern leading to an annual total rainfall that is lower in the eastern than the western
parts of the island is prominent in several months (March, April, May, November and December),
albeit within a range of the Singapore averaged signal (from very dry in February to wet in
November).
July and August showed significant island-wide dry anomalies and this is likely to be in relation
to the cooler SST anomalies which had developed across the eastern Indian Ocean, leading to
a cold IOD signal. In contrast, there were three months (January, June and October) that were
notably wet island-wide during the year.
Rainfall Anomaly (%)
(%)
-80 -40 0 40 80 120 160 200
January February March April
May June July August
September October November December
Figure 16: Monthly rainfall anomalies (in percentage term) across Singapore in 2018 (relative to the
1981-2010 average for the particular month).
Page 13Past and Future Temperature Trends Singapore’s climate station temperature record dates back to 1929, allowing us to put the recent observed warming trend into a longer time perspective by including future projections which were generated for the island as part of the 2nd Singapore Climate Change Study5 (Figure 17). The historical record also enables us to track and put into perspective the future warming projected for Singapore over the next 80 years with what has been experienced over the last 90 years for which we have instrumental records. Figure 17: Tracking of Singapore's annual average temperature from observations and models. Observations are taken from the climate station record dating back to 1929 (the 1981-2010 climatological average value is shown by the horizontal line). Modelled simulations are from the 2nd Singapore Climate Change Study: either for the current climate (grey shade), or for future projections for a business-as-usual emission scenario RCP8.5 (pink shading) or for a strong mitigation scenario RCP4.5 (blue shading) The thick coloured lines indicate the averaged model results. Singapore’s annual mean temperatures since 1994 have not fallen below the climatological (1981-2010) average of 27.5°C and are at least 1°C warmer than the average annual mean temperature in the 40-year period prior to 1970. Annual temperatures have continued to climb steadily since the mid-1970s, reflecting the long-term warming trend experienced in Singapore due to a combination of man-made global warming and urbanisation. The warming trend over the last 40 years (1979-2018) has been 0.29°C per decade. This warming is projected to continue and either accelerate or slow down, depending on the future emission levels of 5CCRS, 2015: “Singapore’s Second National Climate Change Study: Climate Projections to 2100”, Report to Stakeholders, 73pp, available from CCRS Web site. Page 14
anthropogenic greenhouse gases (2 different scenarios were used and are displayed in Figure
17). It highlights that while global warming is a long-term global concern, its local effects are
already being experienced through the warming observed in Singapore.

The current rate of warming has had a significant effect on the annual cycle of temperature when
the most recent and warmest decade on record (2009-2018) is compared to the coolest decade
from the historical record (1967-1976). While the monthly temperature continues to peak in May
and January remains the coolest month, in the last 10 years, January has been as warm or
warmer than the warmest month (May) in the 1970s (Figure 18).

Figure 18: Annual cycle of mean temperature for the latest decade (2009-2018) compared to the coolest
decade in the historical record (1967-1976) for the climate station (left) and for the Paya Lebar station
(right).

Between these two decades, the change in mean temperature computed from the climate
station observations indicates a mean warming of 1.6°C while measurements from the Paya
Lebar station reveal an even larger difference of 2.2°C. It is likely that the larger warming
measured in Paya Lebar encompasses a stronger component of the Urban Heat Island (UHI)
effect than in the case of the climate station in Changi which is located further away from the
most urbanised part of the island.

It is important to note that the warming experienced at any location across Singapore is a
combination of the local response of on-going large-scale global warming and local UHI effects.
This fact will also be true for the future projections of temperature. The projected increases of
temperature depicted in Figure 17, which depend only on the rate of future emissions, do not
include potential changes in UHI local effects; these effects could further exacerbate future
warming that Singapore may experience.

Page 15
Notable Weather Events in 2018

January 2018 – an eventful weather-month

A remarkably cool month
Overall, January 2018 was a cool month as a result of frequent rain from monsoon surges,
Sumatra squalls and localised thunderstorms. Three monsoon surge episodes affected
Singapore in January 2018, with the second episode being the most significant. This surge
episode brought five consecutive days of cool weather across the island from 10 to 14 January
2018. During this period, the daily maximum temperature dropped from 33.2°C on 9 January to
24.3°C on 13 January. The lowest daily minimum temperature was 21.2°C on 14 January 2018
(Figure 19). The cool and rainy weather (Figure 20) was enhanced by the Madden-Julian
Oscillation (MJO) which was in its active wet phase during the episode. The period from 10 – 14
January 2018 was the longest cool spell Singapore has experienced in the last two decades.

Figure 19: There was a significant decrease of 8.9°C in the daily maximum temperature (yellow line)
during the Northeast Monsoon surge on 10 – 14 January 2018.

Figure 20: Weather radar image on 13 January 2018 showing widespread rain over Singapore and the
surrounding region.

Page 16
Sumatra Squall in January

On 8 January 2018, a Sumatra squall, which is not typical during a Northeast Monsoon season,
brought widespread thundery showers in the morning as it moved over the island toward the
South China Sea (Figure 21). The rain was heaviest over the eastern half of the island where
several flash floods were reported (Figure 22). The highest total daily rainfall recorded on that
day was 131.8mm at Paya Lebar, about 57% of the station’s average monthly rainfall total for
January.

       Figure 21: Weather radar image showing heavy rain from a Sumatra squall (indicated by red
       areas) affecting the eastern parts of Singapore in the morning on 8 January 2018.

         Figure 22: Cars stranded in flash floods from heavy rainfall on 8 January 2018 (Source: STOMP).

Hailstones and Waterspout
January 2018 ended off as eventful as it started, with the occurrence of hailstones and a
waterspout.

On 30 January, strong solar heating of land areas coupled with convergence of winds over
Singapore gave rise to intense thunderstorm clouds that towered more than 14km high6. This
brought rain and hailstones over the northern parts of the island at Seletar, Ang Mo Kio, Yishun

6
    Most thunderstorm clouds typically reach a height of 10-12 km into the atmosphere.

Page 17
(Figure 23). While hailstones exist in thunderstorm clouds, the occurrence is relatively rare in
the tropics as hailstones usually melt before reaching the ground. More information on hail is
available on the MSS website www.weather.gov.sg/learn_weather_systems/.
Figure 23: Weather radar image in the late afternoon of 30 January 2018 showing intense rainfall over
the northern and north-eastern parts of Singapore, where hailstones fell.
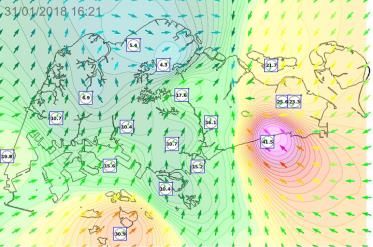
On 31 January, a waterspout7 associated with an intense thunderstorm developed in the late
afternoon over the sea areas off East Coast Park, about 6 km to the southeast of Singapore
(Figure 24). The highest maximum wind gust associated with the intense thunderstorm during
the period was around 59km/h (Figure 25). The strong wind gusts from the waterspout blew sail
boats a few meters inland from the beach.
4.10pm 4.20pm 4.30pm
Figure 24: Time series of weather radar images in the late afternoon on 31 January 2018 showing
heavy rainfall over the East Coast Park area
4.10pm 4.21pm 4.37pm
Figure 25: Time series of surface winds (depicted by arrows) in the late afternoon on 31 January 2018
showing strong winds over the East Coast Park area
Strongest Wind Gust recorded since 2010
During the year, heavy rains and strong wind gusts from intense thunderstorms caused several
incidents of flash floods, fallen trees and damage to property. In particular, on 30 March 2018,
7A waterspout is a rotating column of winds associated with intense thunderstorms over the sea. They have a similar
appearance to tornados but they are generally weaker and not as destructive as their land counterparts.
Page 18a thunderstorm that developed over Johor, Peninsular Malaysia moved southeast and
intensified over of the western part of Singapore (Figure 26). The strong wind gusts from the
intense thunderstorm caused substantial damage to chicken farms in Lim Chu Kang (Figure 27).
The maximum wind gust of 133.3 km/h recorded at the Tengah weather station that afternoon
was the strongest wind gust recorded over Singapore since 2010.
Figure 26: Weather radar images of the thunderstorm propagating from Johor toward Singapore, and
intensifying over the western part of Singapore on 30 March 2018
Figure 27: Damaged chicken farms in Lim Chu Kang due to strong wind gusts on 30 March
2018.(Source: STOMP)
Flooding due to high tides
Around noon on 2 February 2018, a very high tide8 of 3.44m coupled with strong northeasterly
winds over sea areas, pushed seawater several meters inland along the eastern coast of
Singapore. This resulted in parts of the East Coast Park being covered by water (Figure 28).
Some roads in Katong were also affected by overflowing seawater from the drains and canals
through East Coast Park. The water on the roads subsided an hour later.
8 Tide levels of 3m and above are considered higher than normal. At times, very high tides coupled with relatively
strong winds over sea areas northeast of Singapore can bring localised flooding in low-lying areas even without
rainfall.
Page 19Figure 28: Overflowing seawater at East Coast Park on 2 February 2018 as a result of a very high tide of 3.44m coupled with strong northeasterly winds. (Source: The Straits Times © Singapore Press Holdings Limited. Permission required for reproduction) Second warmest December ever recorded since 1929 December 2018 experienced several warm days, particularly in the second half of the month. This was due to the presence of a low pressure system in the northern South China Sea that led to dry and stable atmospheric conditions over Singapore and the surrounding vicinity (Figure 29). Figure 29: Satellite image on 28 December 2018 showing dry weather over Singapore and the surrounding vicinity due to the presence of a low pressure system in the South China Sea. At the climate station in Changi, the mean monthly temperature for December 2018 was 27.6°C, 1.2°C above the long-term average. This makes December 2018 the second warmest December since 1929, lagging by 0.1°C below the December 2015 record. On 28 and 30 December 2018, the climate station in Changi recorded a maximum temperature of 33.8°C. This ties the record set on 2 December 1948 as the highest ever recorded daily maximum temperature for a December day since temperature records started in 1929. Page 20
General Climate of Singapore

  Singapore has a tropical climate which is warm and humid, with abundant annual rainfall of
  about 2,200 mm. Generally, the eastern parts of Singapore receive less rainfall compared
  to other parts of the island. The winds are generally light but with a diurnal variation due to
  land and sea breezes.
  The temperature variation throughout the year is relatively small compared to the mid-
  latitude regions. The daily temperature range has a minimum usually not falling below 23-
  25°C during the night, and a maximum usually not rising above 31-33°C during the day.

  Singapore’s climate is traditionally classified into four periods according to the average
  prevailing wind direction:
  a) Northeast Monsoon (December to early March).                                  Rainfall (mm)
                                                                                             3000
  b) Inter-monsoon (Late March to May).                                                      2800
                                                                                             2600
  c) Southwest Monsoon (June to September).                                                  2400
                                                                                             2200
                                                                                             2000
  d) Inter-monsoon (October to November).                                                    1800
                                                                                             1600
                                                                                                1400
                                                                                                1200
                                                                                                1000
  The transitions between the monsoon seasons occur      Average Annual Rainfall (1981-2010)
  gradually, generally over a period of two months (the  (based on 28 rainfall stations)
  inter-monsoon periods). The winds during the inter-
  monsoon periods are usually light and tend to vary in
  direction. The three main rain-bearing weather systems that affect Singapore are the
  Northeast Monsoon surges, “Sumatra” squalls and convective showers/thunderstorms.
  Convective showers/thunderstorms occur throughout the year. “Sumatra” squalls commonly
  occur during the Southwest Monsoon and inter-monsoon periods, while the monsoon surges
  occur during the Northeast Monsoon season.

  Sea Breeze Induced Thunderstorms: Sea breezes are winds formed as a result of
  temperature differences between the land and the adjoining sea. The sea breeze, carrying
  a large amount of moisture from the sea, blows inland during the day where the moist air
  mixes with the rising warm land air and, under unstable conditions, form rain clouds in the
  afternoon. During the inter-monsoon periods, when winds are light, sea breezes are more
  common.

  “Sumatra” Squalls: A “Sumatra” squall is an organised thunderstorm line that develops
  over Sumatra or the Straits of Malacca, often overnight, and then moves eastward to affect
  Peninsular Malaysia and Singapore. In a typical event, the squall line can bring about one
  to two hours of thundery showers. Often this happens in the predawn or morning hours.
  Some Sumatra squalls are also accompanied by wind gusts with speeds up to 80 km/h (22
  m/s) which are strong enough to uproot trees.

  Northeast Monsoon Surges: A Northeast Monsoon surge is a surge of cold air from
  Central Asia. During the period December through early March, the heartland of Asia
  including Siberia, experiences very low, cold temperatures. From time to time, this cold air
  rushes out of Central Asia leading to an abrupt increase in northeasterly winds over the
  South China Sea blowing towards the warm tropics. The sea warms and moistens the
  overlaying air and the wind eventually converges to bring about widespread rain in the
  tropical regions. December and January are usually the wettest months of the year in
  Singapore and a few heavy rain spells, caused by surges of Northeast Monsoon winds,
  contribute significantly to the rainfall in these months. A typical rain spell generally lasts for
  a few days.

Page 21
Network of Automatic Weather
Stations as of Dec 2018 Manned Weather Stations
Sembawang
Seletar
Tengah Paya Lebar
Upper Air Changi
Observatory
Legend
Stations measuring rainfall only
Stations measuring rainfall and other elements
including temperature, winds & relative humidity
About the Meteorological Service Singapore (MSS)
The MSS is Singapore’s national authority on weather and climate. It is a division under the National
Environment Agency (NEA).
MSS currently operates a network of five manned observation stations, one upper air observatory and
around 80 automatic weather stations. All the automatic weather stations measure rainfall and more than
one-fifth of them measure other meteorological elements including temperature, relative humidity, pressure,
and wind. This observation network serves as the main source of climate data for this report.
The manned observation station at Changi is our designated climate
The Changi Climate Station station. The climate station, first located at Outram in 1869, has
undergone a number of relocations over the years due to changes in
local land use, before shifting to its current site at Changi. The climate
station serves as the reference station where its records are used for
tracking the national long-term climate trends. The oldest climate
station records are for monthly rainfall (starting from 1869) and
temperature (starting from 1929, with a break from 1942 to 1947).
The installation of the automatic weather station network from 2009 greatly expanded the coverage of
weather observations across Singapore. Prior to this, there were around 40 manual rainfall stations and
just a few temperature stations in Singapore. For the purpose of analysing long-term climate trends and
establishing climatological averages, only stations with continuous long-term (at least 30 years) records can
be used. This limits the number of stations available for such purpose to 28 stations for rainfall and three
stations for temperature.
Upper Air Observatory
Singapore is located deep within the tropics where wind and
atmospheric conditions evolve rapidly. The twice daily soundings
provide the main source of complete upper air information to
support operations. In addition to operational purposes, the
observation records from the station would also be useful for
monitoring of long-term upper air conditions in the equatorial
tropics, as the records extend back many decades to the 1950s.
Further Information
Meteorological Service Singapore : www.weather.gov.sg
Centre for Climate Research Singapore : ccrs.weather.gov.sg
Email enquiries : NEA_MSS_Engage@nea.gov.sgYou can also read


