Geochemical and Thermodinamic Modeling of Segara Anak Lake and the 2009 Eruption of Rinjani Volcano, Lombok, Indonesia
←
→
Page content transcription
If your browser does not render page correctly, please read the page content below
Jurnal Geologi Indonesia, Vol. 5 No. 4 Desember 2010: 227-239

         Geochemical and Thermodinamic Modeling of Segara Anak Lake
          and the 2009 Eruption of Rinjani Volcano, Lombok, Indonesia
                      A. Solikhin1, S. l. kunrAt1, A. BernArd2, B. BArBier2, and r. CAmpion2
              1
               Geological Agency, Center for Volcanology and Geological Hazard Mitigation, Indonesia
                                           Jln. Diponegoro 57, Bandung
                                     2
                                       Belgium Université Libre de Bruxelles,
                              Avenue Franklin Roosevelt 28, 1050 Bruxelles Belgium

                                                                      AbstrAct
            Rinjani is the second highest volcano in Indonesia with an elevation of 3726 m above sea level. The
       steep and highest cone of Rinjani consists mainly of loose pyroclastic ejecta and contains a crater with a
       few solfataras. The West of this cone is Segara Anak caldera. The western side of the caldera is occupied
       by a 230 m deep lake, covering an area of 11 km² and its volume was (before the 2009 eruption) estimated
       1.02 km3. This is probably the largest hot volcanic lake in the world.The lake water is neutral (pH: 7-8) and
       its chemistry dominated by chlorides and sulfates with a relatively high TDS (Total Dissolved Solids: 2640
       mg/l). This unusual TDS as well as the lake surface temperatures (20 - 22°C) well above ambient temperatures
       (14 - 15°C) for this altitude, reflect a strong input of hydrothermal fluids. Numerous hot springs are located
       along the shore at the foot of Barujari volcanic cone. Bathymetric profiles show also several areas with
       columns of gas bubbles escaping from the lake floor indicating a significant discharge of CO2 gas into the
       lake. The mass and energy balance model of Rinjani Crater Lake produce total heat lost value on the aver-
       age of 1700 MW. Most of the heating periods of the lake occurred when the heat released by the surface of
       the lake to the atmosphere was lower than the heat supplied from the hydrothermal system. Peaks of heat
       losses correspond to period of strong winds. Crater lake monitoring can provide a basic information about
       deep magmatic activity and surface processes that occur in the volcano. The monitoring also contributes to
       predict the next eruption in order to improve mitigation of volcanic eruption. Precursory signals of the May
       2009 eruption can be seen from significant changes in the temperature and chemistry of some of the hot
       springs, the increase of Fe concentrations in spring #54, chemical plume of low pH and dissolved oxygen,
       acidification of Segara Anak Lake, and increasing of lake surface temperatures. The new lava flow from
       May - August 2009 eruption covers an area of 650,000 m2. The shoreline was significantly modified by the
       entry of lava into Segara Anak Lake. The area of the lake is reduced by 460,000 m2.
       Keywords: geochemical, thermodinamic modeling, Segara Anak, Rinjani

                                                                          Sari
           Gunung Rinjani merupakan gunung api tertinggi kedua di Indonesia dengan ketinggian 3726 m di
       atas permukaan laut. Kerucut Rinjani yang tertinggi dan paling terjal terutama terdiri atas bahan lepas,
       mengandung sebuah kawah dengan beberapa tembusan solfatara. Di sebelah barat kerucut Rinjani ter-
       dapat kaldera Segara Anak. Sisi bagian barat kaldera ditempati oleh sebuah danau berkedalaman 230
       m dengan luas 11 km² dan diperkirakan volume danau (sebelum letusan tahun 2009) mencapai 1,02 km3.
       Ini mungkin merupakan danau vulkanik panas terbesar di dunia. Air danau bersifat netral (pH: 7 - 8)
       dan komposisi kimia airnya didominasi oleh klorida dan sulfat dengan TDS (Total Dissolved Solids: 2640
       mg/l) yang relatif tinggi. Nilai TDS serta suhu permukaan danau (20 - 22 °C) yang jauh di atas temperatur
       ruang (14 - 15 °C) yang tidak lazim untuk ketinggian ini, mencerminkan pasokan fluida hidrotermal yang
       besar. Sejumlah mata air panas terletak sepanjang tepian kaki kerucut Barujari. Profil batimetrik juga
       menunjukkan beberapa daerah dengan kolom gelembung gas yang keluar dari dasar danau dan menunjuk-
       kan pelepasan gas CO2 yang signifikan ke dalam danau. Model keseimbangan massa dan energi danau
       kawah Rinjani menghasilkan total kalor yang dilepaskan rata-rata sekitar 1700 MW. Sebagian besar
       masa pemanasan danau terjadi ketika panas yang dilepaskan oleh permukaan danau ke atmosfer lebih
Naskah diterima: 28 Juni 2010, revisi kesatu: 03 September 2010, revisi kedua: 18 Oktober 2010, revisi terakhir: 23 November 2010

                                                                           227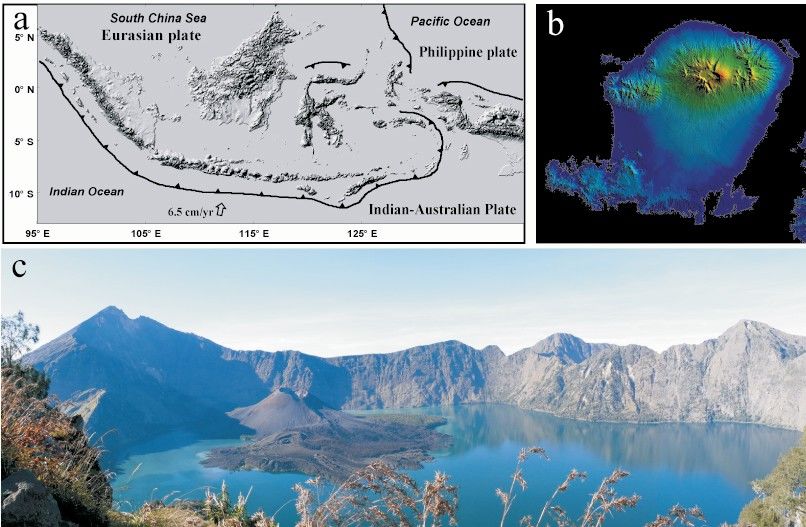
228 Jurnal Geologi Indonesia, Vol. 5 No. 4 Desember 2010: 227-239
rendah dari pada panas yang diberikan sistem hidrotermal. Nilai puncak kalor yang dilepaskan berkaitan
dengan waktu terjadinya angin kencang. Pemantauan danau kawah dapat memberikan informasi dasar
tentang aktivitas magmatik dalam dan proses permukaan yang terjadi di gunung api. Pemantauan ini
juga berguna untuk memperkirakan erupsi mendatang dalam rangka meningkatkan upaya mitigasi erupsi
gunungapi. Pertanda sebelum letusan Mei 2009 dapat dilihat dari perubahan signifikan dalam temperatur
dan komposisi kimia beberapa mata air panas, peningkatan konsentrasi Fe pada mata air panas #54, plum
kimia pH rendah dan oksigen terlarut, peningkatan keasaman air Danau Segara Anak, dan meningkatnya
suhu permukaan danau. Aliran lava baru hasil erupsi Mei - Agustus 2009 menutupi area seluas 650.000
m2. Garis tepi danau berubah secara signifikan akibat masuknya lava ke danau Segara Anak. Luas danau
berkurang sebesar 460.000 m2.
Kata kunci: geokimia, pemodelan termodinamik, Segara Anak, Rinjani
IntroductIon of the volcano. One of volcanoes with a crater lake
in Indonesia is Rinjani Volcano in Lombok Island,
Indonesia is one of countries in the world that West Nusa Tenggara (Figure 1).
has many active volcanoes and some of them have Crater lakes usually sit on top of volcanic con-
crater lakes. A volcano with a crater lake tends to duits, and act as condensers, traps, and calorimeters
be more disastrous than a volcano without volcanic for magmatic volatiles and heat. Variations in tem-
lake because there is a large amount of water that is perature and chemical composition of lake water
involved in it. If a volcanic eruption takes place at the could provide information of magma degassing
bottom of a crater lake, lahars often induced, result- and usually result from the interaction between
ing in extensive loss of life and property in the flanks magmatic volatiles and rocks that composed the
a b
5N
o South China Sea Pacific Ocean
Eurasian Plate
Philippine Plate
o
0N
o
5S
10 S
o
Indian Ocean 6.5 cm/yr Indian - Australian Plate
o
115 E
o o o
95 E 105 E 125 E
c
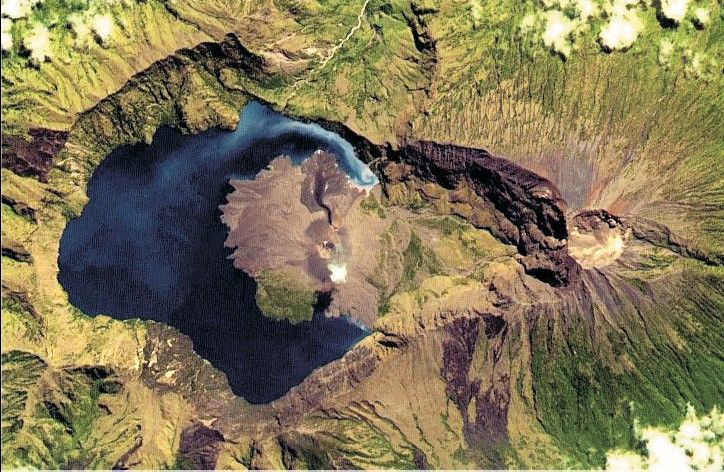
Figure 1. a. A sketch map showing the geodynamical setting of Indonesia; b. SRTM DEM image of Lombok Island, West
Nusa Tenggara; c. Photograph of Rinjani Volcano with Segara Anak Lake taken from Pelawangan Senaru.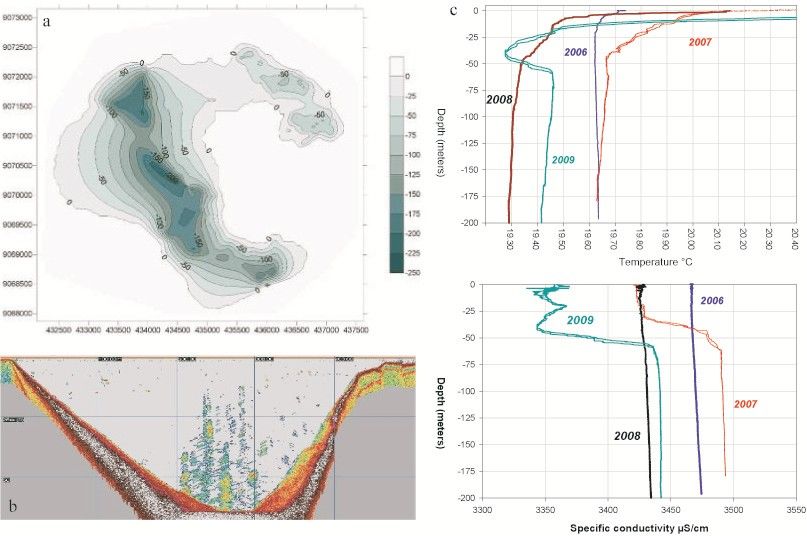
Geochemical and Thermodinamic Modeling of Segara Anak Lake and the 2009 Eruption                 229
                              of Rinjani Volcano, Lombok, Indonesia (A. Solikhin et al.)

conduits. Therefore, it is possible to obtain baseline          (conductivity, temperature and depth) measurement
information on both deep magmatic activity and                  on the lake using a Seabird Seacat 19plus. Water
shallow processes that are taking place at volcanoes            samples were analyzed using HPLC (High Per-
by monitoring the crater lakes. Such basic knowledge            formance Liquid Chromatography), AAS (Atomic
will certainly contribute to forecasting volcanic               absorption Spectroscopy) and Spectrophotometer
events (Kusakabe, 1996).                                        UV-VIS. It was conducted to determine geochemi-
    To reduce volcanic hazard and to set up the                 cal composition of the water. Vertical crater lake
measures for mitigation of this type of volcano, the            monitoring can be used to prevent the hazardous risk
study of characteristics of each kind of volcanic               of the lake, such as the release of huge amount of
lakes including the study about what goes beneath               carbon dioxide in Lake Nyos, Cameroon. The first
the volcano as well as to monitoring the activity of            thing we can know from vertical measurement in
the volcanoes need to be carried out.                           the lake by using CTD is stratification possibility of
                                                                the lake. If stratification occurs, some volcanic gases
                                                                such as CO2 or H2S may accumulate in the bottom
                    Methodology                                 of the lake and going off into the air when the lake
                                                                water circulates. The lake will be very dangerous if
    The geochemistry study in Segara Anak Lake                  it has long circulation period.
is based on 2006 to 2009 data and crater lake and                   The therrmodynamic study used Advanced
hot springs water sampling and analysis; and CTD                Spaceborne Thermal Emission and Reflection Radi-

                                             M = Mst/br + Mrm - Mev - Mos

                                                           Mev
                                       Mr

                                                             M
                                                                                      Mos
                              Mass
                             balance                      Mst/b
                                            E = Est/br - Eev - Esh - Era - Eos

                                                Esh         Eev
                                                                      Era

                                                           E
                                                                                      Eos
                               Energy
                               balance
                                                          Est/br
Figure 2. The diagram of mass and energy balance for a crater lake.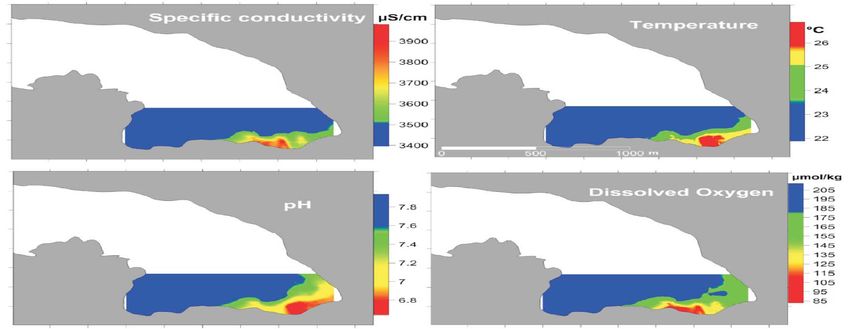
230                        Jurnal Geologi Indonesia, Vol. 5 No. 4 Desember 2010: 227-239

ometer (ASTER)-Thermal Infra-Red (TIR) images                   that the sources of melted magma is at about 165
on November 2000 – October 2005 period, and                     - 200 km depth (Hamilton, 1979). Van Bemmelen
thermal images were taken using a thermal camera.               (1949) described that the structure of the northern
With thermal images, it is possible to measure the              Lombok Island is a continuation of the Solo Zone
skin temperature of the volcanic lake and additional            in Java Island, which is formed the top of the gean-
data on other parameters can be used to to evalu-               ticline. The structure of Lombok Island in the Late
ate the changes in the heat supplied to the lake by             Tertiary or Early Quaternary consists of some faults
the hydrothermal using a mass and energy balance                with various orientations: SW-NE-, SSW-NNE- and
model (Figure 2) derived from Stevenson (1992).                 N-S- trending faults with possibility of active from
     The lake is considered as a totally separate               the Tertiary to Quaternary (Nasution, 1984).
system from the volcano as a whole, and a number                    Rinjani steep and highest cone consists mainly
of simplification are made. The main assumption                 of loose pyroclastic ejecta and contains a crater with
is that spot measurements of lake temperature and               few solfataras. The west area of this cone is Segara
chemical content are representative of the lake as a            Anak Caldera. The western side of the caldera was
whole, i.e., the lake is well mixed.                            occupied by a 230 m deep lake which covers an
     The mass inflows and outflows to and from the              area of 11 km² and its volume was estimated 1.02
lake, over the periods between lake measurements                km3 (before the 2009 eruption). This is probably
are considered. Mass is added to the lake by steam/             the largest hot volcanic lake in the world. Mount
brine (Mst/br), and rainfall/melt flow (Mrm ). Mass is          Barujari with a height of 2376 m above sea level
lost through evaporation from the surface of the lake           is in the east end of the caldera (Smithsonian; VSI;
(Mev), and seepage/overflow (Mos ). Each mass flow              Neumann Van Padang, 1951). The first historical
has an energy content or enthalpy, (H). Energy is               eruption of Rinjani occurred in September 1847, and
added to the lake solely by steam/brine, at rate Est/           since then the activity of Rinjani has been restricted
br
  , which is the product of mass flow of steam/brine            to Barujari cone. Barujari cone was formed by 1994,
and its enthalpy (E st/br = M st/br . Hst/br). Energy is lost   1995, and 1996 eruption. The 2004 eruption was
from the lake by evaporation at the lake surface at             located on the north-west flank of Mt. Barujari.
the rate Eev (Eev = Mev . Hev ). The overflow/seepage           The most recent eruption occurred in May – August
of hot lake water also result in an energy loss Eos (Eos        2009, its activity is characterized by mild eruptions
= Mos . Hos). Additional energy losses from the lake            that produced a small lava flow and low altitude
surface, which is not associated with mass flows, are           ash-poor gas plumes.
sensible heat (Esh) and radiation (Era). Sensible heat
loss is due to conductive heat transfer from hot lake
water to cold air. The air heats up and becomes lighter                           geocheMIstry
than overlying colder air, leading to convection.
     Comparison between background data and                         Rinjani volcanic lake (Segara Anak Lake) is a
investigation data before 2009 eruption, also data              neutral (pH: 6 - 8) volcanic lake with several hot
on eruption period will be used to analyze the pre-             springs located around Barujari. The lake geochem-
cursory signal of May 2009 eruption and to explain              istry with significant concentrations of hydrothermal
May – August 2009 eruptive activity.                            elements such as chloride, sodium, potassium and
                                                                sulfate confirms this hydrothermal influence and
                                                                relatively high TDS (Total Dissolved Solids: 2640
                 geologIcAl settIng                             mg/l). There is a linear correlation between sodium
                                                                and chloride, and between magnesium and sulfate,
    Rinjani is the second highest volcano in Indo-              but there is no linear correlation between sulfate
nesia with an elevation of 3726 m above sea level               and chloride (Figure 3). This tends to suggest that
located in Lombok Island. Rinjani is one of the series          the lake water is a mixture between two different
of volcanoes built in the Lesser Sunda Islands due to           sources of water.
the subduction of Indo-Australian oceanic crust be-                 The first water source input of Rinjani volcanic
neath the Lesser Sunda Islands, and it is interpreted           lake is a hydrothermal system. The hydrothermal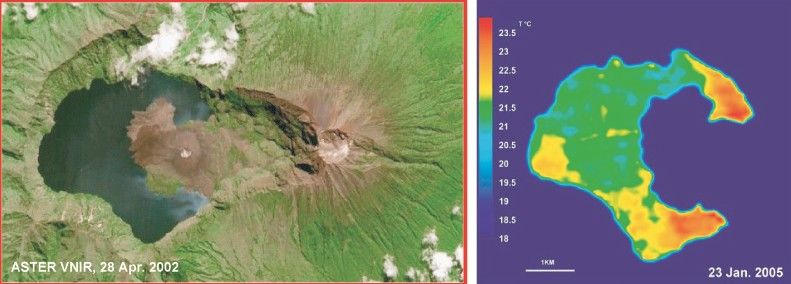
Geochemical and Thermodinamic Modeling of Segara Anak Lake and the 2009 Eruption                                                             231
                              of Rinjani Volcano, Lombok, Indonesia (A. Solikhin et al.)

                                      Na-Cl                                                                    Mg-SO4
     600                                                                                                                                     300

                                                                                                                                             250
     500
                                                                                                                                             200

                                                                                                                                                   Mg(mg/l)
     400                                                                                                                                     150

                                                                                                                                             100
     300
                                                                                                                                             50

     200                                                                                                                                      0
        200         300                 400             500          600        400      600          800    1000     1200   1400   1600   1800

                                      Cl (mg/l)                                                                SO4 (mg/l)

                                                                           SO4 - Cl
                                        700

                                       600

                                       500
                          Cl (mg/l)

                                       400

                                       300

                                        200
                                                  600         800   1000          1200         1400         1600

                                                                      SO4 (mg/l)

Figure 3. The evolution of sodium vs. chloride, magnesium vs. sulfate, and sulfate vs. chloride.

fluid is typical of deep neutral chloride waters. An-                            leaching of sulfate minerals under the ground, not
other source is meteoric water enriched with sulfate.                            from a magmatic contribution. This assumption is
The sulfate is not coming from steam-heated waters                               based on the similarity of sulfur isotopic composition
but probably coming from dissolution of sulfate                                  in the lake and in the hot springs.
minerals underneath the volcanic lake.                                               The maximum depth of Rinjani volcanic lake
    Geochemical composition of the lake shows                                    is 230 m (Figure 4a). Input of magmatic gases is
the same trends as hot springs, so does the isotopic                             extruding around Barujari cone area (Figure 4b)
compositions. The isotopic compositions of deute-                                but the gases will not accumulate in the bottom
rium, oxygen, and sulfur of the lake show almost the                             and harm the people visiting the area because the
same values as the hot springs (Table 1). The lake                               lake is well mixed. The mixing (circulation) of lake
and hot springs waters are assumed to come from                                  water happen when density in the surface is higher
the same source.                                                                 than in the bottom. The surface water with higher
    There are hydrothermal and meteoric waters                                   density will force water layer in the bottom to move
input coming to the lake. The difference in water                                upward and the surface layer will go to the bottom.
density inside the lake makes the lake to convect.                               This circulation process happens continuously and
The enrichment in sulfate is probably due to the                                 the lake water becomes well mixed.
232                       Jurnal Geologi Indonesia, Vol. 5 No. 4 Desember 2010: 227-239

Table 1. Isotopic compositions (‰) of Rinjani Volcanic Lake and hot Springs

                                   Date          Number          t°C     pH    δ18O      δD       δ34S

           Lake                 8/11/2004       SA04_LAC         20     7.80   -3.0     -32.0      -
                                7/5/2005         SA05_lac         -     7.79     -        -      12.00
           North of              7/6/2005       SA05_SP03         -     6.56   -2.8     -33.0    13.40
           Barujari
           South of             7/7/2005        SA05_SP05         -     7.00     -         -     12.30
           Barujari             8/10/2004       SA04_SP05         -     6.44     -         -       -
           Northwest            8/11/2004       SA04_SP11        30     6.46   -3.2     -32.0       -
           of Barujari          8/11/2004       SA04_SP13        34     6.98   -3.1     -33.0       -
                                7/7/2005        SA05_SP10         -     7.13   -3.3     -33.0       -

           Outlet of the
                                8/11/2004       SA04_SP06        57     6.63   -2.9     -33.0    12.20
           Segara Anak
           Rain water           8/11/2004       SA04_SP07         -       -    -9.7     -62.0       -

    Based on CTD measurements since 2006, it is               that the hot springs are located on the lake shore,
known that the water of Rinjani volcanic lake is              then thermal flumes from numerous hot spring to the
well mixed (Figures 4c), even though there is small           lake carrying chemical precipitates of Fe hydroxides.
stratification observed in 2007 and 2009 compared                 Rinjani Crater Lake has a very large size and
to 2006 and 2008 measurements. CTD profiles                   the water temperature is nearly the same as the air
show that there is only a small stratification above          temperature, the skin temperature varies with the air
30 meters deeph. This stratification is due to solar          temperature. In the day, time skin temperature is hot-
heating and wind effects. The small difference in the         ter than temperature at the depth (bulk temperature)
conductivity of the lake waters between the surface           and in the night time skin temperature is colder than
and the bottom of the lake tells us that the lake is          temperature at the depth.
well mixed with short circulation period. In 2007,                The temperature of the lake water taken from
conductivity and temperature were more stratified             the ASTER thermal image (AST04 Brightness Tem-
than in 2006 and 2008. However, the stratification            perature Product) for each and calculated using the
difference is very small and the lake water is still          split-window method is shown in Figure 6a. In that
well mixed. The cause of the anomaly is probably              figure, temperature data of lake water were compared
the climate change.                                           with approximated atmospheric temperature data
    During the monitoring period from 2006 until              from weather archive at http://meteo.infospace.ru.
2008, both temperature and conductivity of the lake           Those data were taken from the weather station at
decreased, which could be interpreted as a slight             Semarang City, Central Java, with latitude at 6°59’
decrease in the hydrothermal activity with time.              S and altitude is 3 meter above sea level. Thus, those
In addition, in 2009 there was small increase in              temperature data were converted with the altitude to
temperature and conductivity due to the increase of           be approximated atmospheric temperature data for
magmatic activity of Barujari.                                the Rinjani Crater Lake.
                                                                  For period November 2000 – October 2005, the
                                                              lake water temperature data show a fluctuation, with
            MAss And energy bAlAnce                           a tendency to increase. The average value of the
                                                              lake temperature is 21.2°C, maximum temperature
  Figure 5a shows ASTER VNIR image of Segara                  is 22.7°C, and minimum temperature is 19.3°C.
Anak Lake (Rinjani Crater Lake) and Temperature               Lake water temperature pattern and atmospheric
maps are shown in Figure 5b. Those images show                temperature pattern are nearly similar. This is ex-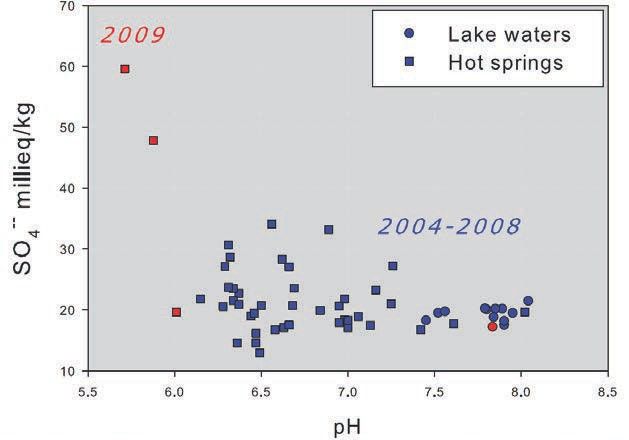
Geochemical and Thermodinamic Modeling of Segara Anak Lake and the 2009 Eruption 233
of Rinjani Volcano, Lombok, Indonesia (A. Solikhin et al.)
0
9073000
C
-25
9072500
2007
2006
-50
9072000 0
-75
-25 2008
9071500
Depth (m)
-50 -100
9071000 -75
-125
-100
9070500
2009
-150
-125
9070000 -150 -175
-175
9069500 -200
19.50
19.40
19.30
19.60
19.90
19.70
-200
19.80
20.00
20.10
20.20
20.30
20.40
9069000 -225
Temperature o C
-250
9068500 0
2006
9068000 -25
2009
432500 433000 433500 434000 434500 435000 435500 436000 436500 437000
-50
-75
Depth (m) -100
2007
-125
2008
-150
-175
-200
3300 3350 3400 3450 3500 3550
Specific conductivity ( S/cm)
Figure 4. a. Bathymetric map of Rinjani Volcanic Lake (Segara Anak); b. CO2 bubbles in Segara Anak Lake were recorded
by echo sounding; c. Evolution of depth vs. temperature and depth vs. conductivity of Rinjani Volcanic Lakes during the
monitoring period from 2006 until 2009.
o
T C
23.5
23
22.5
22
21.5
21
20.5
20
19.5
19
13.5
13
1 km
23 Jan. 2005
Figure 5. a. ASTER VNIR Satellite Image of Rinjani Volcano ; b. Temperature maps of Segara Anak Lake based on AST04
TIR and split window algorithm.234 Jurnal Geologi Indonesia, Vol. 5 No. 4 Desember 2010: 227-239
plaining that the fluctuation of the lake temperature and chemistry of some of the hot springs were
was more caused by the atmospheric effect including observed. An increase in temperature and acidity
seasonal effect and the different of temperature at of two hot springs (#53 and 54) was recorded (see
night and day time. Table 2, Figures 7). This increasing acidity was
Calculation of the energy losses from crater lake confirmed later in the lab as the consequence of
used the heat and mass balance model derived from an increase in the sulfates to values that were
Stevenson (1992). This calculation used approxi- never observed before (since 2004). For the
mated weather data and a constant wind velocity. neutral hydrothermal system of Rinjani Volcano,
The Rinjani Crater Lake has a large area and losses the increase in acidity was interpreted as the con-
a lot of thermal energy. Each time, lake temperature sequence of an increase in the magmatic (SO2)
increases/decreases 1°C, whilst other parameters are degassing at depth.
constant. The lake will lose/receive the heat around • Fe concentrations in spring #54 usually below
350 MWatt. Total energy lost from the lake shown detection limits peaked at 120 mg/l. This change
on Figure 6b, for period November 2000 - October in chemistry produced a spectacular coloration
2005, gave the average of 1775 Mwatt. 2004- erup- of the lake waters that became yellowish-brown
tion of the Rinjani Volcano occurred on 1 October. because of the precipitation of ferric hydroxide
Although there is no lake temperature data that time, Fe(OH)3.
the graph on Figure 6a shows the increase of total • A chemical plume of low pH and dissolved oxygen
energy loss, which is related with the heat inflow by were clearly observed at the lake surface with an
the hydrothermal system. extension of several hundred meters away from
the hot spring.
• pH profiles as a function of depth (Figure 8) re-
2009 eruptIon corded at several locations also showed a clear
acidification of the Segara Anak Lake especially
Based on background data and the measurement at shallow depths (15-20 meters).
before eruption, the precursory signals of the May • Lake surface temperatures increased slightly from
2009 eruption can be summarized as follows: 20°C in July 2008 to 22°C in Early April 2009
• During a fieldwork carried out in April 10-14, (Figure 9). Most if not all of this heating can
2009, significant changes in the temperature attribute to meteorological effects, i.e reducing
Temperature Data of Rinjani Crater Lake Total Energy Lost of Rinjani Crater Lake
24 2200
a b
22
2000
20
1800
18
16 1600
Temperature (°C)
Ene rgy (MWa tt)
14
1400
Lake Temperature in the night (°C)
Lake Temperature in the day (°C)
12 Atmospheric Temperature in the night (°C) (Approximated)
Atmospheric Temperature in the day (°C) (Approximated)
1200
08-00 02-01 08-01 02-02 08-02 02-03 08-03 02-04 08-04 02-05 08-05
08-00 02-01 08-01 02-02 08-02 02-03 08-03 02-04 08-04 02-05 08-05
Time Time
Figure 6. a. Temperatures of the lake water were taken from the ASTER thermal image (AST04 Brightness Temperature
Product) for each and calculated using the split-window method compared with the approximated atmospheric temperature;
b. Total energy loss from the lake was measured using mass and energy balance.Geochemical and Thermodinamic Modeling of Segara Anak Lake and the 2009 Eruption 235
of Rinjani Volcano, Lombok, Indonesia (A. Solikhin et al.)
Table 2. Geochemistry of Segara Anak Lake and hot Springs (NA: not analyzed)
Date Location T oC pH SO 4 CI HCO 3 Ca Fe K Mg Mn Na Si B Li
10-Jul-08 Lake_surface 19.9 7.90 843 351 535 120236 Jurnal Geologi Indonesia, Vol. 5 No. 4 Desember 2010: 227-239
70
Lake water (2004 -2008)
2009 Lake water (2009)
60
Hot springs (2004 - 2008)
SO4 - millieq/kg Hot springs (2009)
50
40
2004 - 2008
30
20
10
5.5 6.0 6.5 7.0 7.5 8.0 8.5
pH
Figure 8. pH profiles as a function of depth recorded at several locations also show a clear acidification of the Segara Anak
Lake especially at shallow depths.
120000 23
100000 22
8000 21
MW
6000 20
Temperature C
o
net
4000
E
19
E
net > 0 = Heat loss
20000 18
0 17
Heat gain
-2000 16
Aug/08 Oct/08 Dec/08 Feb/09 Apr/09
Figure 9. Heat budget of the Segara Anak Lake. Most of the heating periods of the lake occurred when the heat released by
the surface of the lake to the atmosphere was lower than the heat supplied from the hydrothermal system (ΔEnetGeochemical and Thermodinamic Modeling of Segara Anak Lake and the 2009 Eruption 237
of Rinjani Volcano, Lombok, Indonesia (A. Solikhin et al.)
evaporation at the lake surface because of low- at height238 Jurnal Geologi Indonesia, Vol. 5 No. 4 Desember 2010: 227-239
Figure 11. ASTER false natural colour from 21 August 21 2009 at 02:35 UT. The new lava covers an area of 650,000m2 and
changed significantly the shoreline. The lake area is reduced by 460,000m2. Inside box show the previous shoreline and the
new lava in red. The shoreline before the eruption is in blackand the new lava is in red.
conclusIons to the atmosphere was lower than heat supplied by
the hydrothermal system. Peaks of heat losses cor-
A crater lake monitoring can provide basic in- respond to period of strong winds.
formation about deep magmatic activies and surface Precursory signals of the May 2009 eruption can
processes that occur in a volcano. The monitoring be seen from significant changes in the temperature
also contributes to predict the next eruption in order and chemistry of some of the hot springs, increasing
to improve the mitigation of volcanic eruption. Basic of Fe concentrations in spring #54, chemical plume
information obtained by studying the hydrothermal of low pH and dissolved oxygen, acidification of the
system of each volcano and its crater lake is one of the Segara Anak Lake, and increasing of lake surface
representative media in hydrothermal system studies. temperatures.
The Rinjani Crater Lake gets hydrothermal in-
puts with the type of deep neutral chloride waters. Acknowledgement---This work is a research collaboration
between Center for Volcanology and Geological Hazard Miti-
The crater lake water is well mixed and has a short gation (CVGHM), Geological Agency, Ministry of Energy
circulation period. CTD measurements conducted and Mineral Resources, Indonesia and Universite Libre de
since 2006 to 2009 indicate increases in activity in Bruxelles (UBL), Belgium with supports from Commission
the crater lake. Universitaire pour le Development (CUD). The autors thank
The application of mass and energy balance Devy Kamil Syahbana (CVGHM), Courentin Coudroun
(UBL), Prof. Vincent Halet and David Le Madec (Faculte
model to the Rinjani Crater Lake gives estimated
Universitare Notre Dame de la Paix, Namur, Belgium),
heat lost value at the average of about 1775 MW. partners and friends for their help and support, as well as
Most of the heating periods of the lake occurred the observers of Rinjani Volcano in Sembalun, Lombok, Mr.
when the heat released by the surface of the lake Mutaharlin and Mr. Zulkarnaen for field assistance.Geochemical and Thermodinamic Modeling of Segara Anak Lake and the 2009 Eruption 239
of Rinjani Volcano, Lombok, Indonesia (A. Solikhin et al.)
references Smithsonian Institution – Global Volcanism Program, June
2009, BGVN, 34 (6).
Hamilton, W.B., 1979. Tectonics of the Indonesian region. Stevenson, D.S., 1992. Heat transfer in active volcanoes:
USGS Professional Paper 1078, p.345. models of crater lake systems. Ph.D Thesis, The Open
http://www.volcano.si.edu/world/volcano University, 235p.
http://www.vsi.esdm.go.id Van Bemmelen, R.W., 1949, The geology of Indonesia and
Kusakabe, M., 1996. Hazardous crater lakes.In: Scarpa, R. adjacent archipelago. The Hague, Government Printing
and Tilling, R.I., (Eds.), Monitoring and Mitigation of Office, p.1-50.
Volcano Hazards, Springer, Berlin, p.573-598. Van Padang, N.M., 1951. Rinjani. Catalogue of the
Nasution, A., 1984. Geologi panas bumi daerah Sembalun, active volcanoes of the world including solfatara
Lombok Timur, Nusa Tenggara Barat. Sub Direktorat fields. Technische Hogeschool te Delft Instituut voor
Panas Bumi, Direktorat Vulkanologi. Mijnbouwkunde Geologie: Part I.You can also read