CAPITALAND MALL TRUST - Citi-REITAS-SGX C-Suite Singapore REITS and Sponsors Forum 26 August 2020
←
→
Page content transcription
If your browser does not render page correctly, please read the page content below
CAPITALAND MALL TRUST
Citi-REITAS-SGX C-Suite Singapore REITS and Sponsors Forum
26 August 2020
Disclaimer
This presentation may contain forward-looking statements. Actual future performance, outcomes and results may differ materially from those
expressed in forward-looking statements as a result of a number of risks, uncertainties and assumptions. Representative examples of these factors
include (without limitation) general industry and economic conditions, interest rate trends, cost of capital and capital availability, availability of real
estate properties, competition from other developments or companies, shifts in customer demands, shifts in expected levels of occupancy rate,
property rental income, charge out collections, changes in operating expenses (including employee wages, benefits and training, property
operating expenses), governmental and public policy changes and the continued availability of financing in the amounts and the terms necessary
to support future business.

You are cautioned not to place undue reliance on these forward-looking statements, which are based on the current view of management
regarding future events. No representation or warranty expressed or implied is made as to, and no reliance should be placed on, the fairness,
accuracy, completeness or correctness of the information or opinions contained in this presentation. Neither CapitaLand Mall Trust Management
Limited (“Manager”) nor any of its affiliates, advisers or representatives shall have any liability whatsoever (in negligence or otherwise) for any loss
howsoever arising, whether directly or indirectly, from any use, reliance or distribution of this presentation or its contents or otherwise arising in
connection with this presentation.

The past performance of CapitaLand Mall Trust (“CMT”) is not indicative of future performance. The listing of [the units in the CMT (“Units”) on the
Singapore Exchange Securities Trading Limited (the “SGX-ST”) does not guarantee a liquid market for the Units. The value of the Units and the income
derived from them may fall as well as rise. Units are not obligations of, deposits in, or guaranteed by, the Manager or any of its affiliates. An
investment in the Units is subject to investment risks, including the possible loss of the principal amount invested. Investors have no right to request
that the Manager redeem or purchase their Units while the Units are listed on the SGX-ST. It is intended that holders of Units may only deal in their
Units through trading on the SGX-ST.

This presentation is for information only and does not constitute an invitation or offer to acquire, purchase or subscribe for the Units.

                                                                                                                                                              2
                                                      Citi-REITAS-SGX C-Suite Singapore REITS and Sponsors Forum *Aug 2020*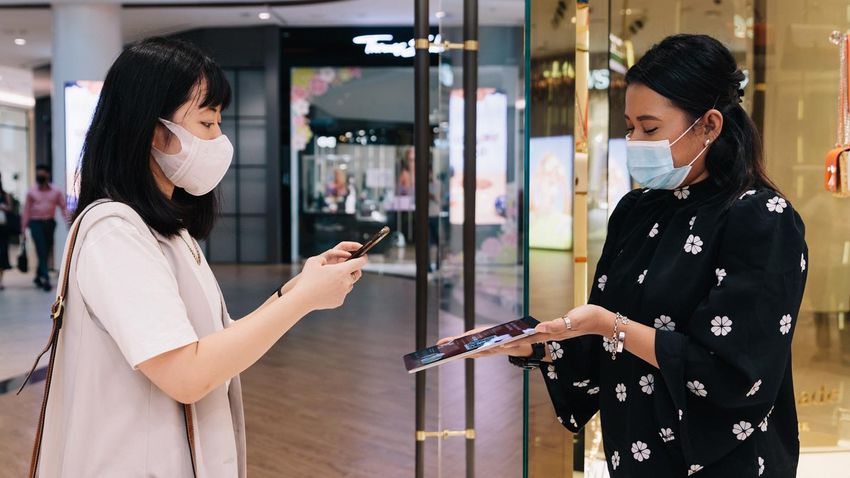
Contents
 •   1H 2020 Overview and Key Financial Highlights

 •   Portfolio Updates

 •   Going Forward

                                                                                                 3
                         Citi-REITAS-SGX C-Suite Singapore REITS and Sponsors Forum *Aug 2020*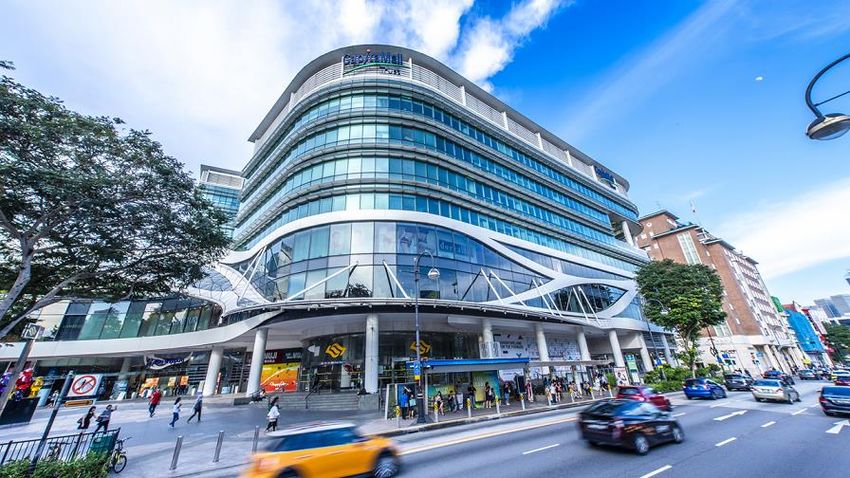
1H 2020 Overview
and
Key Financial
Highlights

                   Plaza Singapura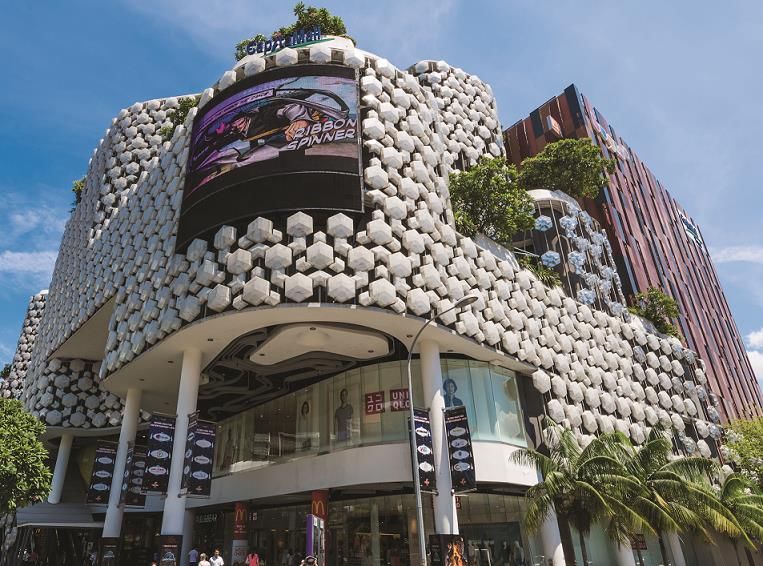
1H 2020 overview

                0.1%                               40.6%                                  15.4%          97.7%
 Operational                                           Y-o-Y                                   Y-o-Y   as at end-Jun 2020
 Performance

                Rental                             Shopper                            Tenants’ Sales      Portfolio
               Reversion                            Traffic                          Per Square Foot   Occupancy Rate

                                                                                                                            5
                           Citi-REITAS-SGX C-Suite Singapore REITS and Sponsors Forum *Aug 2020*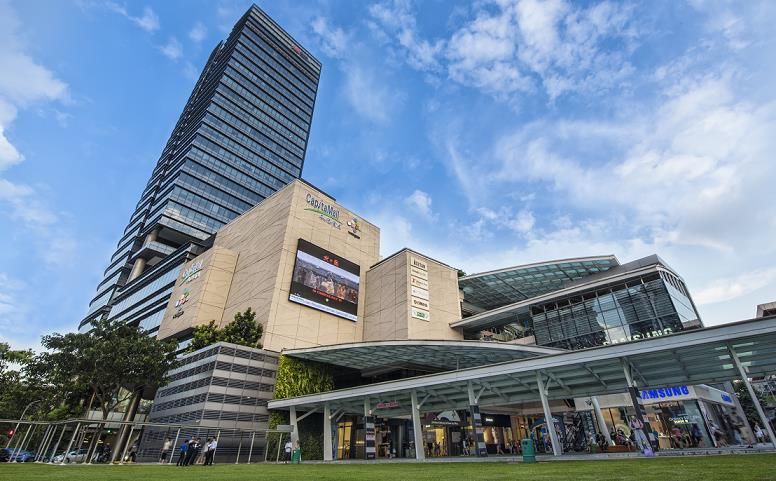
1H 2020 overview
                                 •   Phase Two reopening highlights
                                     -   Operationally, safe management measures have continued to pose challenges
                                     -   For the period 19 June to 5 July 2020, most tenants have resumed operations and average shopper traffic has
                                         recovered to 53% of the level a year ago; suburban malls continue to outperform downtown malls
                                     -   With further relaxation of measures on certain businesses from 13 July 2020, more tenants have received the
                                         permission to operate
                                     -   Tenants’ sales gaining momentum amidst cautious consumer sentiment a positive sign

                                 •   Prioritising tenant support
                                     -   A S$154.5 million rental relief package comprising rental waivers from CMT, property tax rebates and cash grants
                                     -   Waiver of turnover rent
   Operational                       -   Release of one-month security deposits to offset rents
    Update                           -   Rental relief for qualifying small and medium enterprises tenants in accordance with the COVID-19 (Temporary
                                         Measures) (Amendment) Act 2020 and other legislations(1)

                                 •   Staying vigilant and deepening stakeholder engagement
                                     -   Progressively introducing innovative tech solutions to enhance COVID-19 safety measures at our malls since June
                                         2020
                                     -   Maintaining regular and constructive communications with tenants
                                     -   Exploring alternative leasing strategies to adapt to the new operating environment and sustain healthy occupancy
                                         levels
                                     -   Augmenting retailers’ omnichannel strategy with new digital platforms – eCapitaMall and Capita3eats extend
                                         consumer outreach and increase online business opportunities

(1) In accordance with the COVID-19 (Temporary Measures) (Amendment) Act 2020 (the “Act”) and subject to notification by the Inland Revenue Authority of Singapore as to the eligibility of such
    tenants, as well as fulfillment of such other criteria as may be prescribed under the Act.                                                                                                     6
                                                             Citi-REITAS-SGX C-Suite Singapore REITS and Sponsors Forum *Aug 2020*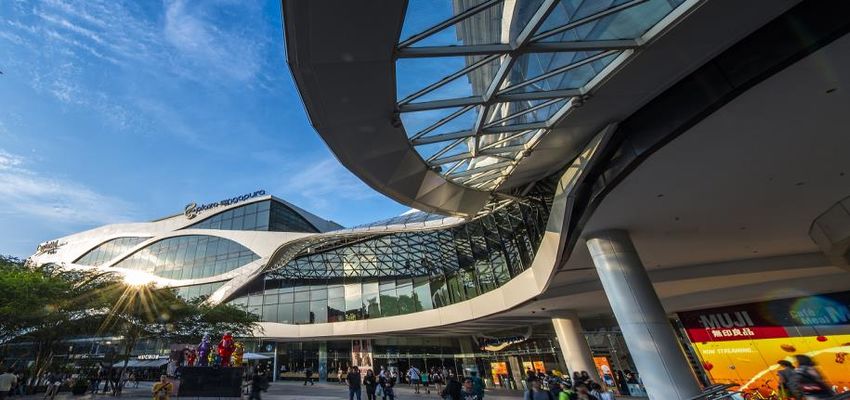
1H 2020 DPU at 2.96 cents
     1H 2020 DPU would be 4.35 cents if retained income(1) is released
                                                                                                                                                      Distributable Income (S$ mil)

                                                                                                                                                                                           214.0 (3)
     Distributable Income                                        Distribution Per Unit (DPU)
                                                                                                                                                    109.7 (2)

        S$109.7                                                       2.96
                                       (2)
                                                                                                                                                  1H 2020                                1H 2019

        million                                                       cents                                                                                       DPU (cents)
                                                                                                                                                                                            5.80

               48.7% Y-o-Y                                                    49.0% Y-o-Y
                                                                                                                                                      2.96

                                                                                                                                                   1H 2020                                1H 2019
(1) Taxable income retained comprises S$46.4 million from CMT and S$5.0 million (CMT's 40.0% interest) from RCS Trust.
(2) For 1H 2020, in view of the challenging operating environment due to COVID-19 pandemic, CMT had retained S$46.4 million of its taxable income available for distribution to Unitholders. In
    addition, capital distribution of S$4.8 million for the period from 14 August 2019 to 31 December 2019 received from CapitaLand Retail China Trust (CRCT) in 1Q 2020 had been retained for general
    corporate and working capital purposes.
(3) In 1H 2019, CMT had retained S$9.2 million of its taxable income available for distribution to Unitholders for distribution in FY 2019. Capital distribution and tax-exempt income distribution of S$5.9
    million received from CRCT in 1Q 2019 had also been retained for general corporate and working capital purposes.
                                                                                                                                                                                                               7
                                                                    Citi-REITAS-SGX C-Suite Singapore REITS and Sponsors Forum *Aug 2020*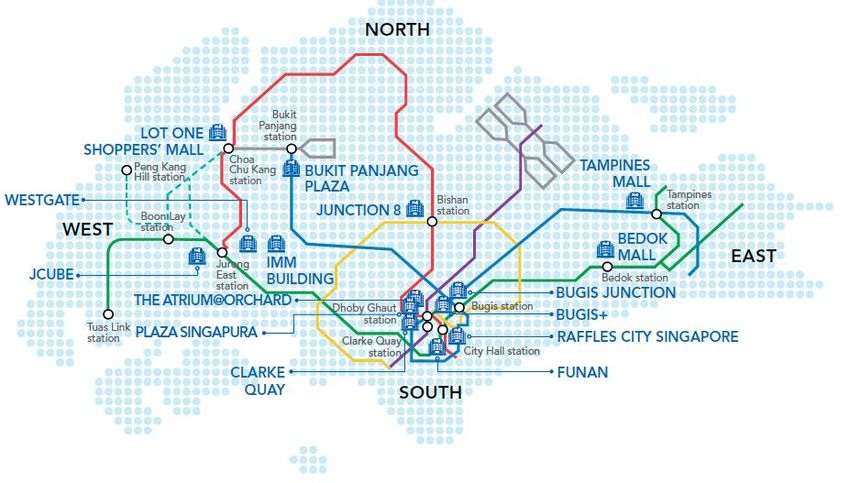
1H 2020 financial performance
       Gross Revenue                                                     Net Property Income                                               Distributable Income

          S$318.4                                                             S$216.4                                                            S$109.7                 (1)

          million                                                             million                                                            million
                16.7% Y-o-Y                                                         20.8% Y-o-Y                                                        48.7% Y-o-Y
 S$ million                                                                                                                                                   1H 2020          1H 2019

                                        382.3

               318.4
                                                                                                        273.3
                                                                                                                                                                                (2)
                                                                                216.4                                                                                   214.0

                                                                                                                                                109.7 (1)

                     Gross Revenue                                               Net Property Income                                             Distributable Income

(1) For 1H 2020, in view of the challenging operating environment due to COVID-19 pandemic, CMT had retained S$46.4 million of its taxable income available for distribution to Unitholders.
    In addition, capital distribution of S$4.8 million for the period from 14 August 2019 to 31 December 2019 received from CRCT in 1Q 2020 had been retained for general corporate and
    working capital purposes.
(2) In 1H 2019, CMT had retained S$9.2 million of its taxable income available for distribution to Unitholders for distribution in FY 2019. Capital distribution and tax-exempt income distribution of
    S$5.9 million received from CRCT in 1Q 2019 had also been retained for general corporate and working capital purposes.
                                                                                                                                                                                                         8
                                                               Citi-REITAS-SGX C-Suite Singapore REITS and Sponsors Forum *Aug 2020*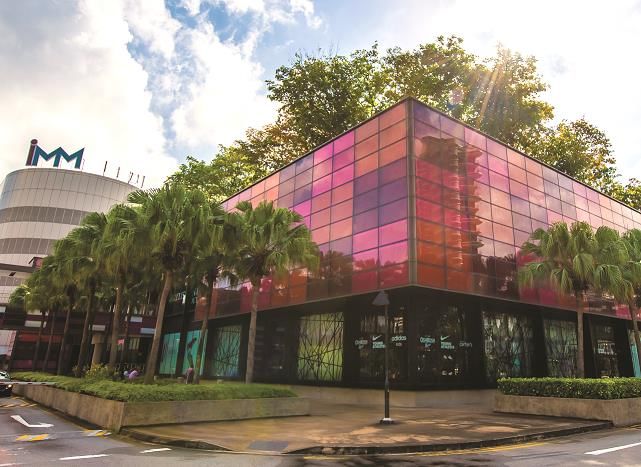
Debt maturity profile(1) as at 30 June 2020
Bank facilities in place for refinancing of debt due in 2020
687.7
700 660.0
(2) (2)
40.0
120.0
600 60.0
(2)
547.1
484.0 97.7 (2)
500 110.0 80.0
(2)
S$ million
72.0
(2) 399.0
130.0 110.0
400
100.0
(8) 292.8
300 300.0 98.8
191.7 100.0
226.0 (2) 100.0
350.0 1.6 100.0
(12)
200 100.0
(6)
407.1
100.0 150.0 (10)
99.0
(5) (11)
100 190.1 192.8
126.0
(3)
140.0
(7)
150.0 (9) 150.0 Total
108.3 100.0
62.0
(4)
25.5%
0
2020 2021 2022 2023 2024 2025 2026 2027 2028 2029 2030 2031
Unsecured Bank Loans - 40.0% interest in RCS Trust Notes issued under RCS Trust EMTN Programme (Unsecured) - 40.0% interest in RCS Trust
Unsecured Bank Loans Retail Bonds due 2021 at fixed rate of 3.08% p.a. (Unsecured)
Notes issued under Multicurrency Medium Term Note ('MTN') Programme (Unsecured) Notes issued under Euro-Medium Term Note ('EMTN') Programme (Unsecured)
(1) Includes CMT’s share of borrowings in RCS Trust (40.0%). (7) HK$885.0 million 3.28% fixed rate notes ('EMTN Series 5') were swapped to S$140.0 million at a fixed rate of 3.32%
(2) S$1.209 billion unsecured bank loans and notes by RCS Trust. CMT’s 40.0% share thereof is p.a. in November 2012.
S$483.6 million. (8) HK$555.0 million 3.836% fixed rate notes (‘MTN Series 24’) were swapped to S$98.8 million at a fixed rate of 3.248%
(3) ¥10.0 billion 1.039% fixed rate notes ('MTN Series 10') were swapped to S$126.0 million at a fixed rate of p.a. in November 2018.
3.119% p.a. in November 2013. (9) HK$650.0 million 3.25% fixed rate notes ('MTN Series 14') were swapped to S$108.3 million at a fixed rate of 3.25%
(4) ¥5.0 billion floating rate (at 3 months JPY LIBOR + 0.48% p.a.) notes ('MTN Series 12') were swapped to p.a. in November 2014.
S$62.0 million at a fixed rate of 3.148% p.a. in February 2014. (10) HK$560.0 million 2.71% fixed rate notes (‘MTN Series 18’) were swapped to S$99.0 million at a fixed rate of 2.928%
(5) HK$1.15 billion 3.76% fixed rate notes ('EMTN Series 3') were swapped to S$190.1 million at a fixed rate p.a. in July 2016.
of 3.45% p.a. in June 2012. (11) HK$1.104 billion 2.77% fixed rate notes ('MTN Series 15') were swapped to S$192.8 million at a fixed rate of 3.25%
(6) ¥8.6 billion floating rate (at 3 months JPY LIBOR + 0.25% p.a.) notes ('MTN Series 16') were swapped to p.a. in February 2015.
S$100.0 million at a fixed rate of 2.85% p.a. in February 2015. (12) US$300.0 million 3.609% fixed rate notes ('MTN Series 26') were swapped to S$407.1 million at a fixed rate of 3.223%
p.a. in April 2019.
9
Citi-REITAS-SGX C-Suite Singapore REITS and Sponsors Forum *Aug 2020*
Key financial indicators
                                                                                                             As at                                       As at
                                                                                                         30 June 2020                                31 March 2020

Unencumbered Assets as % of Total Assets                                                                       100.0%                                       100.0%
Aggregate Leverage(1)                                                                                           34.4%                                        33.3%
Net Debt / EBITDA(2)                                                                                             7.1x                                          6.4x
Interest Coverage(3)                                                                                             4.3x                                          4.6x
Average Term to Maturity (years)                                                                                  4.5                                          4.7
Average Cost of Debt(4)                                                                                          3.1%                                         3.2%
CMT’s Issuer Rating(5)                                                                                           ‘A2’

(1) In accordance with Property Funds Appendix, CMT’s proportionate share of its joint ventures’ borrowings and deposited property values are included when computing aggregate
    leverage. Correspondingly, the ratio of total gross borrowings to total net assets is 54.6%.
(2) Net Debt comprises Gross Debt less temporary cash intended for refinancing and capital expenditure and EBITDA refers to earnings of CMT Group, before interest, tax,
    depreciation and amortisation (excluding effects of any fair value changes of derivatives and investment properties, foreign exchange translation and non-operational gain/loss),
    on a trailing 12-month basis.
(3) Ratio of earnings of CMT Group, before interest, tax, depreciation and amortisation (excluding effects of any fair value changes of derivatives and investment properties, foreign
    exchange translation and non-operational gain/loss) over interest expense and borrowing-related costs, on a trailing 12-month basis.
(4) Ratio of interest expense over weighted average borrowings.
(5) Moody’s Investors Service has placed on review for downgrade the ‘A2’ issuer rating of CMT on 24 January 2020.

                                                                                                                                                                                         10
                                                        Citi-REITAS-SGX C-Suite Singapore REITS and Sponsors Forum *Aug 2020*
Valuations and valuations cap rates
Valuation Valuation Variance Valuation Cap Rate
as at 30 Jun 20 as at 31 Dec 19 as at 30 Jun 20 as at 30 Jun 20 and 31 Dec 19
S$ million S$ million S$ million S$ per sq ft NLA %
Tampines Mall 1,072.0 1,085.0 (13.0) 3,009 4.70
Junction 8 794.0 799.0 (5.0) 3,125 4.70
Retail: 4.85
Funan(1) 742.0 775.0 (33.0) 1,396
Office: 3.90
Retail: 6.20
IMM Building 660.0 675.0 (15.0) 685(2)
Warehouse: 7.00
Plaza Singapura 1,300.0 1,349.0 (49.0) 2,685 4.40
Bugis Junction 1,087.0 1,106.0 (19.0) 2,742 4.70
JCube 276.0 288.0 (12.0) 1,314 4.85
Lot One Shoppers’ Mall 531.0 537.0 (6.0) 2,333 4.70
Bukit Panjang Plaza 324.0 330.0 (6.0) 1,980 4.80
Retail: 4.65
The Atrium@Orchard 740.0 764.0 (24.0) 1,913(2)
Office: 3.75
Clarke Quay 394.0 414.0 (20.0) 1,344 4.85
Bugis+ 353.0 357.0 (4.0) 1,646 5.20
Bedok Mall 779.0 794.0 (15.0) 3,502 4.60
Westgate 1,087.0 1,131.0 (44.0) 2,657 4.50
Total CMT Portfolio excluding Raffles City
10,139.0 10,404.0 (265.0)
Singapore
Share of Joint Venture’s investment property
Retail: 4.70
Raffles City Singapore (3)
1,306.4 1,353.6 (47.2) N.M. Office: 3.95
(40.0% interest)
Hotel: 4.75
(1) Reflects the valuation of the retail and office components of the integrated development.
(2) Reflects valuation of the property in its entirety.
(3) Not meaningful because Raffles City Singapore comprises retail units, office units, hotels and convention centre.
N.M. : Not meaningful
11
Citi-REITAS-SGX C-Suite Singapore REITS and Sponsors Forum *Aug 2020*Healthy balance sheet
As at 30 June 2020
S$’000
Non-current Assets 11,199,567 Net Asset Value/Unit
S$2.01
(as at 30 June 2020)
Current Assets 157,552
Adjusted Net Asset Value/Unit
Total Assets 11,357,119 S$1.99
(excluding distributable income)
Current Liabilities 823,253
Non-current Liabilities 3,112,044
Total Liabilities 3,935,297
Net Assets 7,421,822
Unitholders’ Funds 7,421,822
Units in Issue (’000 units) 3,690,155
12
Citi-REITAS-SGX C-Suite Singapore REITS and Sponsors Forum *Aug 2020*Portfolio Updates
The Atrium@Orchard1H 2020 shopper traffic and tenants’ sales
performance(1)
Sharp decline in shopper traffic, attributable to the circuit breaker
(7 April to 1 June 2020), led to corresponding lower tenants’ sales
Shopper traffic Tenants’ sales
decreased by 40.6% Y-o-Y decreased by 15.4% Y-o-Y
($ psf/mth)
/ month)
100
200
Shopper Traffic (million)
Sales
150
Sales ($psf
Tenants’ Tenants’
50
100
50
0
0
1H 2020 1H 2019
1H 2020 1H 2019
(1) For comparable basis, CMT portfolio excludes Funan which was closed in July 2016 for redevelopment and reopened in June 2019.
14
Citi-REITAS-SGX C-Suite Singapore REITS and Sponsors Forum *Aug 2020*Weekly shopper traffic performance for
June 2020
Steady recovery in shopper traffic as the economy transitions into Phase Two safe reopening
4
+48%
Shopper Traffic (million)
+65%
2
0
1 - 7 Jun 8 -14 Jun 15 - 21 Jun 22 - 28 Jun
15
Citi-REITAS-SGX C-Suite Singapore REITS and Sponsors Forum *Aug 2020*Post circuit breaker shopper traffic recovery
Recovered to 53% of January 2020 level (1st week of July vs 1st week of January 2020)
Weekly portfolio shopper traffic trend
First COVID-19
case identified
Circuit breaker Phase 1
Dorscon level measures started reopening
raised to orange
Phase 2
reopening
16
Citi-REITAS-SGX C-Suite Singapore REITS and Sponsors Forum *Aug 2020*1H 2020 tenants’ sales by trade categories
Top five trade categories(1) YTD tenants’ sales $ psf / month(2) 14.5% Y-o-Y
:
(by gross rental income) Percentage of total gross rental income(3) > 70%
30%
Y-o-Y Variance of Tenants’ Sales $ psf/month (%)
18.6%
20%
10%
0.7%
0%
-10%
-12.3% -12.5% -13.2%
-20% -15.3% -17.0%
-30% -23.3% -24.1% -25.0% -25.4% -26.1%
-30.8%
-40% -33.9%
-39.0%
-50%
(4)
Fashion
Services
Sporting Goods
Supermarket
Books & Stationery
Shoes & Bags
Leisure & Entertainment
Beauty & Health
Home Furnishing
Luxury
Department Store
Food & Beverages
Jewellery & Watches
Electrical & Electronics
IT & Telecommunications
(1) The top five trade categories include Food & Beverage, Fashion, Beauty & Health, Department Store and Supermarket.
(2) For comparable basis, CMT portfolio excludes Funan which was closed in July 2016 for redevelopment and reopened in June 2019.
(3) For the period YTD June 2020. Excludes gross turnover rent.
(4) Includes convenience stores, bridal shops, optical shops, film processing shops, florists, magazine stores, pet shops, travel agencies, cobblers/locksmiths, laundromats and clinics.
17
Citi-REITAS-SGX C-Suite Singapore REITS and Sponsors Forum *Aug 2020*Rental reversions
From 1 January to 30 June 2020 (Excluding Newly Created and Reconfigured Units
Net Lettable Area Increase in Current Rental
No. of Renewals / Retention Rate Rates vs Preceding Rental
Property Percentage of
New Leases (%) Area (sq ft) Rates (typically committed
Mall (%) three years ago) (%)
Tampines Mall 21 85.7 42,379 11.9 0.3
Junction 8 18 77.8 38,166 15.0 1.6
Funan (1) 3 100.0 1,744 0.5 1.4
IMM Building (1) 33 90.9 31,827 7.5 2.1
Plaza Singapura 31 80.6 131,483 27.2 2.9
Bugis Junction 31 96.8 41,243 10.4 (3.8)
Raffles City Singapore (1) 20 80.0 25,026 5.9 (1.9)
Lot One Shoppers’ Mall 32 90.6 19,386 8.5 (3.1)
(1)
The Atrium@Orchard 4 100.0 3,089 2.3 (4.5)
Clarke Quay 4 100.0 9,832 3.5 2.5
Bugis+ 5 60.0 8,482 4.0 1.5
Bedok Mall 25 92.0 20,867 9.4 (1.5)
Westgate 37 97.3 31,815 7.7 1.1
(2)
Other Assets 27 100.0 21,082 5.7 (0.9)
(3)
CMT Portfolio 291 90.0 426,421 10.1 0.1
(1) Based on retail leases only.
(2) Includes JCube and Bukit Panjang Plaza.
(3) Excludes Funan which was closed in July 2016 for redevelopment and reopened in June 2019.
18
Citi-REITAS-SGX C-Suite Singapore REITS and Sponsors Forum *Aug 2020*Portfolio lease expiry profile(1)
Weighted Average Expiry by
2.0 Years
Gross Rental Income
Gross Rental Income per Month(2)
Number of Leases S$’000 % of Total
As at 30 June 2020
2020 320 4,909 7.6
2021 985 18,580 28.6
2022 1,003 21,592 33.3
2023 520 12,168 18.7
2024 68 4,615 7.1
2025 and beyond 44 3,038 4.7
Total 2,940(3) 64,902 100.0
(1) Based on committed leases. Includes CMT’s 40.0% interest in Raffles City Singapore (excluding hotel lease).
(2) Based on the month in which the lease expires and excludes gross turnover rent.
(3) Of which 2,530 leases are retail leases.
19
Citi-REITAS-SGX C-Suite Singapore REITS and Sponsors Forum *Aug 2020*Portfolio lease expiry profile for 2020(1)
Net Lettable Area Gross Rental Income
No. of Leases
As at 30 June 2020 % of Property NLA(2) % of Property Income(3)
Tampines Mall 10 4.3 5.6
Junction 8 14 3.2 5.3
Funan(4) 4 0.4 0.4
IMM Building(5) 82 13.0 10.8
Plaza Singapura 25 7.8 9.2
Bugis Junction 16 6.4 6.2
Raffles City Singapore(5) 28 13.5 9.7
Lot One Shoppers’ Mall 19 8.1 9.8
The Atrium@Orchard(5) 13 7.4 8.9
Clarke Quay 4 5.5 5.5
Bugis+ 7 7.1 6.7
Bedok Mall 23 7.1 8.3
Westgate 25 7.4 7.4
Other assets(6) 50 9.8 13.1
(7)
Portfolio 320 8.1 7.7
(1) Based on committed leases. Includes CMT’s 40.0% interest in Raffles City Singapore (excluding hotel lease).
(2) As a percentage of net lettable area for each respective property as at 30 June 2020.
(3) As a percentage of gross rental income for each respective property and excludes gross turnover rent.
(4) Funan reopened in June 2019 after a three-year redevelopment and includes both office and retail leases.
(5) Includes non-retail leases for IMM Building, Raffles City Singapore and The Atrium@Orchard.
(6) Includes JCube and Bukit Panjang Plaza.
(7) Of which 263 leases are retail leases.
20
Citi-REITAS-SGX C-Suite Singapore REITS and Sponsors Forum *Aug 2020*High occupancy maintained
(%, As at) 31 Dec 2011 31 Dec 2012 31 Dec 2013 31 Dec 2014 31 Dec 2015 31 Dec 2016 31 Dec 2017 31 Dec 2018 31 Dec 2019 30 Jun 2020
Tampines Mall 100.0 100.0 100.0 99.5 100.0 99.2 100.0 100.0 100.0 99.1
Junction 8 100.0 99.6 99.4 100.0 100.0 99.9 100.0 100.0 100.0 99.5
Funan(1) 100.0 100.0 98.2 97.9 95.3 N.A.(2) N.A.(2) N.A.(2) 99.0(3) 99.2(3)
IMM Building(4) 100.0 98.1 99.0 96.0(5) 96.0 97.9 99.5 99.7 99.4 98.2
Plaza Singapura 100.0 91.3 100.0 100.0 99.7 100.0 100.0 99.9 100.0 99.3
Bugis Junction 100.0 100.0 100.0 100.0 99.7 99.9 99.3 99.8 100.0 98.7
(6) (5)
Other assets 80.9 99.8 100.0 98.1 92.6 95.3 96.4 94.8 95.6 95.4
(4)
Raffles City Singapore 100.0 100.0 100.0 100.0 99.6 99.7 99.9 99.4 98.9 97.6
Lot One Shoppers' Mall 99.7 99.8 100.0 100.0 99.8 99.9 100.0 99.8 99.3 97.6
The Atrium@Orchard(3) 65.5(5) 95.3 99.5 99.9 98.2 97.6 98.6 99.1 99.6 97.4
Clarke Quay 100.0 97.9 100.0 95.9 88.2 90.7 98.8 98.3 100.0 92.3
Bugis+ 99.5 100.0 100.0 99.2 100.0 100.0 100.0 100.0 99.8
Westgate 85.8 97.7 97.6 99.6 98.0 99.4 99.9 98.8
Bedok Mall 99.9 100.0 99.2 100.0 99.5 96.9
CMT Portfolio 94.8 98.2 98.5 98.8 97.6 98.5 99.2 99.2 99.3 97.7
(1) Funan reopened in June 2019 after a three-year redevelopment.
(2) Not applicable as Funan was closed on 1 July 2016 for redevelopment.
(3) Includes retail and office leases.
(4) Based on retail leases only.
(5) Lower occupancy rates were mainly due to Asset Enhancement Initiatives (AEI).
(6) Other assets include:
a) Sembawang Shopping Centre, until it was divested in 2018;
b) Rivervale Mall, until it was divested in 2015;
c) Hougang Plaza, until it was divested in 2012;
d) JCube, except from 2008 to 2011 when it underwent an AEI and from 2012 to 2015 when it was classified separately;
e) Bugis+, which was acquired in 2011 and subsequently underwent an AEI from November 2011 to July 2012. The asset was classified separately from 2012 onwards; and
f) Bukit Panjang Plaza, from 2018 onwards.
21
Citi-REITAS-SGX C-Suite Singapore REITS and Sponsors Forum *Aug 2020*Going Forward
WestgateCautious outlook in the near term
Prioritising operational recovery and safeguarding the well-being of stakeholders
Retail • Retail headwinds in FY 2020 given current uncertain economic climate and softening
environment demand for retail space, mitigated by limited new retail supply1 in the next five years
• Uncertainty over consumer sentiment, pace of recovery of the tourism industry and
lifting of safe management measures continue to pose operational challenges ahead
• Pressure on rental reversion and occupancy as retailer sentiment turns cautious
• Monitoring the recovery of shopper traffic and tenants sales post Phase Two safe
reopening
Near-term • Continuing to stay vigilant and deepen stakeholder engagement by keeping
strategy communication channels open
• Focusing on sustaining healthy occupancy levels through proactive lease
management and extending consumer outreach by leveraging technology
• Ensuring financial resilience and flexibility through prudent capital management
(1) Comprising mainly ancillary retail
23
Citi-REITAS-SGX C-Suite Singapore REITS and Sponsors Forum *Aug 2020*Thank you
For enquiries, please contact: Ms Lo Mun Wah, Vice President, Investor Relations
Direct: (65) 6713 3667 Email: lo.munwah@capitaland.com
CapitaLand Mall Trust Management Limited (www.cmt.com.sg)
168 Robinson Road, #30-01 Capital Tower, Singapore 068912
Tel: (65) 6713 2888 Fax: (65) 6713 2999Supplementary
Information
Raffles City SingaporeMarket leadership in Singapore retail space
S$7.0b 15 ~3,000 5.9m
Market Properties in Extensive Network sq ft NLA(2)
Capitalisation(1) Singapore of Tenants
Bedok Mall Bugis Junction Bugis+ Bukit Panjang Plaza Clarke Quay
Funan IMM Building JCube Junction 8 Lot One Shoppers’ Mall
Raffles City Singapore
Plaza Singapura (40% stake) Tampines Mall The Atrium@Orchard Westgate
(1) As at 31 July 2020.
(2) Based on total NLA, including retail, office and warehouse, as at 30 June 2020.
26
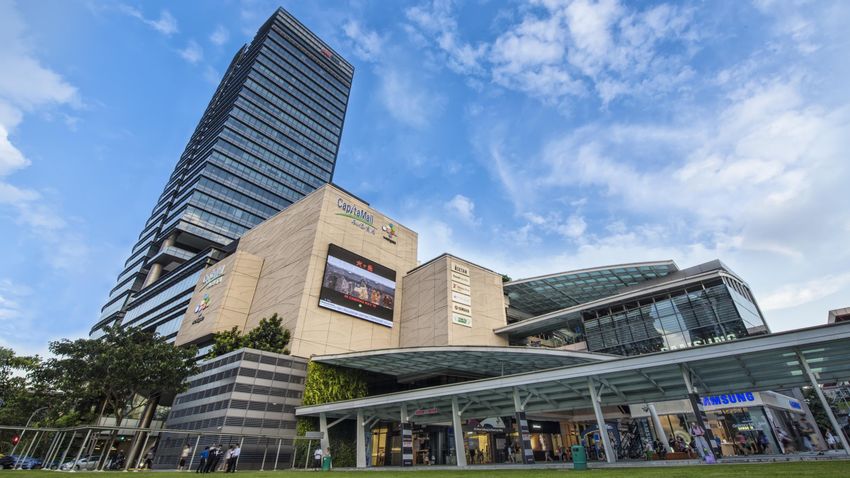
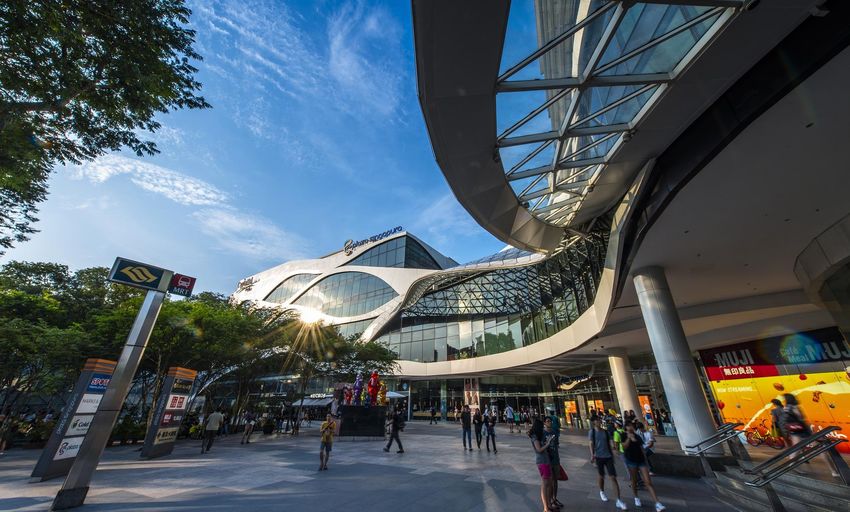
Citi-REITAS-SGX C-Suite Singapore REITS and Sponsors Forum *Aug 2020*Strategically located portfolio
Comprises a good mix of downtown and suburban malls;
Close proximity to public transport and population catchments
27
Citi-REITAS-SGX C-Suite Singapore REITS and Sponsors Forum *Aug 2020*CMT business model
CMT’s business model illustrates how we create value with six key capitals(1) through astute
execution of three growth strategies to drive business activities.
Key Capitals How we create value
Financial
Proactive Portfolio Management
Driving intrinsic growth from the portfolio through active asset management
Organisational and creative asset planning with the Property Managers to unlock potential
value and deliver sustainable returns
Manufactured
Disciplined Portfolio Reconstitution
Identifying value-adding opportunities to promote growth and enhance the
Environmental quality of the portfolio
Human Prudent Capital and Risk Management
Optimising returns to Unitholders while maintaining a strong capital base and
Social & Relationship credit rating to support growth
(1) With reference to The Guiding Principles of the International Integrated Reporting Council (IIRC) Framework.
28
Citi-REITAS-SGX C-Suite Singapore REITS and Sponsors Forum *Aug 2020*CMT track record
From 3 to 15 assets since inception
Start of Westgate
IMM Building development –
Bugis Junction
Retail and office
27.2% interest in CRS1 Sembawang components
Shopping Centre (30.0% interest) Rivervale Mall
Lot One Shoppers’ Mall
JCube Remaining Funan – Serviced
Bukit Panjang Plaza
72.8% interest residence Official opening
Rivervale Mall Hougang Plaza3 Clarke Quay Hougang Plaza Bedok Mall of Funan5
in CRS2 component
2003 2005 2007 2010 2012 2015 2017 2019
2002 2004 2006 2008 2011 2013 2016 2018
IPO Plaza Raffles City The Atrium@ Bugis+ Opening of Start of Funan Sembawang
Singapura Singapore Orchard Westgate – Retail redevelopment Shopping Centre
Tampines Mall (40.0% interest) component
Awarded land
Junction 8 (30.00% interest)
parcel at Jurong
Gateway - Westgate – Office Westgate – Retail
Funan DigitaLife Mall Investment in
Westgate component component
CapitaLand Retail
development (30.0% interest) (70.0% interest4)
China Trust
(20.0% interest3) (30.00% interest)
Acquisition Divestment
(1) Acquisition of Class ‘E’ bonds issued by CapitaRetail Singapore Limited (‘CRS’) which owned Lot One Shoppers’ Mall, Bukit Panjang Plaza (90 out of 91 strata lots) and Rivervale Mall.
(2) Acquired 92.40% interest. Balance 7.60% acquired in June 2006.
(3) 10.9% interest as at 30 June 2020. The fair value of the investment in CapitaLand Retail China Trust represented 1.4% of CMT and its subsidiaries’ (CMT Group) total asset size as at 30 June 2020.
(4) Acquisition of the remaining 70.00% interest in Infinity Mall Trust which holds Westgate was completed on 1 November 2018.
(5) Commenced trading on 28 June 2019. Officially opened on 27 December 2019.
29
Citi-REITAS-SGX C-Suite Singapore REITS and Sponsors Forum *Aug 2020*Steady distributable income growth
S$ million
441.6
410.7
392.0 394.3 395.8
375.3
356.2
316.9
294.8 301.6
282.0
238.4
211.2
169.4
126.8
98.1
64.9
2016
2003
2004
2005
2006
2007
2008
2009
2010
2011
2012
2013
2014
2015
2017
2018
2019
(1) Based on compounded annual growth rate (‘CAGR’) from 2003 to 2019.
30
Citi-REITAS-SGX C-Suite Singapore REITS and Sponsors Forum *Aug 2020*Historical financial performance
Gross Revenue (S$ million) Total Assets (S$ million)
879.9
787.2 807.5 795.4 807.6
93.2
118.2 117.8 113.0 110.1
786.7
669.0 689.7 682.4 697.5
2015 2016 2017 2018 2019
(1)
CMT Group Joint ventures (For information only)
(2)
Distributable Income (S$ million) Distribution Per Unit (cents)
(1) On 1 October 2015, CMT acquired all the units in Brilliance Mall Trust (BMT) which holds Bedok Mall. Upon acquisition, BMT became a wholly owned subsidiary of CMT. On 15 December 2015, the divestment of Rivervale Mall was
completed. On 30 August 2016, three private trusts namely Victory Office 1 Trust, Victory Office 2 Trust and Victory SR Trust (collectively, the Victory Trusts, each wholly owned by CMT) were constituted in relation to the redevelopment
of Funan. CMT, together with the Victory Trusts jointly own and undertake to redevelop Funan which comprises a retail component (held through CMT), two office towers and serviced residences. On 31 October 2017, CMT divested
all of the units held in Victory SR Trust, which holds the serviced residence component of Funan, to Victory SR Pte. Ltd., a wholly owned subsidiary of Ascott Serviced Residence (Global) Fund Pte. Ltd.. On 18 June 2018, the divestment
of Sembawang Shopping Centre was completed. On 1 November 2018, the acquisition of the balance 70.00% of the units in Infinity Mall Trust (IMT) was completed. Upon the completion, IMT became a wholly owned subsidiary of
CMT and its financials are consolidated to CMT Group’s financial results with effect from 1 November 2018.
(2) Joint ventures refer to CMT’s 40.0% interest in RCS Trust and CMT’s 30.00% interest in IMT (until 31 October 2018) and Infinity Office Trust.
31
Citi-REITAS-SGX C-Suite Singapore REITS and Sponsors Forum *Aug 2020*Prudent capital management
Aggregate Leverage (%)(1)
Net Debt / EBITDA (times)(2) Interest Coverage (times)(3)
(1) In accordance with Property Funds Appendix, CMT’s proportionate share of its joint ventures’ borrowings and total deposited property value are included when computing the
aggregate leverage.
(2) Net Debt comprises Gross Debt less temporary cash intended for refinancing and capital expenditure and EBITDA refers to net income of CMT Group before fair value changes,
non-operational gain and/or loss, finance cost (net of interest income), tax, depreciation and amortisation.
(3) Ratio of net income of CMT Group before fair value changes, non-operational gain and/or loss, finance cost (net of interest income) and tax over interest expense.
32
Citi-REITAS-SGX C-Suite Singapore REITS and Sponsors Forum *Aug 2020*FY 2019 gross revenue
- increased by 12.8% versus FY 2018
On comparable mall basis(1), FY 2019 gross revenue up 0.6% Y-o-Y
S$ million
CMT Portfolio 786.7
697.5
82.9
Tampines Mall 81.4
Junction 8
61.2 12.8%
60.8
28.5
Funan -
86.8 Mainly due to:
IMM Building 85.8 1) Acquisition of the remaining
92.1 70.0% interest in Westgate
Plaza Singapura 91.5
(Acquisition);
Bugis Junction 84.9 2) commencement of operations
84.9
43.2 at Funan; and
Lot One Shoppers' Mall 44.1 3) partially offset by the
50.0 divestment of Sembawang
The Atrium@Orchard 50.1
40.1 Shopping Centre in June 2018.
Clarke Quay 38.6
33.7
Bugis+ 33.6
57.9
Bedok Mall 57.0
Westgate 74.9
11.2
50.5 FY 2019 FY 2018
Other Assets(2) 58.5
(1) Excludes Funan which was closed in July 2016 for redevelopment and reopened in June 2019, Sembawang Shopping Centre which was divested in June 2018 and Westgate which was
accounted under the performance of joint ventures prior to the completion of The Acquisition in November 2018.
(2) Includes JCube, Bukit Panjang Plaza and Sembawang Shopping Centre which was divested in June 2018.
33
Citi-REITAS-SGX C-Suite Singapore REITS and Sponsors Forum *Aug 2020*FY 2019 operating expenses
- increased by 12.0% versus FY 2018
On comparable mall basis(1), FY 2019 operating expenses down 1.2% Y-o-Y
S$ million
CMT Portfolio 228.5
204.0
Tampines Mall 21.1
21.0
Junction 8 16.7 12.0%
16.7
13.4
Funan
1.3
26.3 Mainly due to:
IMM Building 25.5
23.2 1) The Acquisition;
Plaza Singapura 23.2 2) commencement of operations
23.2 at Funan, and
pre-
Bugis Junction
23.5 3) partially offset by the
13.2
Lot One Shoppers' Mall 13.4 divestment of Sembawang
The Atrium@Orchard
12.5 Shopping Centre in June 2018.
11.7
14.0
Clarke Quay 15.0
9.6
Bugis+ 9.7
15.1
Bedok Mall 15.7
Westgate 21.1
3.7
19.1
Other Assets (2) 23.6 FY 2019 FY 2018
(1) Excludes Funan which was closed in July 2016 for redevelopment and reopened in June 2019, Sembawang Shopping Centre which was divested in June 2018 and Westgate which was
accounted under the performance of joint ventures prior to the completion of The Acquisition in November 2018.
(2) Includes JCube, Bukit Panjang Plaza and Sembawang Shopping Centre which was divested in June 2018.
34
Citi-REITAS-SGX C-Suite Singapore REITS and Sponsors Forum *Aug 2020*FY 2019 net property income
- increased by 13.1% versus FY 2018
On comparable mall basis(1), FY 2019 net property income up 1.3% Y-o-Y
S$ million
CMT Portfolio 558.2
493.5
61.8
Tampines Mall 60.4 13.1%
44.5
Junction 8 44.1
15.1
Funan (1.3)
60.5
IMM Building 60.3
68.9
Plaza Singapura 68.3
Bugis Junction 61.7
61.4
30.0
Lot One Shoppers' Mall 30.7
37.5
The Atrium@Orchard 38.4
26.1
Clarke Quay 23.6
24.1
Bugis+ 23.9
42.8
Bedok Mall 41.3
Westgate 53.8
7.5
31.4
Other Assets(2) 34.9 FY 2019 FY 2018
(1) Excludes Funan which was closed in July 2016 for redevelopment and reopened in June 2019, Sembawang Shopping Centre which was divested in June 2018 and Westgate which was
accounted under the performance of joint ventures prior to the completion of The Acquisition in November 2018.
(2) Includes JCube, Bukit Panjang Plaza and Sembawang Shopping Centre which was divested in June 2018.
35
Citi-REITAS-SGX C-Suite Singapore REITS and Sponsors Forum *Aug 2020*FY 2019 performance of joint ventures(1)
On comparable mall basis(2), FY 2019 net property income up 1.7% Y-o-Y
Gross Revenue (S$ million)
Total 93.2
110.1
Raffles City Singapore 93.2
92.2
Westgate -
17.9
Operating Expenses (S$ million)
Total 22.0
26.3
Raffles City Singapore 22.0
22.3
Westgate -
4.0
Net Property Income (S$ million)
Total 71.2
83.8
Raffles City Singapore 71.2
69.9
Westgate -
13.9
FY 2019 FY 2018
(Charts are of different scales)
(1) Relates to CMT’s 40.0% interest in Raffles City Singapore and 30.0% interest in Westgate (for the period 1 January 2018 to 31 October 2018).
(2) Excludes Westgate as it is no longer accounted for as a joint venture following the completion of The Acquisition in November 2018.
36
Citi-REITAS-SGX C-Suite Singapore REITS and Sponsors Forum *Aug 2020*Gross revenue by property
CMT Portfolio(1)
% of Total Gross Revenue
For FY 2019
Tampines Mall 9.4
Junction 8 7.0
Funan 3.2
IMM Building 9.9
Plaza Singapura 10.5
Bugis Junction 9.6
Lot One Shoppers' Mall 4.9
The Atrium@Orchard 5.7
Clarke Quay 4.6
Bugis+ 3.8
Bedok Mall 6.6
Westgate 8.5
(2)
Other assets 5.7
Raffles City Singapore 10.6
Total 100.0
(1) Includes CMT’s 40.0% interest in Raffles City Singapore and Funan, which was closed in July 2016 for redevelopment and reopened in June 2019.
(2) Includes Bukit Panjang Plaza and JCube.
37
Citi-REITAS-SGX C-Suite Singapore REITS and Sponsors Forum *Aug 2020*Well-diversified trade mix
CMT Portfolio(1)
% of Gross Rental Income(2)
For the month of
December 2019
Food & Beverage 31.1
Beauty & Health 11.7
Fashion 11.0
Department Store 5.8
Office 5.4
Leisure & Entertainment / Music & Video(3) 4.8
Gifts & Souvenirs / Toys & Hobbies / Books & Stationery / Sporting Goods 4.8
Services 4.2
Supermarket 3.6
Shoes & Bags 3.5
IT & Telecommunications 3.5
Home Furnishing 3.0
Electrical & Electronics 2.2
Jewellery & Watches 2.1
Education 1.4
Warehouse 1.4
Others(4) 0.5
Total 100.0
(1) Includes CMT’s 40.0% interest in Raffles City Singapore (retail only) and Funan, which was closed in July 2016 for redevelopment and reopened in June 2019.
(2) Excludes gross turnover rent.
(3) Includes tenants approved as thematic dining, entertainment and a performance centre in Bugis+.
(4) Others include Art Gallery and Luxury.
38
Citi-REITAS-SGX C-Suite Singapore REITS and Sponsors Forum *Aug 2020*Top 10 tenants
10 Largest Tenants Contribute About 22.1% of Total Gross Rental Income(1)
No Single Tenant Contributes More Than 4.0% of Total Gross Rental Income
Tenant Trade Sector % of Gross Rental Income
RC Hotels (Pte.) Ltd Hotel 3.2
Supermarket / Beauty & Health / Services / Food &
NTUC Enterprise 3.2
Beverage / Education / Warehouse
Temasek Holdings (Private) Limited Office 2.8
Department Store / Fashion / Beauty & Health /
Al-Futtaim Group 2.7
Sporting Goods
BreadTalk Group Limited Food & Beverage 2.5
Supermarket / Beauty & Health /
Cold Storage Singapore (1983) Pte Ltd 2.4
Services / Warehouse
BHG (Singapore) Pte. Ltd. Department Store 1.7
Golden Village Multiplex Pte Ltd Leisure & Entertainment 1.2
Wing Tai Retail Management Pte. Ltd. Fashion / Sporting Goods / Shoes & Bags 1.2
Isetan (Singapore) Limited Department Store 1.2
Total 22.1
(1) Based on gross rental income for the month of December 2019 and excludes gross turnover rent.
39
Citi-REITAS-SGX C-Suite Singapore REITS and Sponsors Forum *Aug 2020*Downtown vs suburban malls
CMT Portfolio(1)
By Gross Revenue By Asset Valuation
(For FY 2019) (As at 31 December 2019)
(1) Excludes Funan which was closed on 1 July 2016 for redevelopment and reopened in June 2019.
(2) Includes Tampines Mall, Junction 8, IMM Building, Lot One Shoppers’ Mall, Bukit Panjang Plaza, JCube, Bedok Mall and Westgate.
(3) Includes Bugis Junction, Bugis+, CMT’s 40.00% interest in Raffles City Singapore, Plaza Singapura, The Atrium@Orchard and Clarke Quay.
40
Citi-REITAS-SGX C-Suite Singapore REITS and Sponsors Forum *Aug 2020*Market share by owner
CMT remains the largest shopping mall owner in Singapore
owning 14.1% of malls greater than 100,000 sq ft NLA
Share of Major Shopping Mall Floor Space by Owner1,2,3
Singapore, 2019
Source: Cistri
(1) Malls with NLA of 100,000 sq ft and above as at end 2019. Share of floor space takes into account ownership stakes.
(2) Fund manager treated as a single owner.
(3) REITs and sponsors treated as separate owners. For example, Frasers Centrepoint Trust’s floor space share excludes floor space owned by Frasers Property.
41
Citi-REITAS-SGX C-Suite Singapore REITS and Sponsors Forum *Aug 2020*Available retail floor space
No new shopping centre openings larger than 200,000 sq ft from 2020 to 2024
Retail Floor Space Supply
Singapore, 2009 – 2024 (million sq ft)
Average growth rate of around 530,000 sq ft or
0.8% per annum over the next five years
Sources: URA, Developers’ Announcements, Cistri.
42
Citi-REITAS-SGX C-Suite Singapore REITS and Sponsors Forum *Aug 2020*Fairly resilient retail rents
Singapore Retail Rents and Quarterly GDP Growth
10.0% $40.00
$35.00
5.0%
$30.00
$25.00
0.0%
$20.00
Q1 2010
Q2 2010
Q3 2010
Q4 2010
Q1 2011
Q2 2011
Q3 2011
Q4 2011
Q1 2012
Q2 2012
Q3 2012
Q4 2012
Q1 2013
Q2 2013
Q3 2013
Q4 2013
Q1 2014
Q2 2014
Q3 2014
Q4 2014
Q1 2015
Q2 2015
Q3 2015
Q4 2015
Q1 2016
Q2 2016
Q3 2016
Q4 2016
Q1 2017
Q2 2017
Q3 2017
Q42017
Q1 2018
Q2 2018
Q3 2018
Q4 2018
Q1 2019
Q2 2019
Q3 2019
Q4 2019
Q1 2020
Q2 2020
-5.0%
$15.00
$10.00
-10.0%
$5.00
-15.0% $0.00
GDP Q/Q growth Orchard Suburban
Sources: CBRE and Department of Statistics Singapore.
43
Citi-REITAS-SGX C-Suite Singapore REITS and Sponsors Forum *Aug 2020*Shopping centre floor space per capita
Provision of shopping centre floor space in Singapore relatively lower
compared to some other developed markets
Shopping Centre Floor Space Per Capita
sq ft NLA
23.1
11.4
6.3
4.6 4.5
United States (2018) Australia (2018) Singapore (2019) UK (2018) Japan (2018)
Source: International Council of Shopping Centres, Cistri.
44
Citi-REITAS-SGX C-Suite Singapore REITS and Sponsors Forum *Aug 2020*You can also read