Company Presentation November 2019 - vgp parks
←
→
Page content transcription
If your browser does not render page correctly, please read the page content below

Company Presentation November 2019
1. Introduction to VGP
The Continental European pure-play logistics real-estate group
Fully integrated business model – from land identification and acquisition
to development and asset and property management
Focus on securing strategically located land plots
Major European cities with >100k inhabitants
Public transport links
24/7-operations
Focus on developing large
multi-tenant business parks
High-quality standardised
logistic and semi industrial
real estate
>200 real estate and
12 European countries 62 logistics parks
development experts
3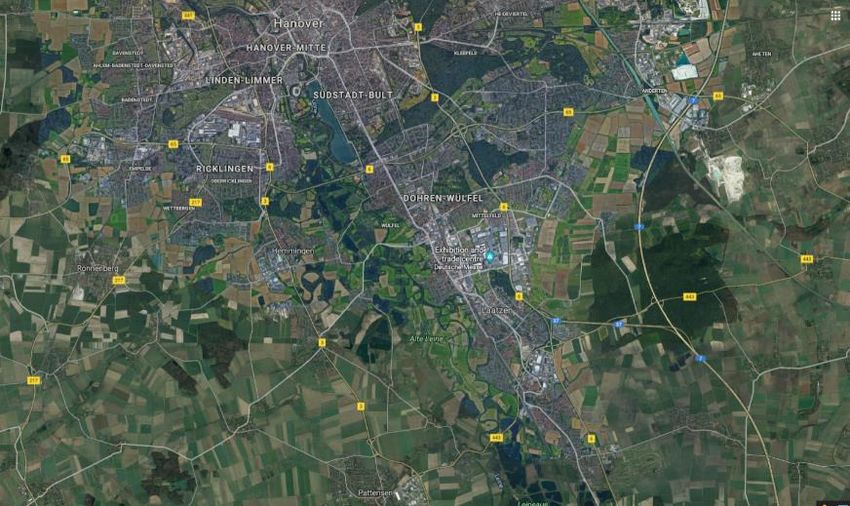
The Continental European pure-play logistics real-estate group (cont’d)
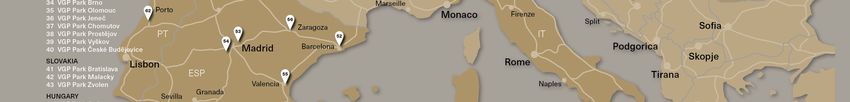
Overview of existing VGP parks (October 2019)
4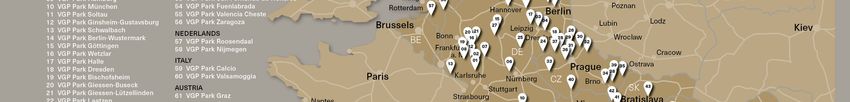
Successful track record of geographic expansion and continued
delivery across markets…                                                                                                              2019
                                                                                                                                  Expansion of
                                                                                                                                  partnership –
                                                                                                       2017                       launch of 2nd
                                                                                                Fully-marketed                    Joint Venture
                                                                                                     secondary                     (50/50) with
                                                                                                equity offering
                                                                                                (reaching 37%
                                                                                                      free float)

                                              2011
                                       Sale of Czech
                                            assets to
                                                                          2015
                                               funds                  Expansion to
                                        managed by                          Spain                                     2018
  1998                      2007      Tristan Capital                                                      Further expansion
                            Listing on      Partners                                                               throughout
  VGP
                                                                                                           Western- (Benelux,
  founded in                Euronext                                                     2016                     Austria) and
  Czech                     Brussels and
                            Prague Stock                                             Joint Venture          Southern-Europe
  Republic as
                            Exchange                                                  (50/50) with            (Italy, Portugal)
  a family-
  owned real
  estate
                                                               2013
  developer                                               Expansion
                                                         to Germany
                                           2007 -
                                           2009
                                           Expansion
                2002                       throughout the
                                           Mid-European
                Start-up of the            region (Slovakia,
                development of             Hungary) and
                a proprietary              Baltics (Estonia
                portfolio                  and Latvia)

                                                                                                                                           5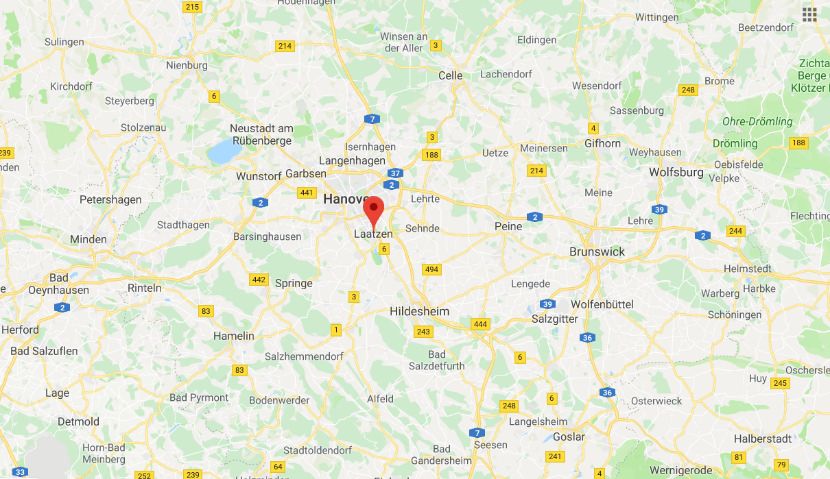
With a proven ability to build a growing portfolio of yielding assets

      Completed1 gross leasable area (‘000 m²)

    4000
                                                                                                                                                                3,482
    3500

                                                                                                                                   2,522
    3000                                                                                                                                                         900

    2500                                                                                                1,996

                                                                                                                                                                 837
    2000                                                                      1,651                                                 900

                                                                                                         719
    1500                                           1,191                                                                            288
                                                                              642
                         910
    1000                                                                                                 446
                                                     642                                                                                                        1,745
                                                                              416
                                                                                                                                   1,333
                         642
      500
                                                                                                         831
                                                     549                      593
                         268
         0
                        2014                       2015                      2016                       2017                       2018                    Oct-19 (incl UC)

                               Projects held by JV                          Projects held directly by VGP                          Projects divested

              Development of a significant leasable area with historical occupancy of >95%2
    As of Oct 2019
    1 Including assets divested (see chart breakdown)
    2 Occupancy at October 2019 for completed portfolio (incl JV) was 99.7%. Since 2010 occupancy rate was consistently >95% except 2014 when it was 94%
                                                                                                                                                                              6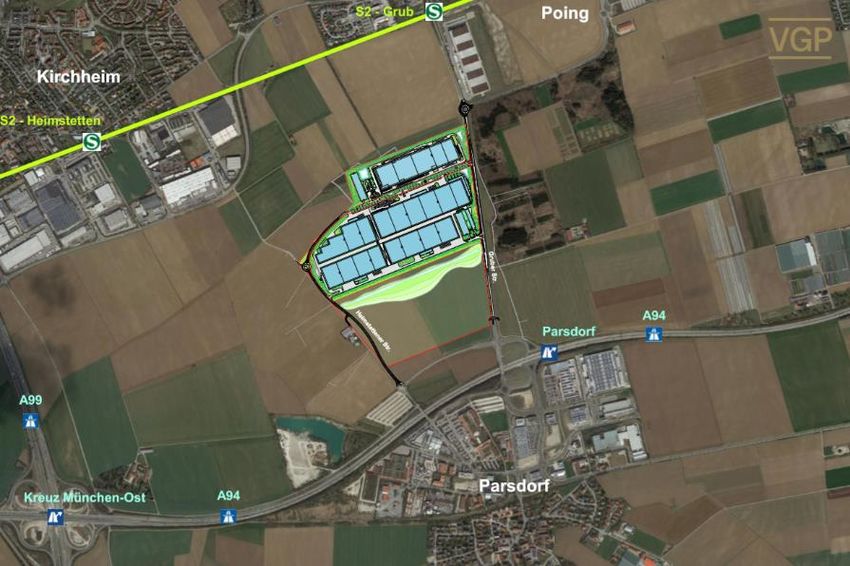
Proven track record of developing unique and high quality properties
across strategic locations with blue chip tenants

     VGP Park Frankenthal          VGP Park Chomutov             VGP Park Rodgau               VGP Park München
          Germany                    Czech Republic                 Germany                        Germany

        Completed 2018               Completed 2017            Completed 2015 – 2016        Construction 2019 (started)

    Total Gross Lettable area:   Total Gross Lettable area:   Total Gross Lettable area:     Total Gross Lettable area:
           147,022 m²                    49,808 m²                   103,699 m²                     311,000 m²

      Standardised building
     requirements with some                                                                    Newly built
                                                High technical standard
    adaptions to tenants’ needs                                                            (low maintenance)

                                                                                                                          7
Proven track record of developing unique and high quality properties
across strategic locations with blue chip tenants (cont’d)

    VGP Park San Fernando          VGP Park Ginsheim            VGP Park Timisoara              VGP Park Malacky
            Spain                      Germany                       Romania                        Slovakia

    Construction 2017-2020       Construction 2016 – 2017      Construction 2011-2018         Construction 2009-2016

    Total Gross Lettable area:   Total Gross Lettable area:   Total Gross Lettable area:     Total Gross Lettable area:
           122,000 m²                    36,000m²                    116,000 m²                      96,608 m²

      Standardised building
                                                                                               Newly built
     requirements with some                     High technical standard
                                                                                           (low maintenance)
    adaptions to tenants’ needs

                                                                                                                          8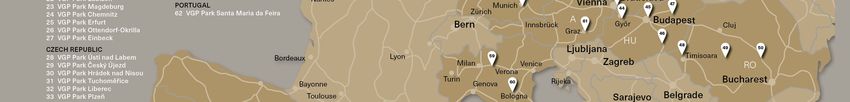
2. Market overview
VGP’s markets show favourable logistics sector dynamics

                                                            Western and Southern Europe                                         Eastern Europe                 Total

                                             57.8%   0.8%         1.0%       1.1%         10.2%       0.0%       16.4%   4.0%         2.7%       3.7%   2.4%   100%
 Contracted rent (€mm) /                                                                                                                                       143.6
      as % of total1                         83.0
                                                     1.1           1.4        1.5         14.6        0.0        23.6    5.8          3.9        5.2    3.4

                    GDP growth ‘19E
 Economy

                                              0.5    1.5           0.1        1.6          2.1         1.7        2.6    3.7           3.8       3.3     2.6
                          (%)

                            CPI ’19E (%)      1.8    1.8           0.9        2.5          1.1         1.7        2.4    3.2           2.4       3.6     2.8

                   No. of cities with
 Logistics

                                              81      5            47         27           55           9          6      8             2         25     1      266
                  +100k inhabitants
              Prime market yields
                                             3.90    5.25         5.30        4.15        5.00        6.25       5.50    7.25         6.50       8.00   7.90
                     (%)

                            No. of parks      27      1             2          2           5            1         12      4            3          3      1       62

                              Completed      1,020   18             0          0           99           0        426      91           69         92     63    1,877
             GLA (mm, m2)

                                Under
 Size

                                             286      0            45         105         116           0         76      18           19         39     0      705
                              construction
                               Remaining
                                             808     42             0         98          128          29        198     131          268        159     0     1,862
                                potential

                               Total GLA     2,114   59            45         203          343         29         700    240           356       290     63    4,443

All company data as of 31 October 2019; market date as of June 2019
Source: Economic data: European Commission; prime yields: latest reported by JLL (except Latvia which is CBRE)
List of towns and cities with 100,000 inhabitants or more, source: wikipedia
GLA data includes 100% of JV; Remaining potential for fully owned land bank only
In particular growing e-commerce are driving demand for logistics
assets across Europe
European ecommerce growth continues
at c.13% in 2019 Eastern and Southern Europe experience strong ecommerce growth
Annual European B2C Ecommerce Turnover (2013 – 2019 (f))
11%
€700
621 13%
€600 547 9% 12%
489
€500
429 10%
386
€400 329 9%
13%
279 37%
€300
€200
23% 15%
€100 17%
€-
2013 2014 2015 2016 2017 2018 2019
Source: Ecommerce Foundation, publication date 2 July 2019
Source: Ecommerce Foundation, publication date 2 July 2019 (2018 growth rate)
113. Operating model
VGP operating model highlights

                   Fully integrated business model combining a unique expertise as a
               1   developer, asset manager and owner of high-quality logistics
                   assets in Europe

                          Value creation crystallisation and cash recycling for all new
                      2
                          projects through strategic partnership with Allianz

                              Well located and diversified asset portfolio in Europe’s
                          3
                              growing economies

                              Growing recurring rental income base through well-
                          4
                              leased portfolio with a blue-chip customer base

                          Prime landbank with construction risk well managed as VGP
                      5   in most cases acts as General Contractor and imposes strict
                          pre-letting requirements

                   Experienced and highly committed management team with proven
               6
                   track record

                                                                                          13
1 In short: a unique business model in the logistics space in Europe
Focused on the acquisition of strategically located landbank close to the largest
consumption centres on a pan-European basis
Focuses on developing the assets itself, enabling strict risk controls on the process and
enforcing rigorous pre-letting requirements
Assets are largely standardized high-quality buildings suitable for logistical purposes
and light industrial activities which focus to be subsequently rented to reputable clients
in the form of long term leases
Capture increasing cash flow of rental income, fee income, JV dividends and realised
net valuation gains through sale to JV whilst remaining as a long-term investor
Supports healthy developer margins
Long-term investor, entering early in development process, coupled with collaboration
of local municipalities and city councils
Only pan-European developer, asset manager and owner of high-quality logistics assets
with Continental European roots
14Value creation crystallisation through strategic partnership with
2
Allianz enabling capital recycling for all new projects
Simplified structure of the two joint ventures VGP European Logistics and VGP European Logistics 2
50% 50% 50% 50%
5.1%
100%
94.9% 100% 100% 100%
Austria
100%
Italy
100%
Netherlands
Czech
Germany Slovakia Hungary 100%
Republic Portugal
100%
Romania
100%
Spain
Highlights
Two joint ventures, each with an investment target of €1.7 billion gross asset value (first JV already reached c. € 1.4 billion)
Exclusive Right of First Refusal for the respective JV to acquire assets in designated countries
VGP to continue to service both portfolios as asset, property and development manager
Joint Ventures act as long term capital buyer at market value
Driving sustainable growth through develop and hold strategy with long term partner whilst
maximizing shareholder value through optimal capital allocation
153 Resilient portfolio growth …
Total portfolio – including 100% JV (€mm)
Own portfolio
JVs-related1
2,500
2,000
1,536 1,500
1,360
878
1,000
645
500
677 628 713
550 576
416
-
2014 2015 2016 2017 2018 Jun-2019
2019
Capital expenditure €337.0m €261.0m €352.7m €198.7m €1,149m
Net cash inflow from divestments €236.1m €155.7m €438.4m2 €125.4m €956m
Portfolio growth mostly driven by continued CAPEX spend financed by rapid
capital recycling
As of June 2019
1 JVs-related includes German 5.1% stake held directly by VGP and portion of Held-for-Sale being developed on behalf of the JVs
2 Includes sale of Mango building, Spain (€150m) 163 …driven by enduring strong momentum for leasing growth…
Committed annualised rental income and number of tenancy contracts1
€150 250
Annualised Rent income - (€ million)
€125
200
Number of contracts
€100
150
€75
100
€50
50
€25
€- 0
2014 2015 2016 2017 2018 Oct 2019
2019
Rolling rental income Increase in rental income Number of contracts
Over 220 tenant contracts driving committed annualised leases to € 143.6 million2, an increase of 37.9% YTD
€ 53.2 million through own portfolio and € 90.5 million through the Joint Venture
Occupancy rate of 99.7% for the completed portfolio1
Record signed and renewed rental income of €42.5 million in 2019 YTD2
1 Including 100% of JV assets
2 As of 31 October 2019 173 …has resulted in a diversified investment portfolio
Investment portfolio breakdown 1
Country breakdown Completed vs Under Construction vs Land Bank
Netherlands
Romania €71mm Other Development land
€75mm 3% €149mm €258mm
Slovakia 3% 7% 11%
Under
€88mm
Construction
4%
€272mm
12%
Spain
€170mm Germany
8% €1,277mm
57%
Czech Republic
€418mm Completed
19% €1,719mm
76%
The Investment portfolio has grown from €1,936 million at YE2018 to €2,249 million at
H1 2019, up 16%1
Geographical split is becoming increasingly diversified as we have entered into new markets
over the last 18 months
As of H1 2019, Western Europe represents 69% of total portfolio1 and 76% of operating
EBITDA (incl JV at share)
As of 30 June 2019
1 Including 100% of JV assets
183 VGP has grown to become one of the top tier developer and
manager/owners in Germany
Significant expansion of German portfolio1 26 parks across
completed and under construction… Germany… ……with several repeat tenants3
GLA (million m2)
2 2
1,306
2
Berlin
1,043 3 2
892 Hamburg 3
2
Frankfurt 3
456 2
311
2 2
Munich
2
2015 2016 2017 2018 Oct-19 Number of rent contracts at different parks
GAV (€ mm) 1,277 Occupancy 99.3%
…whilst future potential 2 in Germany is
Key milestones in Germany No. of parks 27 Contracted rent (€ mm) 83.0
keeping pace
GLA (million m2) Entry and rapid expansion into German market since 2013
Acquisition of >500k m2 land plot in Hamburg at the end of Dec 2013
Development of a state-of-the-art 60k m2 Amazon fulfilment centre in Frankenthal
808 (Rheinland Pfalz) announced in Nov 2016
New business park in Munich for BMW and KraussMaffei with 311k m2 of lettable space
announced in Jul 2019 - the largest relocation project in the greater Munich area since
425 437 the airport was relocated from Riem to Erding in 1992
314 Partnership with Allianz Real Estate strengthened VGP’s positioning in the market
204 Well positioned to enjoy the strength of the German logistics market
- 2018 saw the highest ever volume of letting space taken up in the German logistics market
(>6.6mm of m2 letting)
2015 2016 2017 2018 Oct-19
1. German portfolio of completed and under construction assets (incl JV at 100%)
2. Potential of the land bank in full ownership
3. Repeat contracts with German companies or tenants active in Germany4
Portfolio leased on a long-term basis to a diversified and blue-chip
customer base
Weighted average term of the portfolio Blue-chip top 10 Tenants (JV at 100%)
Combined 8.8 years KraussMaffei 18.2%
Amazon 7.9%
JV 7.0 years
Rhenus 5.6%
Own 12.1 years Drylock 2.6%
4PX Express 2.3%
years 0 2 4 6 8 10 12 14
BMW 2.3%
First Break WALT Volkswagen 2.1%
Tenant portfolio breakdown – by industry segment Lidl 1.8%
Other Lekkerland 1.8%
10% Decathlon 1.6%
Automotive-related Light industrial
12% 31%
E-commerce
21% Logistics
26%
Diversified customer base Top 10 clients count for 46.1%
As of 31 October 2019 205
Track record of realising value creating opportunities once pre-let
is largely secured
On balance sheet opportunities Growth framework
1 3
Acquisition of c.2.50 mm m2 of land in
1.38 mm m2 of landbank
2019 (1.36 mm m2 of GLA)
Under construction
255k m2 GLA completed in past 10
as of Oct 2019 months (100% let as of 31 Oct 19)
0.70 mm m2 of GLA
Run rate 705k m2 under construction and a
development and further 230k m2 in immediate pipeline
2 pre-let target – in total >75% pre-let1
6.18mm m2 of landbank
Remaining
potential
Target for under construction 80%
pre-let
2.77mm m2 of GLA
On balance sheet landbank Track record of consistent
ensuring full visibility on additional development with pre-let largely
2.77mm m2 of GLA secured
Source: Company information as of 30 June 2019
Note: “Under construction” refers to assets under construction; “Remaining potential” refers to remaining landbank already on the balance sheet of the Company or contractually locked in
All figures include Own portfolio and 100% of the JV portfolio
1 Excluding the immediate pipeline projects the portfolio under construction as of 31 Oct 2019 was 57% pre-let 215
Well advanced land bank to support future growth
Build-up of Land bank (m2) Land bank1 – geographic breakdown
7,010,000
6,180,000 830,000
Other 5%
Netherlands 4%
Hungary 5% Germany 34%
2,130,000
4,050,000 Spain 7%
2,850,0001,160,000
2,450,000
Slovakia 12%
1,250,000
Romania 14%
Czech Republic 19%
Land owned Deployed Acquired Secured Letters of
Dec 2018 2019YTD 2019YTD intent
1 Geographical breakdown of development
Owned and secured land bank potential (m2) of the owned and secured land bank
Total owned and secured land bank of 6.18 million m2 equates to development potential of 2.76 million m2
In addition, 0.83 million m2 of land under option, subject to due diligence, with 0.40 million m2 of
development potential
3.16 million m2 of development potential embedded in the Land bank
As of 31 Oct 2019
226
Executive management:
clear corporate matrix organization with advanced management tools
Corporate matrix structure VGP Management KPIs-app
Clear objectives
Check and balances
New positions: CIO, Group Controller, IR / BD
234. VGP-Allianz Real Estate partnership
Strategic partnership with Allianz Real Estate through two joint ventures
In Q1 2016 VGP entered into a 50/50 JV with
Allianz Real Estate (VGP European Logistics) for
a period of ten years with possible extensions
This JV has a right of first refusal at market
value for income generating assets developed
by VGP in Germany, Czech Republic, Hungary
and Slovakia
In July 2019 VGP entered into a second 50/50 JV
with Allianz Real Estate (“VGP European
Logistics 2”) also for a period of ten years with
possible extensions
This JV has a right of first refusal at market
value for income generating assets developed
by VGP in Austria, Italy, Netherlands, Portugal,
Romania and Spain
Two joint ventures, each with an investment target of €1.7 billion gross asset value (first JV already
reached c. € 1.4 billion)
25Strategic partnership with Allianz Real Estate through two joint ventures
Objective: build a platform of new, grade A logistics and industrial properties with a key focus on expansion
in its core mature European markets and high growth CEE markets with the aim of delivering stable income-
driven returns with potential for capital appreciation
Key Portfolio size: aim to increase the portfolio size of each of the two JVs to c. €1.7 billion exclusively via the
characteristics contribution to the JVs of new logistics developments carried out by VGP)
Investment criteria: clear and formal criteria set out wherein the JVs will operate
Decision making process: transparent process in place to decide on approval of the assets
Additional VGP provides development management services and acts as asset manager and property manager and is
services also responsible for facility management and leasing services for the assets in the JV portfolio
This structure allows VGP to:
(Partially) recycle its initial invested capital when completed projects are acquired by the JV;
Result Re-invest disposal proceed in the continued expansion of the development pipeline, including the further
expansion of the landbank; and
Concentrate on its core development activities
Driving sustainable growth through develop and hold strategy with long term partner whilst
maximizing cash recycling return through optimal capital allocation
Source: Company information as of 30 June 2019
26Track record of the two joint ventures: €876 million of net cash proceeds
First JV: VGP European Logistics Second JV: VGP European Logistics 2
€176mm €96mm
GAV: c.€500mm GAV: c.€175mm
net cash net cash
Closing I Closing I
(May ‘16) 15 parks (28 buildings) in Germany, Czech (Jul ‘19) 3 parks (8 buildings) in Spain, Austria and
Republic, Slovakia and Hungary Romania
€59mm
GAV: c.€80mm net cash
Closing II
(Oct ‘16)
5 buildings in Germany and Slovakia
€122mm
GAV: c.€173mm
net cash
Closing III
(May ‘17) 6 parks (7 buildings) and 4 newly completed
buildings in Germany and Czech Republic
€290mm
GAV: c.€400mm
net cash
Closing IV
(May ‘18) 6 parks (13 buildings) and 5 newly completed
buildings in Germany, Czech Republic and Hungary
€130mm
GAV: c.€203mm net cash
Closing V
(Apr ‘19) 3 parks (3 buildings) and another 6 newly completed
buildings in Germany and Czech Republic
VGP net cash proceeds of €780mm from First JV VGP net cash proceeds of €96mm from Second JV
27High standards of corporate governance within both
VGP-Allianz joint ventures
4 managers: 2 appointed by VGP and 2 by Allianz Real Estate
Board of
Director Decisions about relevant activities are required to be made with unanimous consent of both parties
composition
Rotating Chairman with no casting vote
JV has right of first refusal in relation to acquiring income generating assets in its designated
countries
Specific investment criteria agreed for an initial investment period of five years
Acquisition
process When meeting the criteria, JV is required, in principle, to acquire proposed assets
At each closing, independent valuation (generally) required for assets being acquired
In case JV does not acquire the proposed assets, VGP allowed to sell to 3rd parties at open market
VGP has sell down right up until 25% without affecting transaction structure
In case of consolidation requirement due to legal requirements Allianz Real Estate can replace all
Other
bank debt by own equity without triggering any dilution for VGP
In case of a financing crisis same non-dilution rule will apply
Source: Company information as of 30 June 2019
1 Territorial scope can be extended to include other countries subject to mutual agreement between VGP and Allianz Real Estate
287. Summary financial profile
Income Statement
Operating profit up €5 million to €96.1million Income statement (€ million)
Jun '19 Jun '18
Increased profit share from JV (+ €4.5 14.8 15.7
Revenue
million) and net valuation gains (+ €3.6
Gross rental income 7.4 9.0
million) more than offsetting lower net
Property operating expenses (0.9) (0.6)
rental income (- €1.9 million) and higher
admin expenses (€1.5 million) Net rental income 6.4 8.3
Joint venture management fee income 4.9 4.6
On a “look-through”- basis 1 net rental is up 65.3 61.7
Net valuation gains on investment properties
€ 3.5 million (17%) to € 24.2 million, despite
Administration expenses (9.9) (8.4)
the sale of Mango
Share in result of JV 29.3 24.8
Net valuation gains on the property portfolio Operating profit 96.1 91.1
of € 65.3 million
The own standing property portfolio is Financial income 2.5 3.5
valued on a weighted average yield of Financial expense (9.7) (9.6)
6.40% (vs. 6.29% as at 31 Dec ’18)2 Net financial result (7.1) (6.1)
Administrative expenses of € 9.9 million
Profit before taxes 89.0 85.0
Higher admin running costs YoY reflects Taxes (13.9) (10.2)
expansion of VGP organisation over last Profit for the period 75.0 74.8
12 months
Taxes increased to € 13.9 million from
€10.2 million, reflecting change in country mix
1 Look-through basis includes VGP’s share of the JV net rental income
2 The (re)valuation of the own portfolio was based on the appraisal report of the property expert Jones Lang LaSalle
30Income Statement – by segment
Investment Development Property and Asset Management
H1 '19 H1 '18 H1 '19 H1 '18 H1 '19 H1 '18
Gross rental income 7.4 9.0 Gross rental income - - Gross rental income - -
Property operating expenses (0.1) (0.1) Property operating expenses (0.8) (0.6) Property operating expenses - -
Net rental income 7.3 8.9 Net rental income (0.8) (0.6) Net rental income - -
Joint venture management fee Joint venture management fee Joint venture management fee
- - - - 4.9 4.6
income income income
Net valuation gains on Net valuation gains on Net valuation gains on
investment properties destined - - investment properties destined 63.9 40.3 investment properties destined - -
to the JV to the JV to the JV
Administration expenses (1.1) - Administration expenses (7.3) (8.3) Administration expenses (1.3) 0.0
Share of JV's adjusted Share of JV's adjusted Share of JV's adjusted
17.3 11.7 - - - -
operating profit after tax operating profit after tax operating profit after tax
EBITDA 23.5 20.6 EBITDA 55.7 31.4 EBITDA 3.6 4.6
Share in result of JV up €5.6 million Valuation gains/(losses) on Revenues includes joint venture
corresponds to VGP’s share in the investment properties related to property and asset management
result of the JV excluding any countries outside the JV perimeter income and development
revaluation result have been excluded, i.e. Latvia management income
Please note the segment reporting disclosure in our H1 2019 press release for overview of adjustments to operating EBITDA
31Balance sheet - assets
Investment Properties of €541 million, up €73 30 Jun '19 31 Dec '18
million since Dec ’18, despite €203 million ASSETS
closing with JV Investment properties 541.0 468.5
Investment in joint venture and associates 298.7 241.4
Completed portfolio has decreased by
Other non-current receivables 53.1 41.5
€20 million to €102 million
Other non-current assets 4.0 1.6
HFS has increased €16 million to Total non-current assets 896.8 753.0
€291 million
Under Construction has increased by Trade and other receivables 22.7 23.1
€70 million to €205 million Cash and cash equivalents 72.7 161.4
Disposal group held for sale 291.0 274.9
Development land has increased by
Total current assets 386.4 459.4
€22 million to €235 million
Investment in Joint Venture and associates TOTAL ASSETS 1,283.2 1,212.4
increased by €57 million to €299 million
reflecting the fifth closing with the first JV and
property appreciation
Cash position of €73 million
32Balance sheet – Shareholders’ equity and liabilities
30 Jun '19 31 Dec '18
Shareholders’ equity of €569 million, up €26
SHAREHOLDERS' EQUITY AND LIABILITIES
million since Dec ‘18
Shareholders' equity 569.2 543.5
Total liabilities of €714 million, up €45 million
since Dec ‘18 Non-current financial debt 564.9 564.4
Other non-current (financial) liabilities 37.8 3.5
Increase in non-current financial
Deferred tax liabilities 18.0 22.9
liabilities mainly due to remaining
balance due in respect of acquired Total non-current liabilities 620.7 590.7
development land of VGP Park Bratislava
(€ 26.4 million) Current financial debt 11.7 22.5
Trade debt and other current liabilities 45.0 46.4
Gearing at the end of 2018 stood at 39.8%1
Liabilities related to disposal group HFS 36.5 9.3
Company’s target maximum Total current liabilities 93.3 78.2
consolidated gearing of 65%
Total liabilities 714.0 669.0
TOTAL SHAREHOLDERS' EQUITY AND 1,283.2 1,212.4
LIABILITIES
1 Calculated as Net debt / Total equity and liabilities
33Financial key ratios
Gearing ratio (%) Unencumbered assets (€ million)
80% 94% 93% 95%
100 675.0
590.4 537.2
80 600
Covenants:8. Governance
VGP’s board has been strengthened with three highly qualified female
independent directors to help drive sustainable growth
Board of directors Audit committee
Bart Van Malderen (Reference Shareholder) Year Executive or Next due
Chairman; Non-executive director Name appointe non- Independent for re-
Renewed appointed: 2017 (next due for re-election 2021) d executive election
Founder of Drylock Technologies in 2012 Ann
Non-
Prior to this, CEO and Chairman of Ontex Gaeremynck 2019 Independent 2023
executive
(Chairman)
Jan Van Geet (Reference Shareholder) Bart Van Non-
CEO and Executive director 2017 - 2021
Malderen executive
Renewed appointed: 2017 (next due for re-election 2021)
MD of WDP Czech Republic until 2005 Vera Gad̈ e- Non-
2019 Independent 2023
Started in 1993 and was manager of Ontex in Turnov Butzlaff executive
Mrs. Ann Gaeremynck (Belgian)
Non-executive independent director Remuneration committee
Year appointed: 2019 (next due for re-election 2023)
Professor of accounting and audit at the KU Leuven, Belgium Year Executive or Next due
Name appointe non- Independent for re-
d executive election
Mrs. Katherina Reiche (German) Bart Van
Non-executive independent director Non-
Malderen 2017 - 2021
Year appointed: 2019 (next due for re-election 2023) executive
(Chairman)
CEO of the Association of Municipal Enterprises (VKU) in Germany
Ann Non-
CEO of Westenergie (E.ON/ Innogy-group) 2019 Independent 2023
Gaeremynck executive
President of European Confederation of Public Employers and Enterprises (CEEP)
Member of German Bundestag and deputy chairman of the CDU/CSU fraction
Katherina Non-
2019 Independent 2023
Reiche executive
Mrs. Vera Gäde-Butzlaff (German)
Non-executive independent director Note: Bart Van Malderen and Jan Van Geet act as permanent representatives of
Year appointed: 2019 (next due for re-election 2023) VMI INVEST MV and Jan Van Geet S.R.O. respectively
Assistant Secretary of State for the Environment and Agri of Saxony-Anhalt
CEO of Berlin city cleaning and waste management companies (BSR)
CEO of GASAG AG, one of the largest regional German energy providers
Chairwoman of the Supervisory Board of Vivantes, the hospital group
369. Going green
All new buildings from 2020 onwards: BREEAM Very Good or equivalent
Various initiatives being implemented European solar panel roll-out
The large roofs of VGP’s logistics warehouses
are very well suited for the installation of solar
panels without imposing aesthetic damage to
local communities
So far 12.5MW of solar panels has been
installed and a further c.17MW is currently
under construction/planned
VGP Park Berlin & Munich – green roofs and water recycle
VGP Park Berlin and Munich are fitted with
green roofs for sustainable isolation and
rainwater recycling
We offer electric charging stations for
employees and trucks at our latest logistics Sanitation
parks
VGP Park Berlin & Munich – green roofs VGP Park Munich – Electric truck and car parks
38European PV-system roll-out
VGP Park Frankenthal – Europe’s largest solar rooftop system in 2016 (15,000 modules – 4MWp)
PV-systems in operation Dec-2018 PV-system European roll-out (in design phase)
So far 12.5MW of solar panels has been
installed and a further c.17MW is
currently under construction/planned
3910. Recent landmark developments
VGP Park München

                   41
VGP Park München
42VGP Park München
Building Land plot Total GLA Tenant
GERMUER - A1 94,439 m² 38,380 m² BMW
GERMUER - A2 37,244 m² 15,136 m² BMW
GERMUER - PHN 4,615 m² 22,190 m² KMT
GERMUER - B 200,325 m² 81,413 m² KMT
GERMUER - C 119,266 m² 48,470 m² KMT
GERMUER - D 99,355 m² 40,378 m² [KMT]
GERMUER - F 18,421 m² 7,486 m² KMT
GERMUER - PHS 4,615 m² 19,418 m² KMT
GERMUER - E 95,969 m² 39,002 m² KMT
TOTAL 674,248 m² 311,873 m²
• Construction works started in September 2019
Landmark development in München
KraussMaffei – Largest lease agreement signed by VGP
43VGP Park München
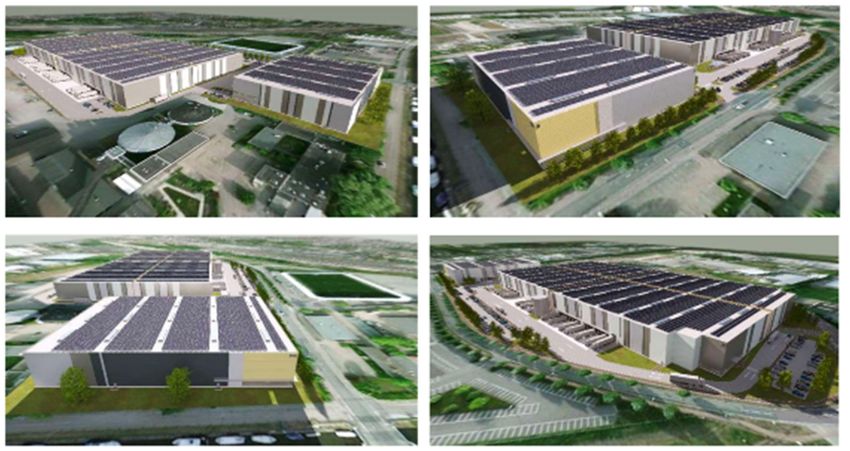
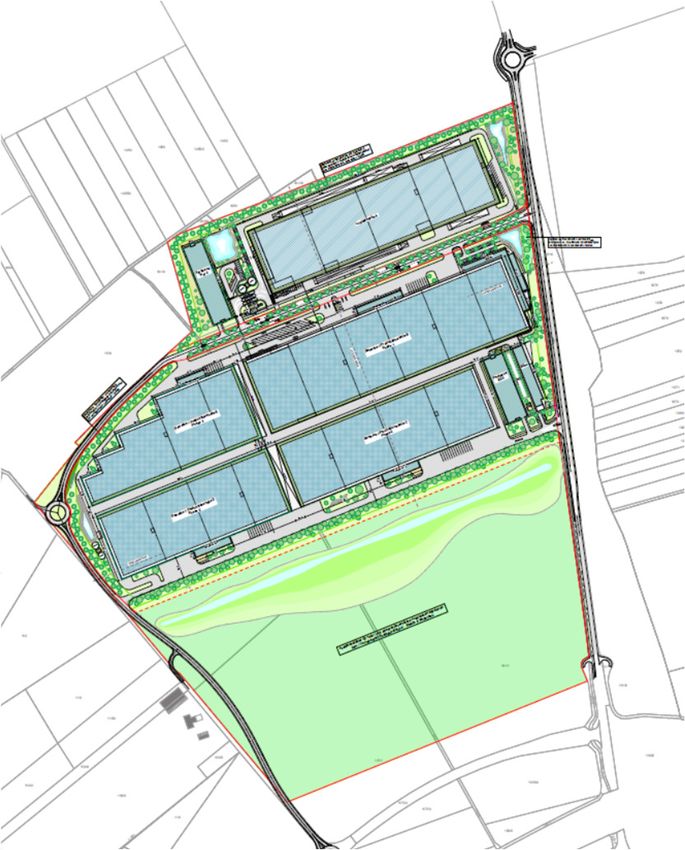
44VGP Park Laatzen
45VGP Park Laatzen
46VGP Park Laatzen
LOCATION —Laatzen (Hannover)
• 284.847 m2 development land. First part
(236,296 m²) acquired in Aug-19, second
part (48,691 m²) to be settled in Jan-20
• Pre-let with KraussMaffei
- 20 year lease
- Lease start: May-22
Building Land Plot Total GLA Status
GERLAA - A 114,365 m² 54,728 m² KMT
GERLAA - PHO (Parkhaus)
24,346 m² 1 m² KMT
KraussMaffei
GERLAA - B 24,364 m² 11,659 m² Development
GERLAA - C1 49,386 m² 23,633 m² Development
GERLAA - C2 48,182 m² 23,057 m² Development
GERLAA - D 24,346 m² 7,604 m² Development
TOTAL 284,987 m² 120,682 m²
47VGP Park Osterweddingen (Magdeburg)
48VGP Park Osterweddingen (Magdeburg)
Building Land Plot Total GLA Status
GERMAG - A 54,619 m² 26,365 m² Development LOCATION — Osterweddingen (Magdeburg)
GERMAG - B 72,715 m² 35,100 m² Development
• 604,858 m2 development land acquired
GERMAG - C 65,522 m² 31,628 m² Development
GERMAG - D 65,522 m² 31,628 m² Development
in Jun-19.
GERMAG - E 115,870 m² 55,931 m² Development
GERMAG - F 115,870 m² 55,931 m² Development
GERMAG - G 60,088 m² 29,005 m² Development
GERMAG - H 54,652 m² 26,381 m² Development
TOTAL 604,858 m² 291,969 m²
4911. Closing remarks
VGP in a nutshell

      Fully integrated business model combining a unique expertise as a developer, asset
      manager and owner of high-quality logistics assets in Europe

      Rapid de-risking and cash recycling for all new projects through strategic
      partnership with Allianz

      Well located and diversified asset portfolio in Europe’s growing economies

      Growing recurring rental income base through well-leased portfolio with a blue-chip
      customer base

      Prime landbank with construction risk well managed as VGP in most cases acts as
      General Contractor and imposes strict pre-letting requirements

      Experienced and highly committed management team with proven track record

                                                                                            51
Disclaimer
ABOUT VGP
VGP is a leading pan-European developer, manager and owner of high-quality logistics and semi-industrial real
estate. VGP operates a fully integrated business model with capabilities and longstanding expertise across the
value chain. The company has a well-advanced development land bank of 7.0 million m² and the strategic focus is
on the development of business parks. Founded in 1998 as a family-owned real estate developer in the Czech
Republic, VGP with a staff of over 200 employees today owns and operates assets in 12 European countries directly
and through VGP European Logistics, a joint venture with Allianz Real Estate. As of June 2019, the Gross Asset
Value of VGP, including the joint venture at 100%, amounted to €2.2 billion and the company had a Net Asset Value
(EPRA NAV) of €604 million. VGP is listed on Euronext Brussels and on the Prague Stock Exchange (ISIN:
BE0003878957).
For more information, please visit: http://www.vgpparks.eu
Forward-looking statements: This presentation may contain forward-looking statements. Such statements reflect
the current views of management regarding future events, and involve known and unknown risks, uncertainties and
other factors that may cause actual results to be materially different from any future results, performance or
achievements expressed or implied by such forward-looking statements. VGP is providing the information in this
presentation as of this date and does not undertake any obligation to update any forward-looking statements
contained in this presentation in light of new information, future events or otherwise. The information in this
document does not constitute an offer to sell or an invitation to buy securities in VGP or an invitation or inducement
to engage in any other investment activities. VGP disclaims any liability for statements made or published by third
parties and does not undertake any obligation to correct inaccurate data, information, conclusions or opinions
published by third parties in relation to this document or any other document or press release issued by VGP.
52You can also read